In the multisector growth category, funds in the cheapest fee quintile achieved an 87% success rate. Funds in the most expensive quintile managed 14%. That single data point, drawn from Morningstar Australia analysis published this week and covering data through December 2025, is among the most striking illustrations of how the impact of fund fees compounds into investor outcomes over time. Fee awareness has been a regulatory and industry drumbeat in Australia for years, amplified by APRA’s performance test regime and ASIC’s value-for-money messaging. Yet the gap between knowing fees matter and understanding the precise mechanism by which they destroy or preserve wealth remains wide for many investors. What follows unpacks the latest Morningstar data, explains the compounding mechanics that make fees such a reliable predictor, examines where the relationship holds most powerfully and where it breaks down, and offers a practical framework for applying fee awareness to fund selection.
The numbers that make the case: what Morningstar’s latest data found
The headline finding is stark. Across multisector growth funds, Morningstar Australia found that the cheapest fee quintile delivered an 87% success rate, defined as surviving the period and outperforming the category median, while the most expensive quintile delivered just 14%. That is roughly a six-fold difference in the probability of a successful outcome based on where a fund sits on the fee spectrum.
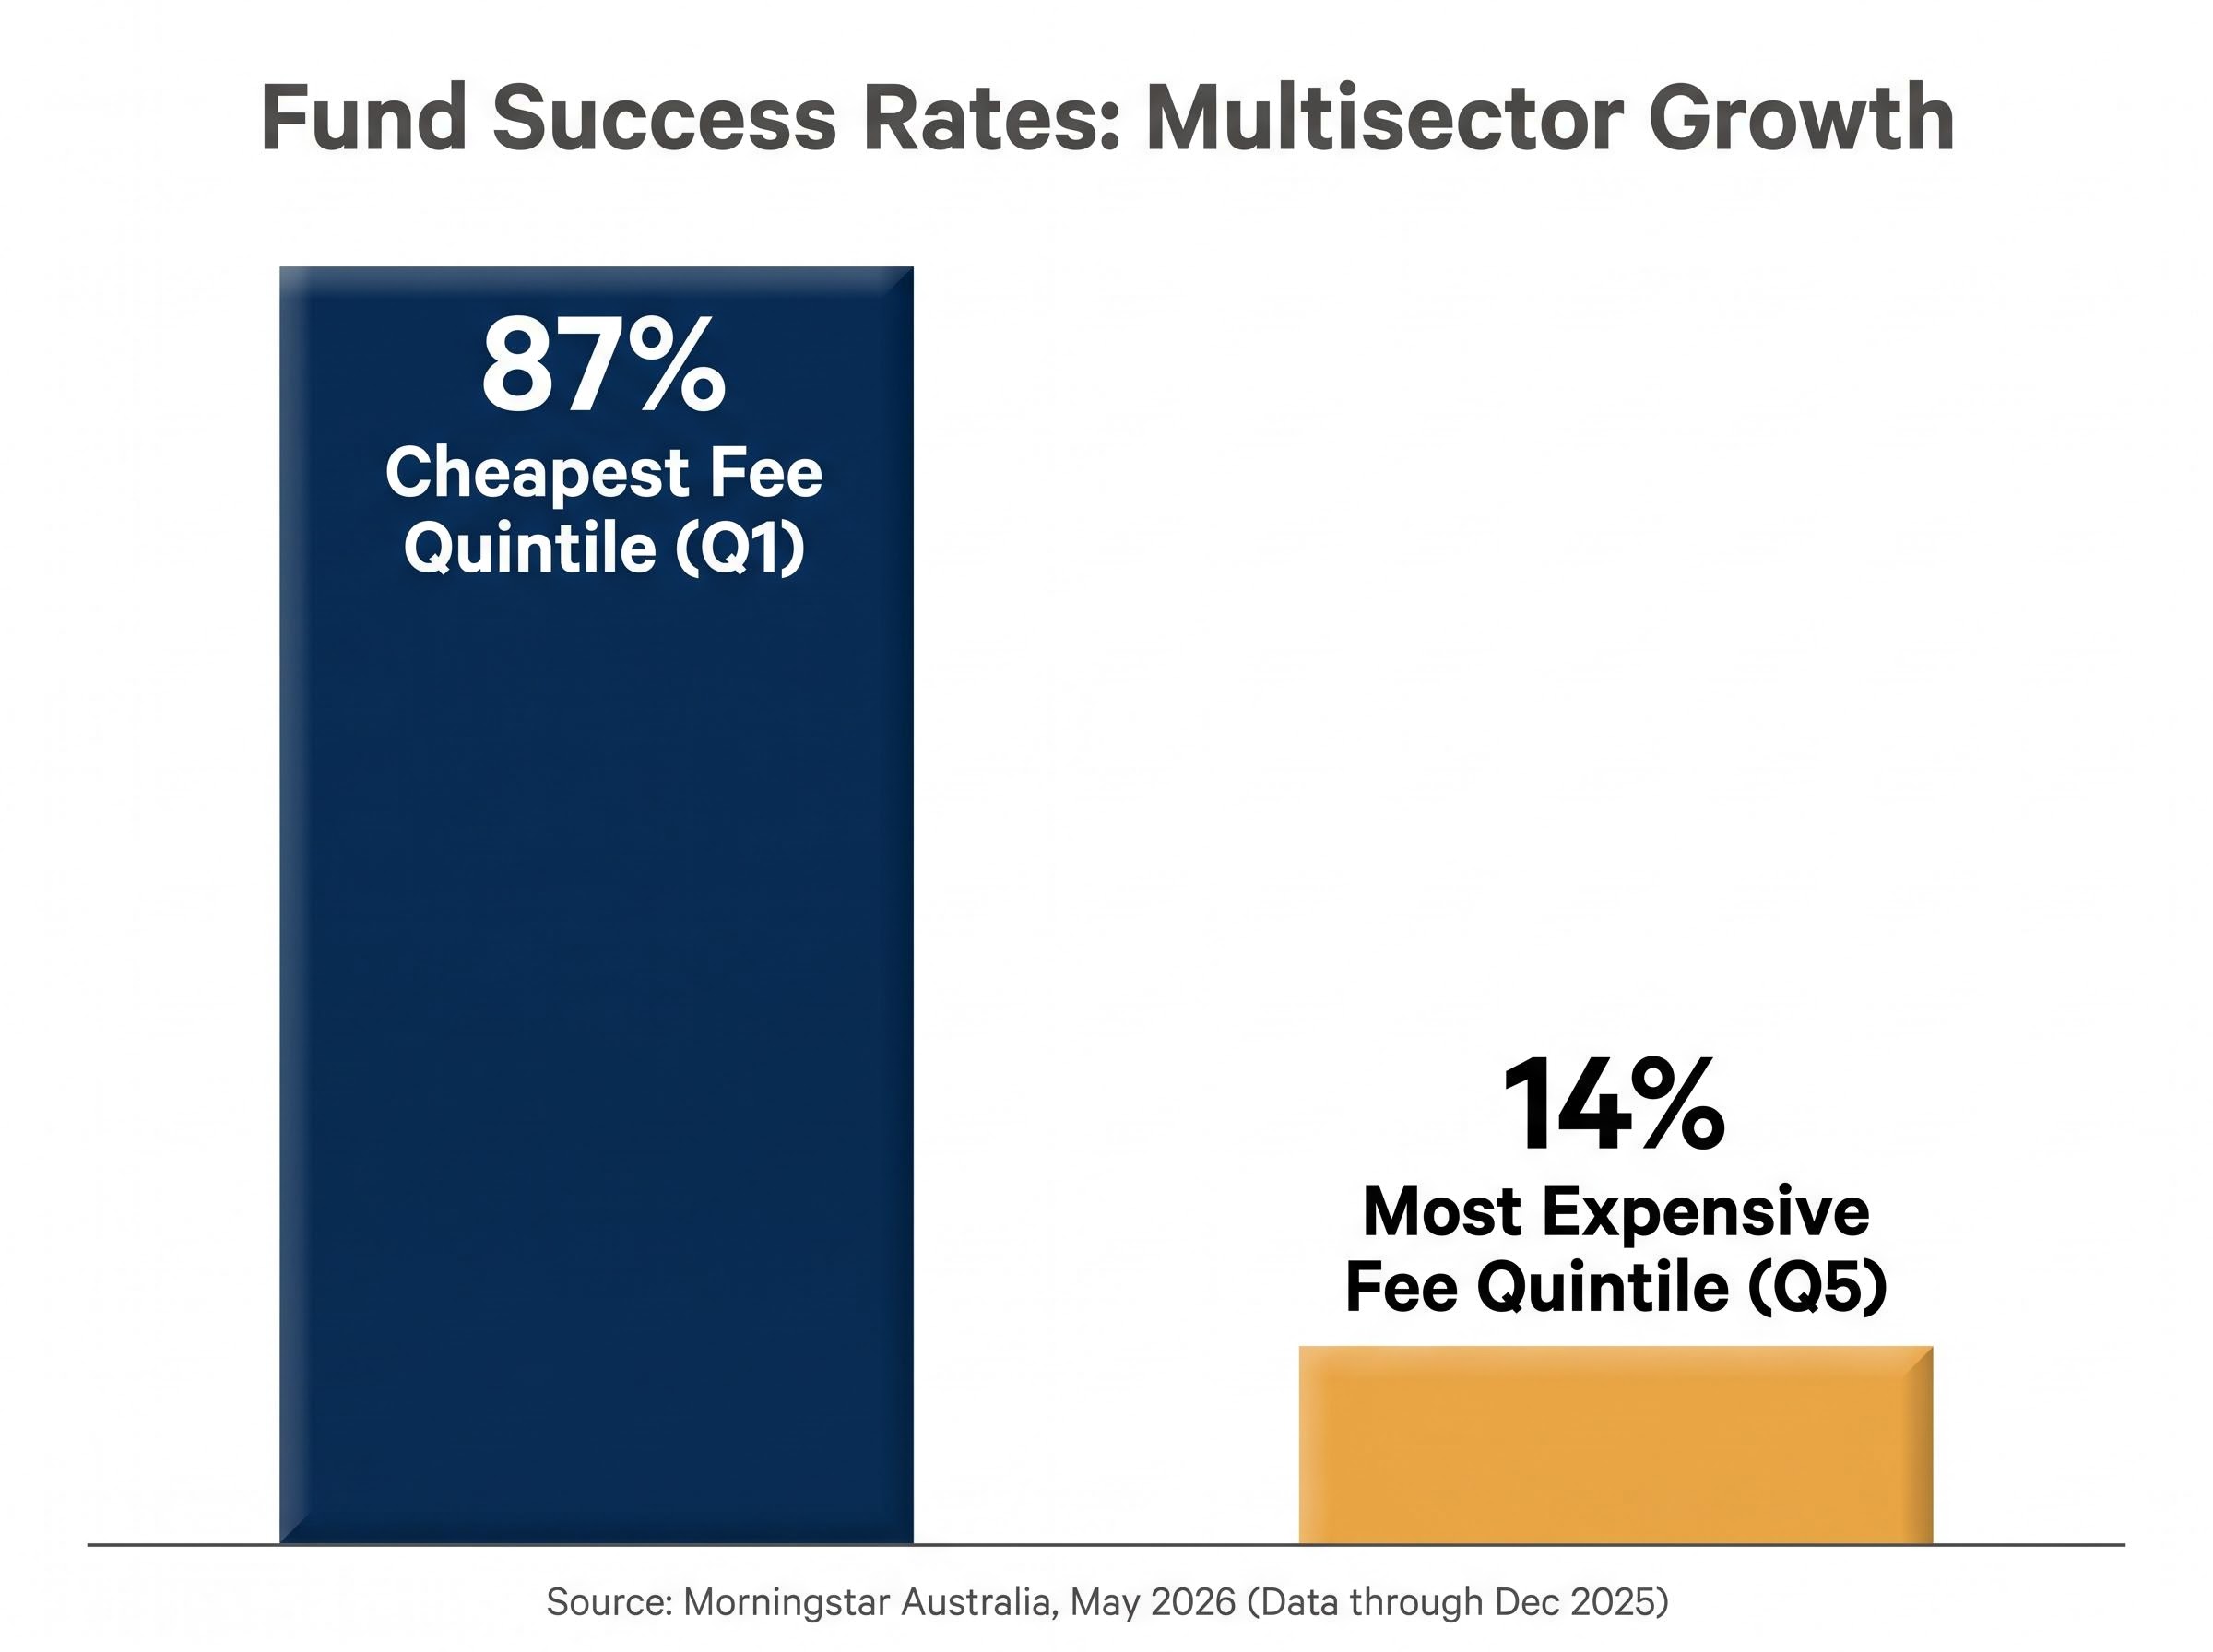
Key finding: Funds in the cheapest fee quintile achieved an 87% success rate in multisector growth. Funds in the most expensive quintile: 14%.
Multisector growth showed the widest divergence of any category examined, but it was not an outlier. In Australian large-cap equities, success ratios declined progressively at each successive fee quintile, reinforcing the same inverse relationship. The pattern repeated across nearly all major fund categories studied.
Active fund benchmark underperformance is more persistent than most investors expect: approximately 88% of active global equity funds in Australia failed to beat their benchmarks over 15 years, a finding from the SPIVA Australia Year-End 2025 scorecard that sits alongside Morningstar’s fee-success rate data as converging evidence that cost is the dominant variable in long-run outcomes.
Zunjar Sanzgiri, Senior Manager Research Analyst at Morningstar Australia, authored the analysis, which was published in May 2026 using data through December 2025.
| Fee Quintile | Success Ratio (Multisector Growth) |
|---|---|
| Cheapest (Q1) | 87% |
| Q2 | High |
| Q3 | Moderate |
| Q4 | Low |
| Most Expensive (Q5) | 14% |
The data transforms the fee discussion from abstract advice into a quantified performance gap. For Australian investors choosing between growth fund options, the difference in expected outcomes between cheapest and most expensive quintiles is not marginal.
When big ASX news breaks, our subscribers know first
Why fees are a compounding drag, not just a line item
The Morningstar data quantifies the outcome. The mechanism that produces it is compounding, the same force that grows wealth when working in an investor’s favour and quietly erodes it when working against them.
Fees are structurally different from other variables that influence fund performance. Manager skill, market timing, and asset allocation shifts are uncertain and variable; a fund manager may outperform one year and underperform the next. Fees, by contrast, are certain, ongoing, and deducted every single year regardless of market conditions or portfolio positioning.
ETF management fee compounding operates through the same mechanism: fees are deducted daily from the fund’s net asset value and never appear as a separate charge, which makes them structurally easy to underestimate while the erosion accumulates silently across every compounding period.
The compounding logic works in three steps:
- The fee is deducted from the portfolio’s value before the remaining balance compounds into the next period.
- A smaller base compounds each subsequent year, meaning the investor misses not just the fee itself but the growth that fee amount would have generated.
- The gap between a lower-fee and higher-fee portfolio widens non-linearly over time, accelerating as the compounding periods accumulate.
The Productivity Commission’s widely cited findings reinforce this: fee differences of 0.5-1.0% per annum compound into very large dollar differences over working lifetimes.
Putting a dollar figure on the difference
Consider two hypothetical portfolios, each starting with $100,000 and earning a gross annual return of 7% over 20 years. The only difference is the annual fee: 0.50% in one case, 1.50% in the other.
At 0.50% per annum, the portfolio grows to approximately $352,000. At 1.50% per annum, it reaches approximately $290,000. That 1.0% annual fee difference produces a gap of roughly $62,000, more than 60% of the original investment, purely from the compounding effect of higher fees.
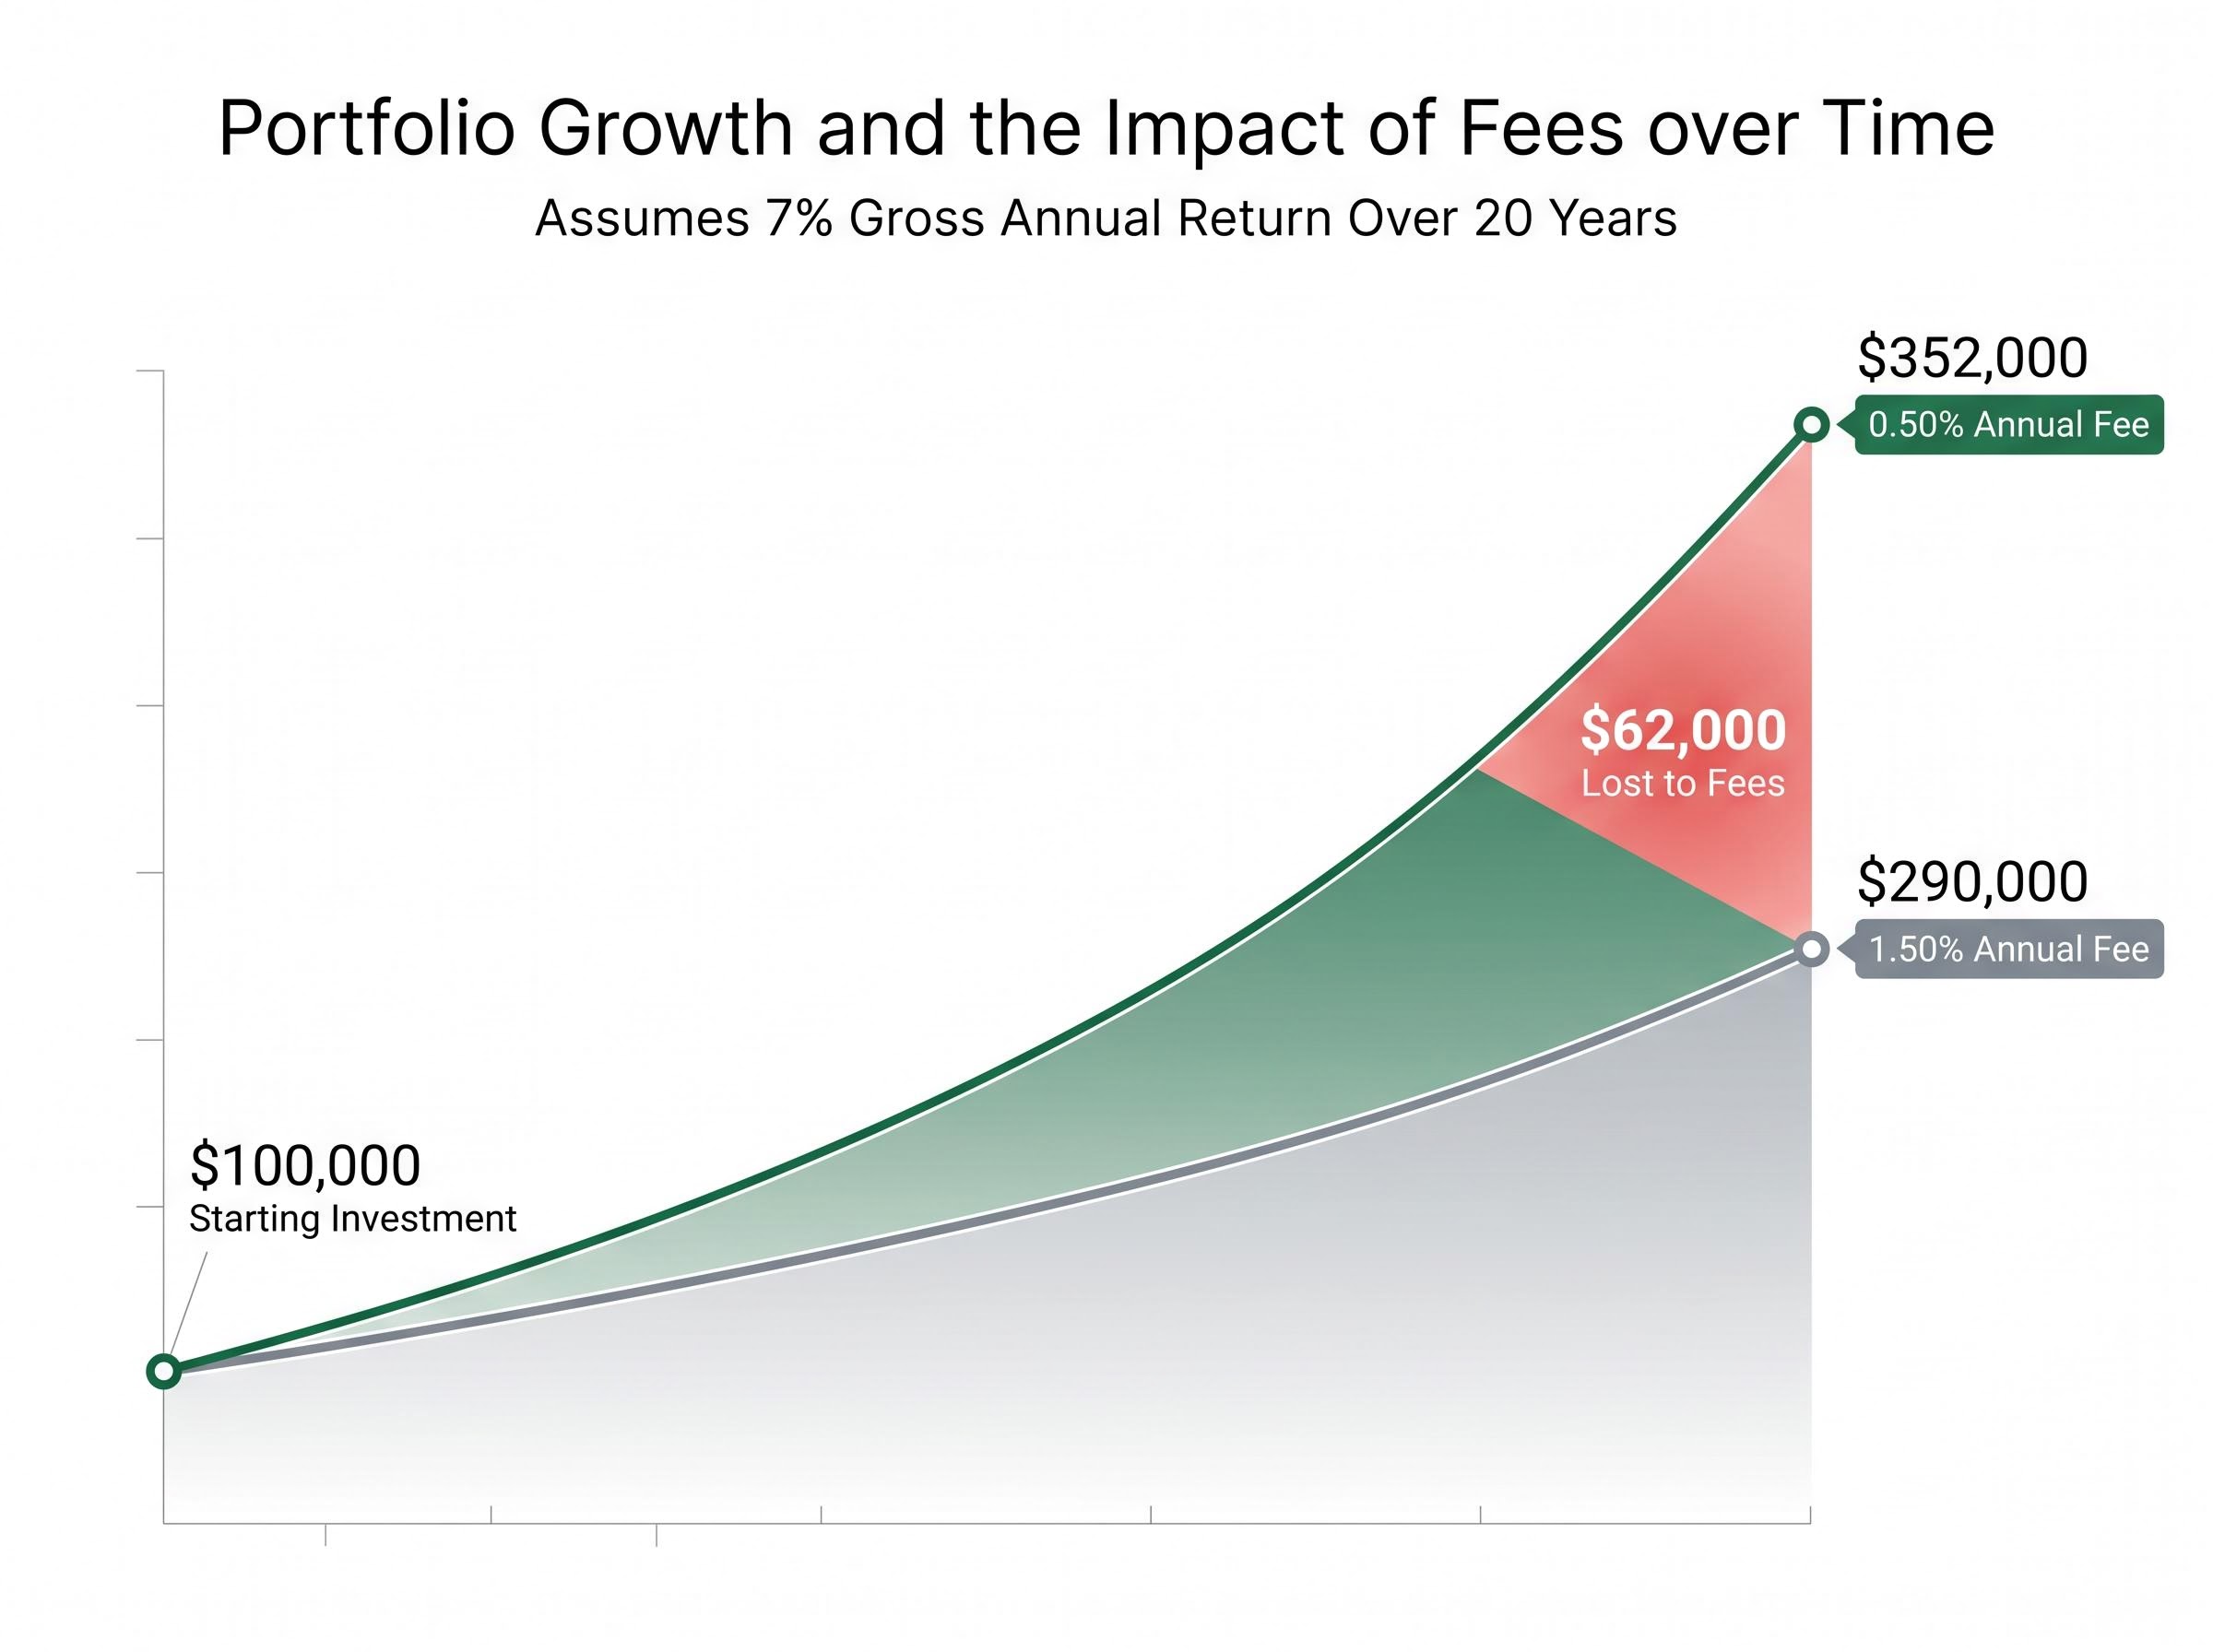
Typical Australian fee ranges make this gap real, not theoretical. Cheapest-quintile options (index ETFs and ETF-of-ETF structures) often charge 0.25-0.60% per annum, while higher-cost retail multi-manager options can reach 1.3-1.8% or more.
These figures are illustrative only and do not constitute a return guarantee. Actual outcomes depend on fund performance before fees and market conditions.
How Morningstar’s rating system now builds fees directly into assessments
The fee-performance relationship has moved from research finding to embedded market infrastructure. In April 2026, Morningstar introduced the Medalist Rating Price Score, a dedicated component within its fund rating methodology that makes a fund’s fee level explicitly visible as a competitive advantage or drag.
Methodology update: Morningstar’s Medalist Rating Price Score, introduced April 2026, directly connects fee competitiveness to fund ratings for the first time as a standalone score.
The directional mechanism is straightforward: lower-cost funds receive a rating boost relative to higher-cost peers, while more expensive funds receive a discount. The Price Score captures:
The Medalist Rating Price Score ranks a fund’s fees against category peers on a scale from -2.5 to +2.5, with the weighting set at 40% for passive funds and 30% for active funds, meaning a low-cost ETF such as VAS can move from a lower designation to Gold purely on fee competitiveness before qualitative factors are applied.
- A fund’s fee level relative to its category peers
- The direction of the rating adjustment (positive for cheaper, negative for more expensive)
- The relationship between fee competitiveness and qualitative factors, which remain important inputs
Qualitative assessments of investment team, investment process, and parent organisation are still weighted within the broader Medalist framework. The methodology is not a pure cost screen. It is an evidence-based integration of cost within a broader quality assessment.
For Australian investors and advisers who use Morningstar research in fund selection, fee competitiveness is now explicitly surfaced in ratings rather than requiring a separate evaluation step.
Where the fee rule breaks down: the fixed income exception
The inverse fee-performance relationship is not universal. Morningstar’s analysis identified fixed income as a notable exception: the three middle expense ratio quintiles, predominantly active and competitively priced strategies, delivered relatively better outcomes than the cheapest quintile during the study period.
The reason sits in how passive fixed income indices are constructed. Index-tracking bond funds, which cluster in the cheapest quintile, carry structural biases including issuance weighting and concentrated interest rate risk. In volatile, rate-sensitive environments, where capital preservation rather than return generation is the primary challenge, these biases can work against passive strategies. Skilled active managers who can adjust duration, credit exposure, and sector allocation have a genuine edge in such conditions.
Academic research supports the finding with a caveat. Active fixed income managers can generate gross alpha, but net alpha often shrinks after fees, transaction costs, and risk adjustment. The exception has limits, and the conditions that favour it (rate volatility, credit stress) are not permanent.
| Asset Class | Fee-Performance Relationship |
|---|---|
| Multisector Growth | Strong inverse |
| Large-Cap Equities | Strong inverse |
| Fixed Income | Mixed / exception |
| Small / Mid Caps | Moderate / skill-dependent |
The small-cap caveat
In less liquid, less researched segments like Australian small and mid caps, manager skill and information advantages are more observable. Dispersion between the best and worst performers is wider, and fees become a less dominant predictor of outcomes. Higher fees may be justifiable in this segment where there is a clear, evidence-based case for manager edge, a view consistent with both Morningstar and academic commentary.
What the regulatory environment tells investors about the fee-performance link
Morningstar’s findings do not exist in isolation. They sit within a regulatory architecture that has been systematically embedding fee assessment into Australian market infrastructure.
APRA’s MySuper Performance Test uses fees as a core lens for assessing whether superannuation products deliver value. High fees have been a primary contributor to “fail” outcomes, and funds that fail face direct supervisory pressure to merge, restructure, or close. The performance test regime has already driven consolidation among persistently high-fee, underperforming products.
ASIC’s approach reinforces the same direction through different mechanisms:
- RG 97 requires clear, comparable fee disclosure and has shifted emphasis from “how to disclose” to “are members receiving value for what they pay?”
- Design and Distribution Obligations (DDO) connect fee levels to product suitability, requiring higher-cost, complex products to be targeted to investors who can reasonably benefit from them rather than distributed broadly to fee-sensitive retail investors.
- Enforcement actions have targeted funds with misleading fee representations or misaligned target market determinations.
Australia is described in Morningstar’s Global Investor Experience report as one of the most fee-competitive markets globally. Yet fee dispersion remains wide enough for the predictor relationship to hold. The regulatory direction creates a structural incentive: funds that cannot justify their fees face supervisory pressure, merger, or closure. That persistence risk itself is a hidden cost to investors through fund disruption and forced reinvestment.
The next major ASX story will hit our subscribers first
A practical fee framework for Australian fund selection
The analysis points to a concrete decision process. For core exposures, including multisector growth, large-cap Australian equities, and global equities, the data supports starting in the cheapest fee quintile and only moving up the fee spectrum when there is a specific, evidence-based case for manager skill or unique exposure.
The relevant fee figure is the all-in cost, not just the headline management fee. This includes the MER or ICR, administration and platform fees, advice fees where applicable, and transaction costs.
- Identify the all-in cost of each fund holding, including platform and administration fees that may sit outside the MER.
- Benchmark against category fee quintiles using tools such as APRA’s YourSuper comparison tool or Morningstar’s fund screener.
- Apply a core versus satellite framework: use low-cost index options for core exposures and require a documented, evidence-based case before accepting higher fees for active satellite positions.
- Factor in survivorship risk for persistently high-fee options, recognising that funds under regulatory pressure are more likely to merge or close, creating reinvestment disruption costs.
For context, broad index ETFs and ETF-of-ETF structures typically charge 0.25-0.60% per annum. Large industry super growth options sit at approximately 0.65-0.85% per annum for standard account balances. Higher-cost retail options can still reach 1.4-2.0% or more once platform and legacy fees are included.
The burden of proof for paying above the cheapest quintile should rest on a durable, repeatable source of added value, not past gross returns alone.
When paying more can be justified
Three contexts may warrant higher fees: fixed income during volatile or rate-sensitive conditions where active management can navigate structural index biases; Australian small and mid caps where skill dispersion is observable and information advantages exist; and specialist strategies such as private credit or complex alternatives offering exposures unavailable in passive form. Even in these cases, the fee must be proportionate to the expected net-of-fee, risk-adjusted advantage.
The cost of ignoring fees compounds just as surely as the fees themselves
Across most Australian fund categories, and most starkly in multisector growth, the cheapest funds are the most likely to succeed and the most expensive are the least likely. The 87% versus 14% success rate divergence is not a marginal finding. It is a structural feature of how fees interact with compounding over time.
The valid exceptions in fixed income and small caps signal a sophisticated framework rather than a mechanical rule. Fees should be the starting filter, not the only filter, and the bar for accepting higher costs should be high and evidence-based.
In Australia’s current environment, where APRA, ASIC, and institutional rating systems all embed fee assessment into their frameworks, fee awareness is not contrarian. It is aligned with the direction of the entire market infrastructure.
Investors can act on this analysis by checking the all-in cost of their current funds against category peers using APRA’s YourSuper comparison tool or Morningstar’s fund screener, and reviewing whether any higher-fee holdings are justified by the exception criteria outlined above.
For investors ready to apply this framework to specific holdings, our comprehensive walkthrough of managed fund due diligence covers PDS review, AFS licence verification on ASIC Connect, red flag screening, and goal alignment checks, with real-world lessons drawn from the 2024-2025 First Guardian and Shield Master Fund collapses involving approximately $1.1 billion in combined investor losses.
This article is for informational purposes only and should not be considered financial advice. Investors should conduct their own research and consult with financial professionals before making investment decisions. Past performance does not guarantee future results. Financial projections are subject to market conditions and various risk factors.