How Zero Commissions Changed the Maths on Thematic ETFs
5 hrs ago

A 0.9 percentage point difference in annual fees sounds trivial. Over 20 years, it can quietly erase more than $98,000 from an investment portfolio, with no market downturn, no bad timing, and no mistakes required. Australian investors now have access to more than 400 ETFs on the ASX, with management expense ratios ranging from as low as 0.03% to well above 1.00% per annum. Most investors spend considerable energy comparing fund mandates, historical returns, and provider brands, yet the single most predictable variable in long-term ETF performance is the one printed in the smallest font: the annual fee. This article explains how ETF management fees work mechanically, why the compounding effect of fees produces such dramatic long-term outcomes, what Australian research shows about the relationship between cost and performance, and how to find and compare fee information before committing to a product.
The fee that costs investors the most is the one they never receive a bill for. A Management Expense Ratio (MER) is an annual percentage of the fund’s total assets, covering management, administration, and operational costs charged by the provider. It is deducted daily from the fund’s net asset value (NAV), which means it reduces the ETF’s unit price incrementally rather than appearing as a separate charge on a brokerage statement.
That invisibility matters. Because the fee is already reflected in the price an investor sees on screen, most holders systematically underestimate their true fee exposure.
For investors newer to the asset class, a firm grasp of how ETFs work in Australia, including unit trust structure, ASX listing mechanics, and distribution treatment, provides the foundation needed to assess whether a quoted MER reflects the fund’s true cost profile.
A 0.07% MER on a $10,000 investment costs approximately $7 per year. Small in isolation, but this figure scales directly with portfolio size and compounds over time.
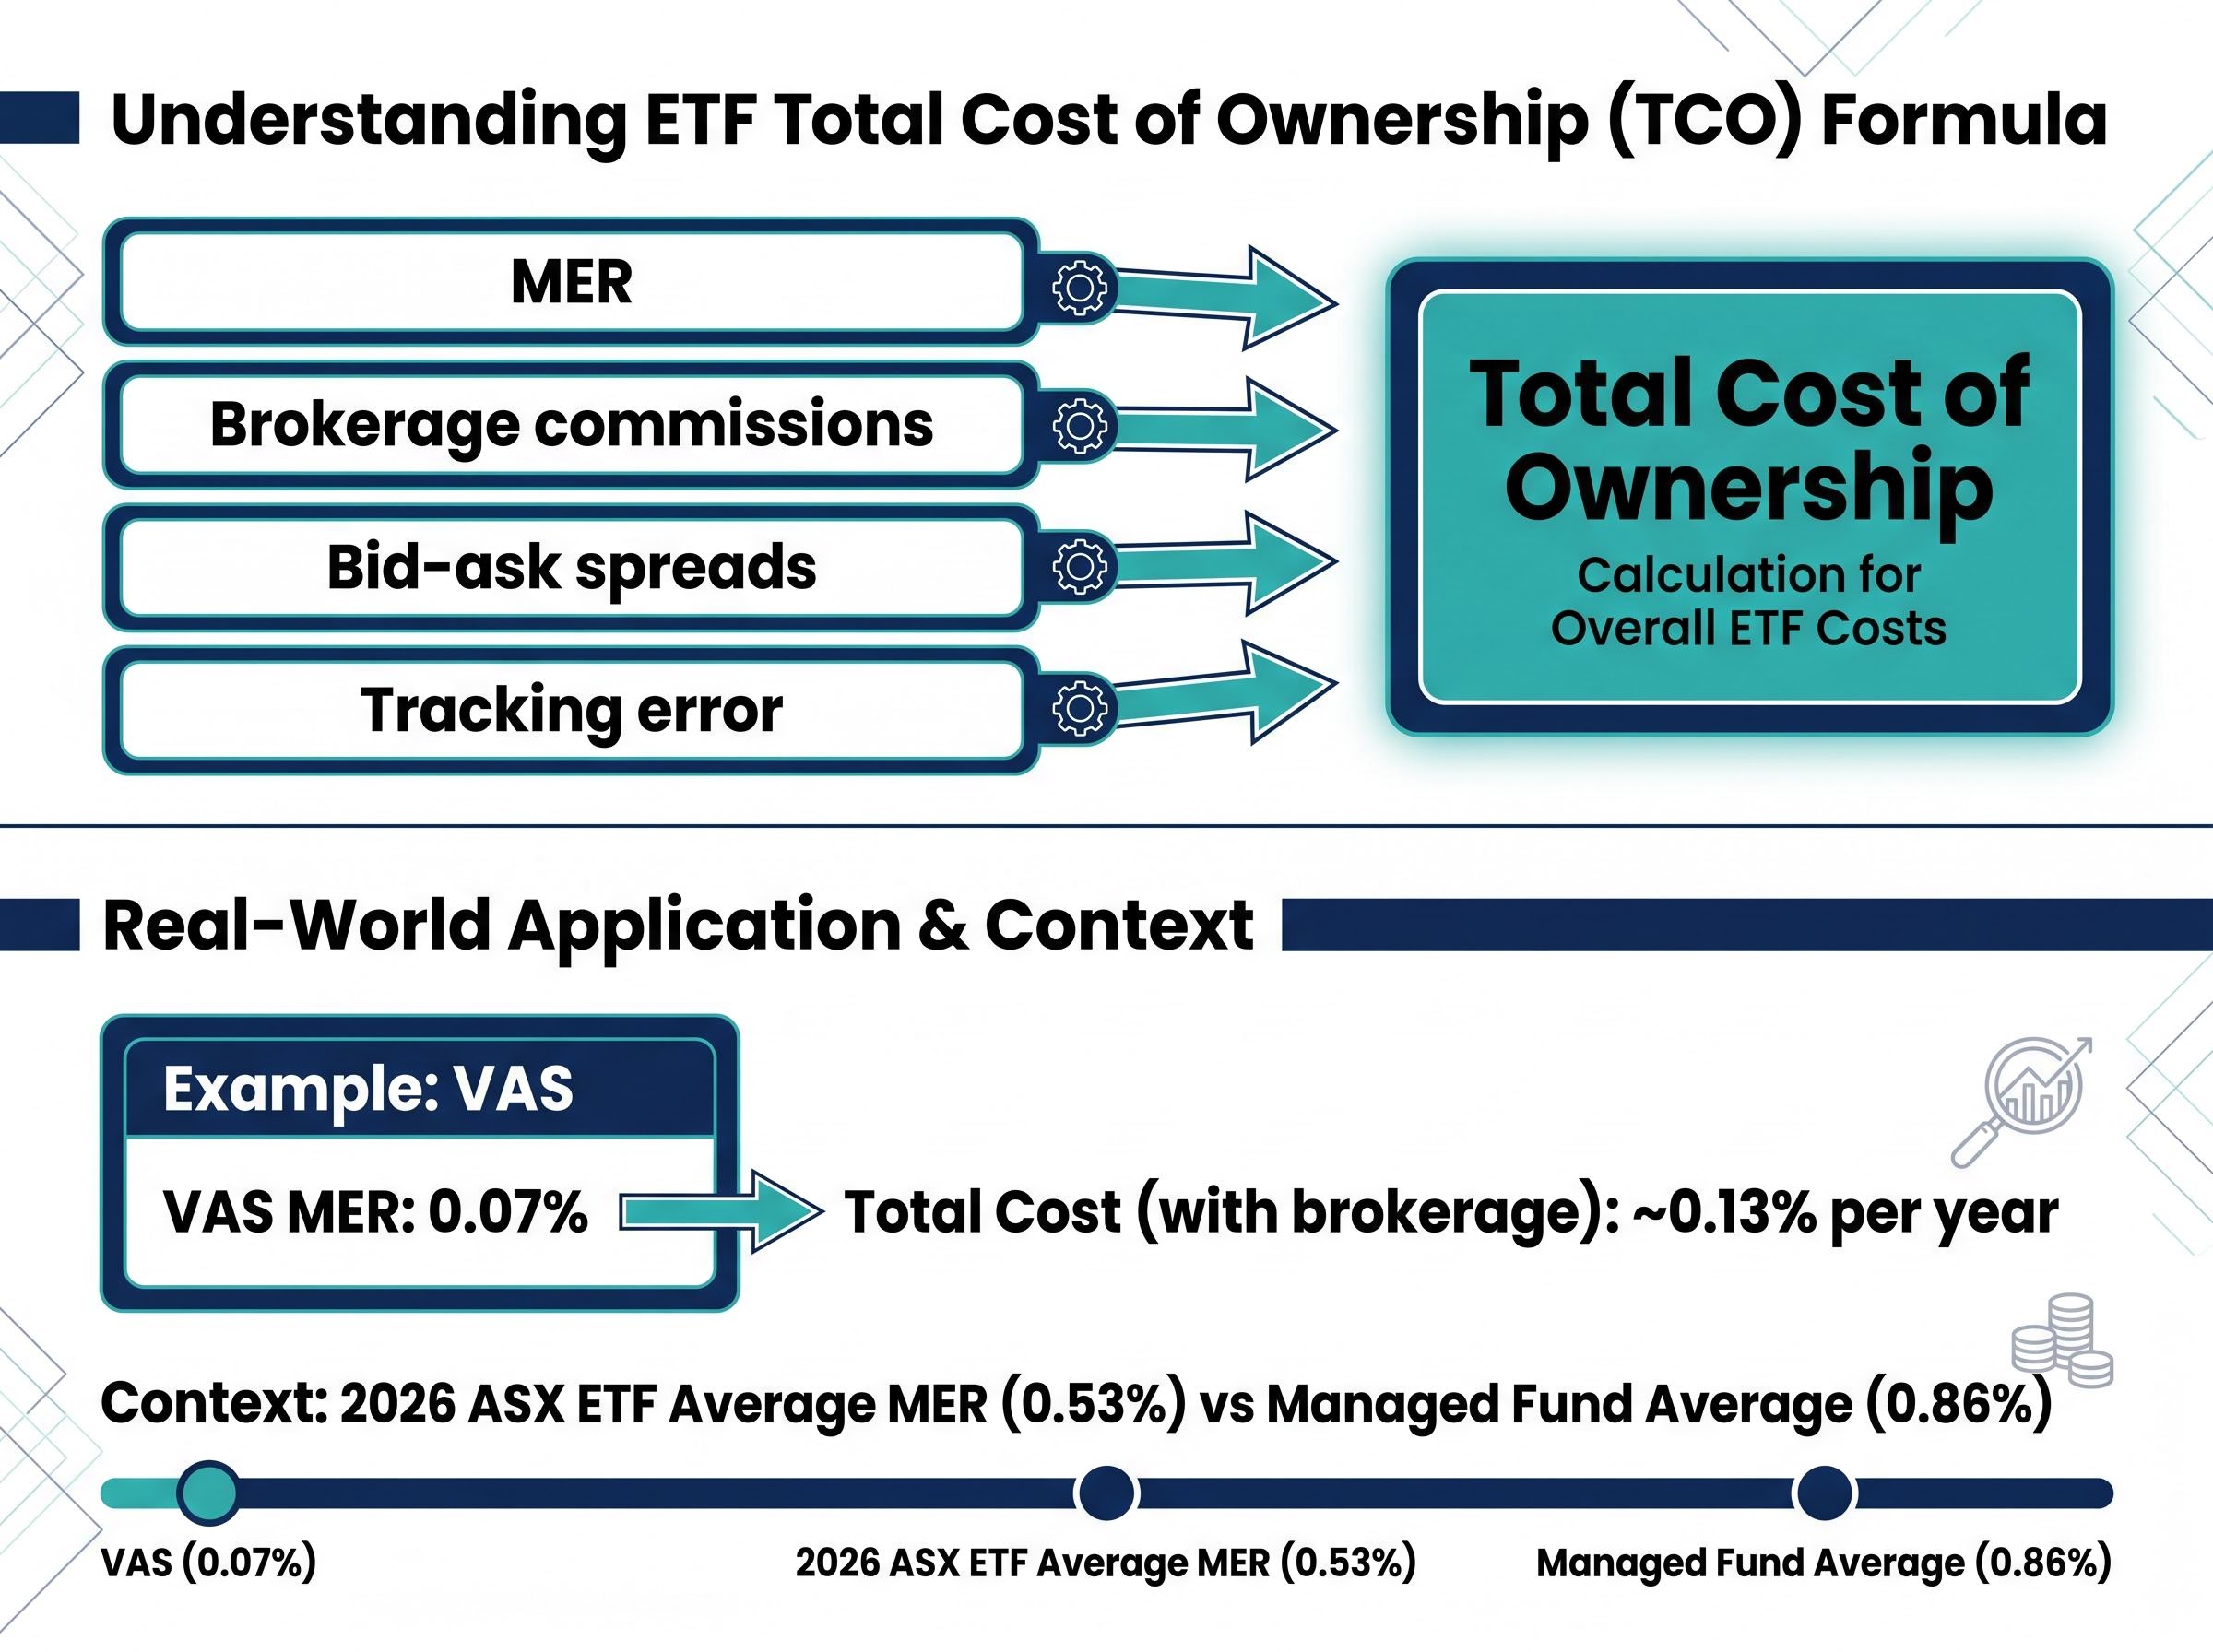
The MER itself is not the full picture. Total cost of ownership for any ETF includes several additional components:
According to Stake Academy analysis, a typical investor in VAS (MER 0.07%) faces total costs including brokerage of approximately 0.13% per year. The current ASX average MER across all listed ETFs is 0.53% per annum as of 2026, compared with 0.86% for Australian managed funds. Recognising total cost of ownership as distinct from MER alone is the first practical step toward accurate product comparison.
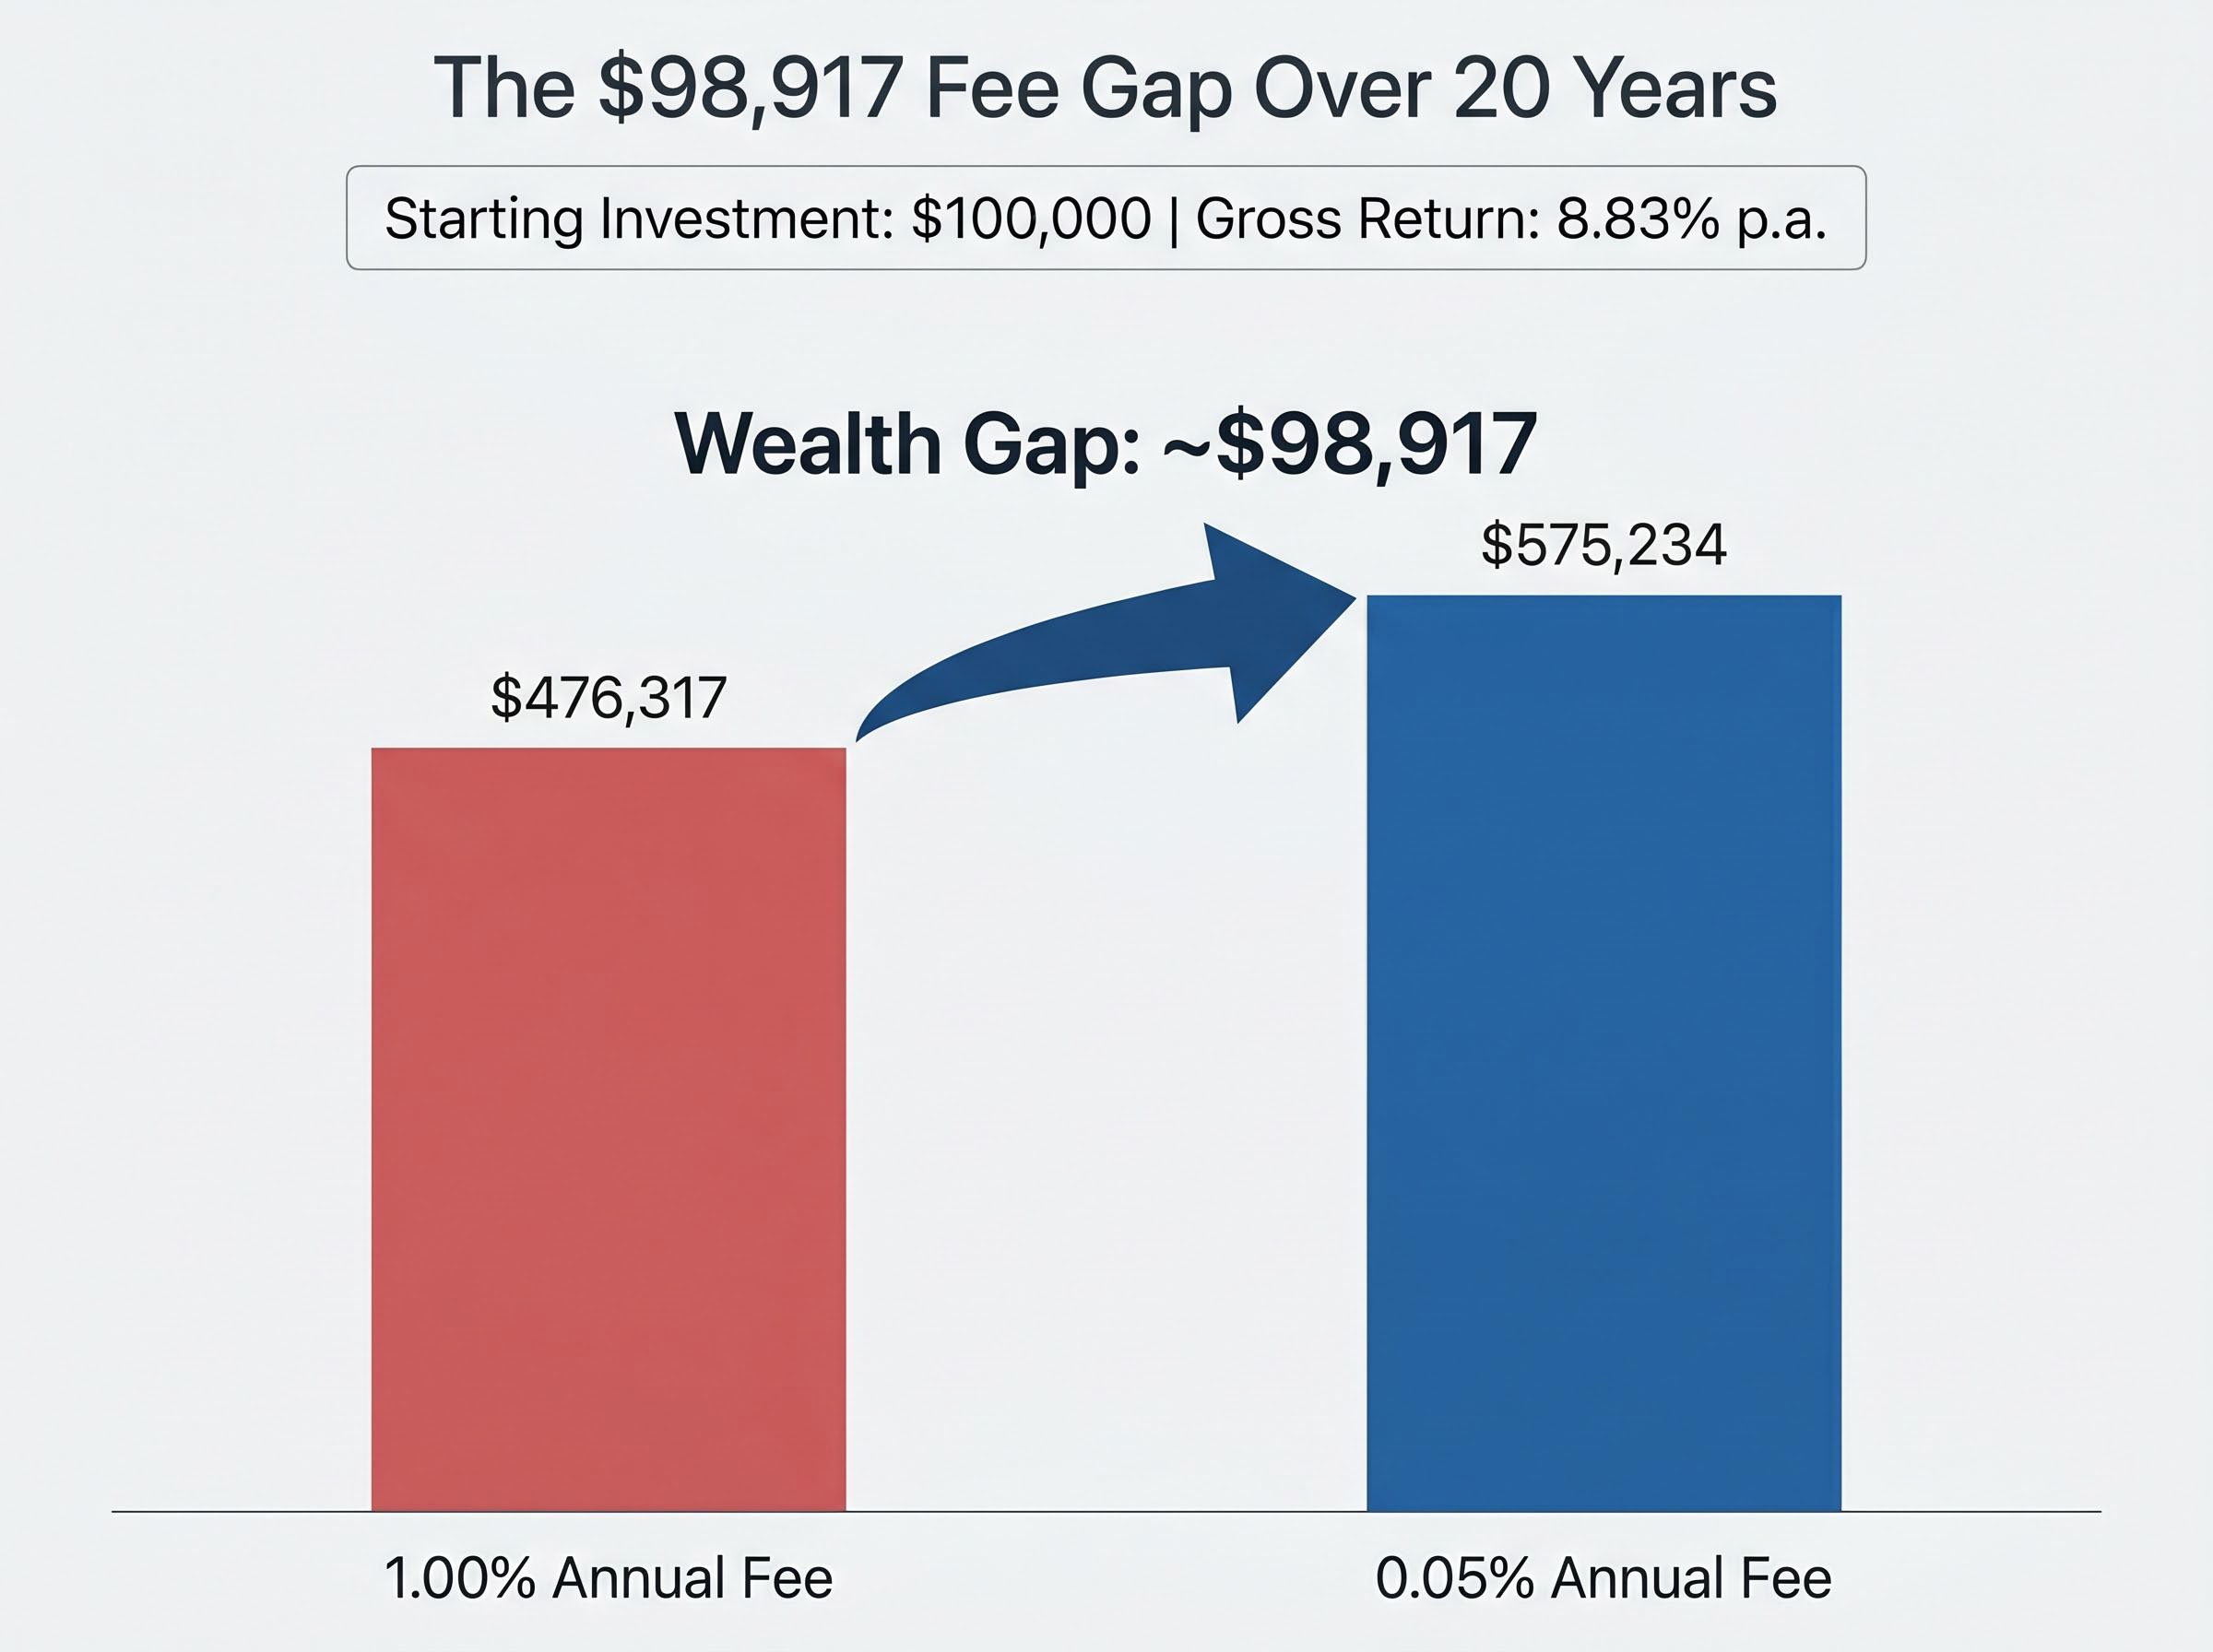
Consider two investors. Both start with $100,000. Both earn the same gross return of 8.83% per annum, the historical average for the ASX 200 used in Motley Fool Australia’s modelling. The only difference is the annual fee: one pays 0.05%, the other pays 1.00%.
After 20 years, the low-fee investor holds approximately $575,234. The high-fee investor holds approximately $476,317.
The gap: roughly $98,917. Gone. Not to a market crash, not to a bad stock pick, but to the quiet, compounding arithmetic of a fee difference smaller than one percentage point.
Hidden superannuation fees operate through the same compounding mechanics described above but are often more difficult to identify, because pooled trust capital gains tax drag, swap-based index financing spreads, and indirect cost ratios can all reduce a member’s retirement balance without appearing as a line item on any statement.
| MER (p.a.) | Portfolio value after 20 years | Wealth gap vs lowest-cost scenario |
|---|---|---|
| 0.05% | $575,234 | Baseline |
| 0.10% | Approx. $562,000 (Morningstar modelling) | ~$13,000 in total fees over the period |
| 1.00% | $476,317 | ~$98,917 |
Separate Morningstar-sourced modelling reinforces the pattern: a 1.00% annual fee product costs approximately $125,000 in total fees over a full investment horizon, while a 0.10% product costs approximately $13,000 over the same period.
“Unlike market performance, which is variable, fees are guaranteed to reduce your outcome every single year.”
The 0.9% fee difference referenced at the top of this article maps directly onto the Motley Fool Australia model. An investor who selects a 0.95% ETF over a 0.05% equivalent tracking the same index may be making a six-figure decision without realising it. The maths is not speculative. It is certain.
The modelled scenarios above are not hypothetical thought experiments detached from reality. Empirical research consistently arrives at the same conclusion.
Morningstar’s 2025 Australia “Mind the Gap” report, published on 17 September 2025, examined investor return gaps and ETF investor behaviour across the Australian market. The broader body of Morningstar research categorises ETFs by investment category and ranks them by cost quartile, consistently finding that lower-fee funds outperform higher-fee peers at significantly higher rates across most asset classes and time periods.
The mechanism behind this finding is straightforward. Future performance is uncertain. No analyst, algorithm, or fund manager can guarantee which product will outperform next year. Fees, however, are locked in from the moment an investor buys. Cost is one of the few genuinely predictable inputs into long-term outcomes.
Vanguard Australia notes that low fees starting at 0.03% correlate directly with better net returns over time. Finder.com.au explicitly recommends prioritising ETFs with MERs below 0.10% per annum for investors focused on long-term wealth building.
Across the major Australian financial education platforms, including Motley Fool Australia, Finder.com.au, Rask Education, and Stake Academy, there is a consistent view that fees should be treated as a primary ETF selection criterion. The reasoning is simple: performance history is backward-looking and unreliable as a forward predictor. The fund that topped its category over the past five years may not repeat that result over the next five.
Fees, by contrast, are forward-looking certainties. The investor who selects the lower-cost product among two functionally equivalent ETFs starts every year with a quantifiable advantage.
Abstract percentages gain meaning only when attached to specific products. The table below lists six widely held Australian ETFs covering domestic shares, international shares, and US market exposure, alongside the ASX average and managed fund average for context.
| ETF ticker | Fund description | MER (p.a.) | Comparison to ASX average |
|---|---|---|---|
| VAS | Vanguard Australian Shares Index | 0.07% | Well below average |
| IOZ | iShares Core S&P/ASX 200 | 0.05% | Well below average |
| VGS | Vanguard International Shares | 0.18% | Below average |
| BGBL | BetaShares Global Shares ETF | 0.08% | Well below average |
| VTS | Vanguard US Total Market Shares Index | 0.03% | Well below average |
| IVV | iShares S&P 500 | 0.04% | Well below average |
| ASX ETF average | 0.53% | Benchmark | |
| Australian managed fund average | 0.86% | Above ETF average | |
Several points stand out. Multiple ETFs offer broad international exposure, yet VGS at 0.18% charges more than double what BGBL charges at 0.08%. Both are diversified global products, but the fee gap between them would compound meaningfully over a multi-decade holding period. The lowest-cost options on this list, VTS at 0.03% and IVV at 0.04%, are also among the most diversified and widely held, which challenges any assumption that lower cost implies lower quality.
Liquidity and index breadth also separate otherwise fee-equivalent products in ways the MER alone does not capture; VAS and A200, for example, carry a fee gap of just 0.03 percentage points per annum on a comparable mandate, yet differ meaningfully in daily trading volume, bid-ask spread, and the number of underlying holdings, all of which affect actual investor outcomes.
MERs should always be verified against the current Product Disclosure Statement (PDS) before investing, as fees can and do change over time.
Knowing that fees matter is only half the equation. Knowing where to find accurate, current fee data completes it.
Three primary official sources provide ETF fee information in Australia:
ASIC Regulatory Guide 97 establishes the legal framework governing how fees and costs must be disclosed in Product Disclosure Statements for Australian managed investment products, including ETFs, making the PDS the binding reference document investors should consult before committing capital.
Many investors rely on third-party comparison sites that may display outdated or approximate figures. Starting with the PDS ensures fee data is current and legally accurate.
Tracking error measures the degree to which an ETF’s actual returns diverge from its benchmark index. A nominally cheaper ETF can be costlier in practice if its tracking error is high, because the investor receives less of the index return than expected.
Bid-ask spreads on the ASX represent a transaction cost paid each time units are bought or sold. These are particularly relevant for investors who trade frequently or in smaller parcel sizes. Rask Education’s ETF Fee Calculator models compounding fee drag interactively, making it accessible for investors without financial modelling experience.
Most investment decisions involve uncertainty. Which sector will outperform? Will the market rise or fall next quarter? Should an investor hold or rebalance? The answers depend on variables no one controls.
Fee selection is different. Choosing a lower-cost ETF over a functionally identical higher-cost peer produces a mathematically certain improvement in long-term net returns. It requires no additional market risk, no timing skill, and no forecasting ability. The 0.9% fee difference examined in this article compounds to approximately $98,917 over 20 years on a $100,000 investment at 8.83% gross returns. That figure is not a projection; it is arithmetic.
This does not mean MER should override every other consideration. Differences in fund mandate, liquidity, or provider reliability matter. A marginally cheaper product that tracks a fundamentally different index is not a like-for-like comparison.
Concentration risk in single-stock portfolios adds a volatility dimension that fee comparisons between ETFs do not capture; real 2025 examples showed single-stock declines of up to 68.9% eliminating most of a concentrated investor’s capital, while an equivalent decline in a 1% ETF position produced only a 0.69% portfolio drag, illustrating why the cost advantage of broad index products compounds alongside a structural risk benefit.
Fee compression is ongoing. Broad-market index ETFs are available from as low as 0.03% per annum in 2026, meaning the lowest-cost tier is increasingly accessible to investors of all sizes. For those holding existing positions, a review of current MERs may reveal fee creep as providers revise pricing.
“Future returns are uncertain. Fees are not. That asymmetry is worth taking seriously.”
This article is for informational purposes only and should not be considered financial advice. Investors should conduct their own research and consult with financial professionals before making investment decisions.
An ETF management expense ratio (MER) is an annual percentage of the fund's total assets that covers management, administration, and operational costs. It is deducted daily from the fund's net asset value, so it reduces the ETF's unit price incrementally rather than appearing as a separate charge on your brokerage statement.
On a $100,000 investment earning 8.83% gross returns per year, choosing an ETF with a 1.00% MER instead of a 0.05% MER results in approximately $98,917 less wealth after 20 years, with the difference caused entirely by the compounding effect of the annual fee gap.
The most reliable source is the Product Disclosure Statement (PDS), which is the legally binding fee disclosure document available on the provider's website or the ASX ETF listing page. You can also check fund product pages from providers such as Vanguard Australia, BetaShares, BlackRock Australia, and Global X for current MER figures.
The current ASX average MER across all listed ETFs is 0.53% per annum as of 2026, compared with 0.86% for Australian managed funds, though many popular broad-market index ETFs charge significantly less, with some as low as 0.03% per annum.
No, the total cost of ownership also includes brokerage commissions paid when buying or selling units, bid-ask spreads on the ASX, and tracking error, which measures how closely the ETF follows its benchmark index. A low MER does not guarantee the lowest total cost if tracking error or spreads are high.