
June US Inflation Report Hits as Fed Sits 9-9 on Rate Hikes
3 hrs ago

Cochlear Ltd (ASX: COH) has lost 61.66% of its value in 2026 alone. On 22 April, the stock fell approximately 40% in a single session, wiping more than $4 billion from its market capitalisation. Yet the company behind the collapse still reports a 74.9% gross margin, a 14.3% three-year revenue compound annual growth rate (CAGR), and a return on equity of 19.9%. The gap between the severity of the selloff and the durability of those financial metrics is where the real analytical question lives. What follows is a framework for evaluating what caused the crash, what the underlying numbers reveal, how the structural growth thesis holds up, and where analysts disagree on the path forward.
Cochlear released an ASX trading update on 22 April 2026 that cut its full-year profit guidance by roughly 30% at the midpoint.
The ASX continuous disclosure obligations under Listing Rules 3.1 and 3.1A require listed companies to immediately disclose any information that a reasonable person would expect to have a material effect on price, which is the regulatory framework that compelled Cochlear to release its 22 April trading update rather than wait for its scheduled results period.
Prior FY26 guidance: $435-460 million underlying net profit. Revised guidance: $290-330 million.
The stock entered the session at approximately $168. By close, it sat at $101.76. The intraday low touched $97.88. Market capitalisation fell from approximately $11 billion to approximately $6.7 billion in a single trading day.
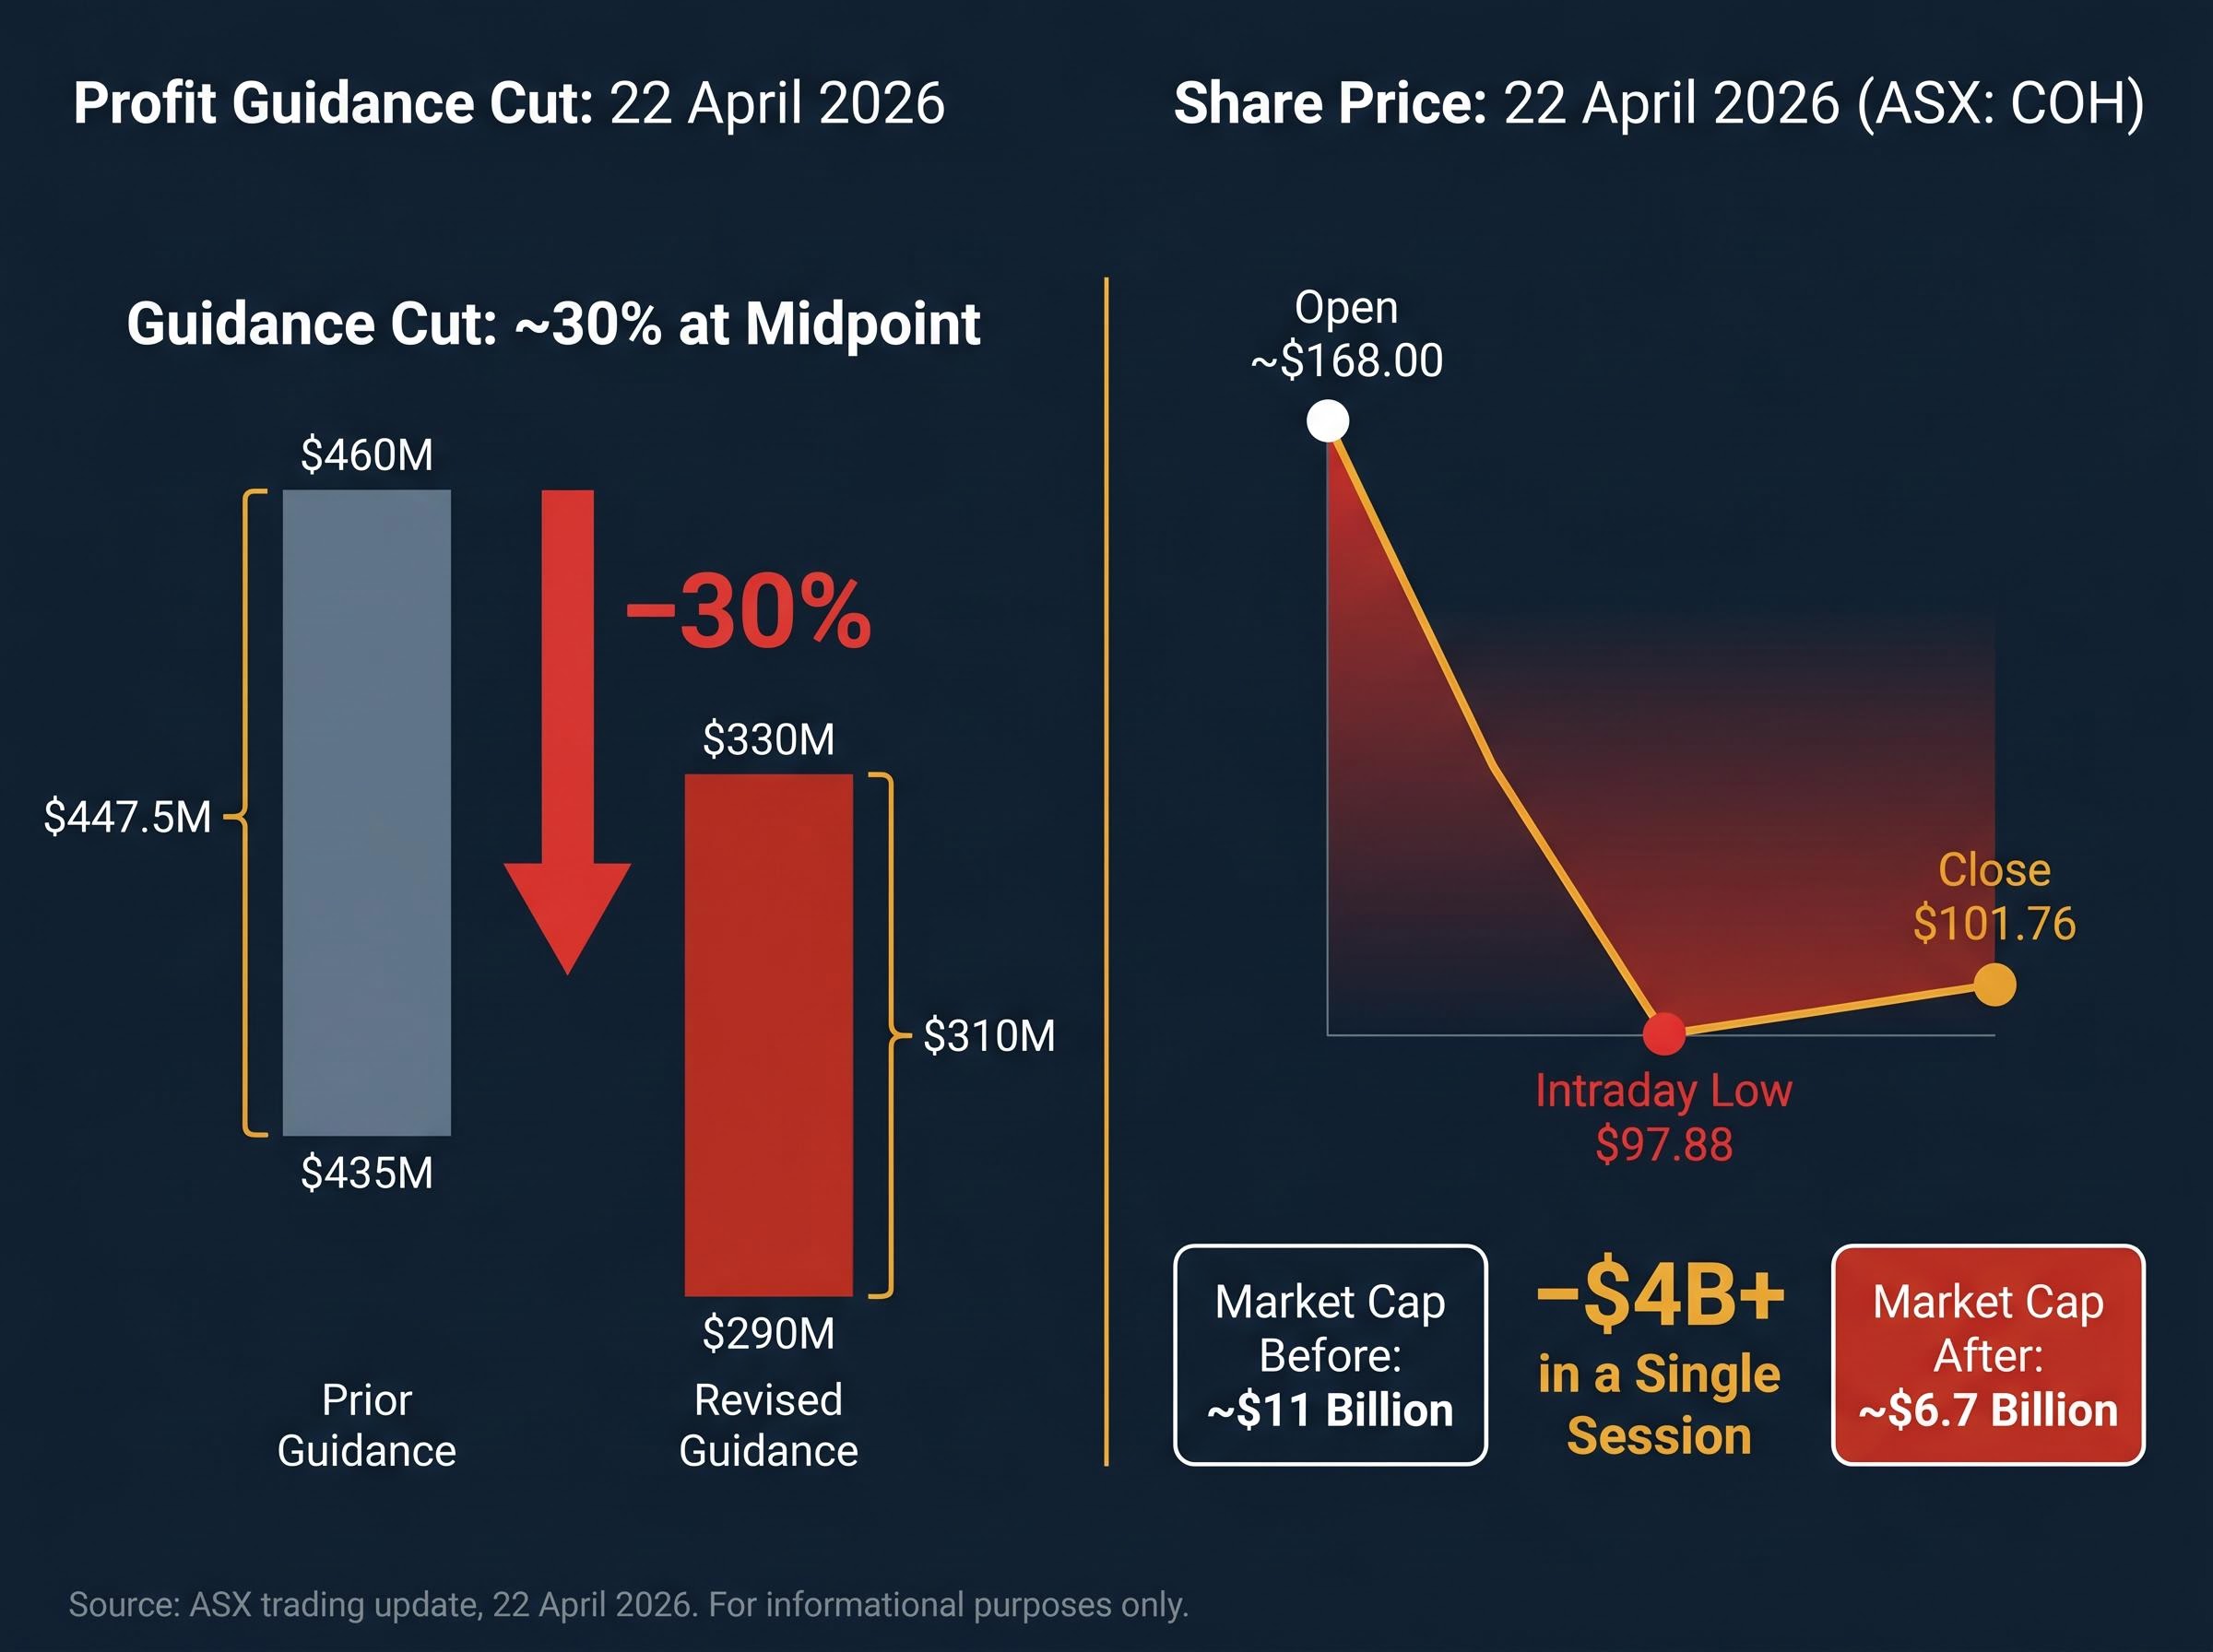
The scale of the move matters. A 39-40% single-session decline is not a routine guidance miss. It repriced the company as though the earnings shock were permanent.
Management attributed the downgrade to two factors: deferred cochlear implant procedures in developed markets and operational disruptions tied to ongoing conflict in the Middle East. Both were characterised as cyclical and timing-related, not structural.
The scale of the April selloff exceeded the earnings cut itself because of factors operating below the headline guidance number; four simultaneous geographic headwinds, including cyclical US volume declines, European hospital capacity constraints, Middle East cancellations, and Chinese reimbursement policy changes, converged in the same reporting period, producing a compounding effect that pure guidance arithmetic does not capture.
Equally important is what was not cited:
The half-year results leading into the downgrade had already signalled softening. HY26 underlying net profit came in at $195 million, down 9% year-on-year, with a net margin of 17%. The April announcement confirmed the deterioration was accelerating into the second half.
Cochlear’s most recently reported annual revenue stood at $2,236 million, underpinned by a three-year revenue CAGR of 14.3%. That growth rate places the company among the faster-growing large-cap medical device names on the ASX.
Gross margin tells a complementary story. Source theme data places it at 74.9%; a live data cross-check as of May 2026 returns 72.76%. Both figures confirm that Cochlear retains exceptionally strong pricing power and a cost structure tilted heavily toward proprietary technology rather than commodity inputs.
Net profit CAGR over the same three-year period, however, trails at 3.3%. That divergence between top-line growth and bottom-line growth signals margin compression at the operating level, a pattern the FY26 downgrade has now amplified.
The balance sheet carries modest leverage. Debt-to-equity sits at 13.2%. The net cash/debt position is less straightforward: source theme data suggests approximately $270 million in net cash, while a live data cross-check indicates a net debt position of approximately $55.1 million ($187.1 million cash versus $242.2 million debt). The more conservative figure, a modest net debt position, still represents a balance sheet with significant capacity to absorb a temporary revenue shortening without distress.
Return on equity of 19.9% (FY24 figure) and a price-to-book ratio of 3.31x round out the capital efficiency picture.
Return on equity interpretation requires an important qualification: a high ROE figure can be inflated by leverage rather than reflecting genuine capital efficiency, which is why cross-checking COH’s 19.9% ROE against its 13.2% debt-to-equity ratio matters for forming a clean view of the underlying business quality.
| Metric | Figure | What it signals |
|---|---|---|
| Revenue CAGR (3-year) | 14.3% | Sustained top-line momentum across multiple periods |
| Gross margin | 74.9% (source themes) / 72.76% (live data) | Strong pricing power; low commodity input exposure |
| Net profit CAGR (3-year) | 3.3% | Operating cost growth has compressed net margins |
| Return on equity | 19.9% | High capital efficiency relative to equity base |
| Debt-to-equity | 13.2% | Low leverage; balance sheet can absorb temporary softening |
These metrics describe a company whose asset quality and capital efficiency have not collapsed alongside its share price. They do not, however, guarantee recovery. They set the floor for evaluating whether the market’s repricing overshot.
The earnings miss sits against a long-duration demand story that did not change on 22 April.
Cochlear has distributed more than 750,000 implantable devices across more than 50 countries, supported by a workforce exceeding 5,000. The company is consistently described as the global leader in cochlear implants, with industry commentary placing its market share at approximately 50%, though that figure has not been independently verified through live data.
The structural demand drivers remain intact:
“The majority of eligible patients globally remain unimplanted.”
What “cyclical demand deferral” means in this specific context is patients postponing elective surgery, not patients choosing a rival device or deciding they no longer need treatment. The addressable market did not shrink. The timing of patient access to it shifted.
For Australian investors weighing whether COH is a value trap or a recovery opportunity, the depth of that untapped patient pool is the counterweight to the near-term earnings headwind. It does not guarantee a recovery, but it does establish that the demand runway extends well beyond the current disruption.
Gross margin measures the percentage of revenue remaining after subtracting the direct costs of producing a product. It sits above all overhead, research, and commercial expenses on the income statement. A gross margin above 70% in a medical device company signals three things worth understanding in sequence:
Operating leverage is the mechanism. Cochlear maintains a large fixed cost base: global sales and distribution infrastructure, significant research and development investment, and manufacturing overhead that does not scale down proportionally when revenue growth slows.
When procedure volumes decline, gross margin can remain stable while the net result compresses sharply. The HY26 net profit margin of 17% alongside a gross margin above 72% illustrates the gap. The distance between those two figures, roughly 55 percentage points, reflects the operating cost structure that absorbs revenue growth in strong years and magnifies weakness in soft ones.
Understanding this distinction matters. A gross margin above 70% is one of the most durable indicators of competitive advantage in medical devices. Its persistence through the current downturn suggests the business model has not deteriorated, even as the earnings result has.
The post-crash analyst landscape is not confused. It is split along a single fault line: when and whether procedure volumes normalise.
| Broker | Rating | Price Target | Key Assumption |
|---|---|---|---|
| Jarden | Buy / Outperform | $169 | Demand normalises within 12-18 months; structural growth intact |
| Macquarie | Cautious | $115 (reduced from $239) | Recovery timing uncertain; execution risk elevated |
| Morgans | Hold | $107.17 | Near-term headwinds unresolved; limited upside at current levels |
Broader consensus price targets appear to cluster in the $126-143 range based on aggregator data from Marketscreener, though not every constituent broker has been independently confirmed for May 2026.
Short interest in COH has tracked between 4% and 5.7% since the crash, signalling that professional scepticism about the recovery timeline is not confined to cautious analyst ratings but is backed by active short positioning from institutional participants.
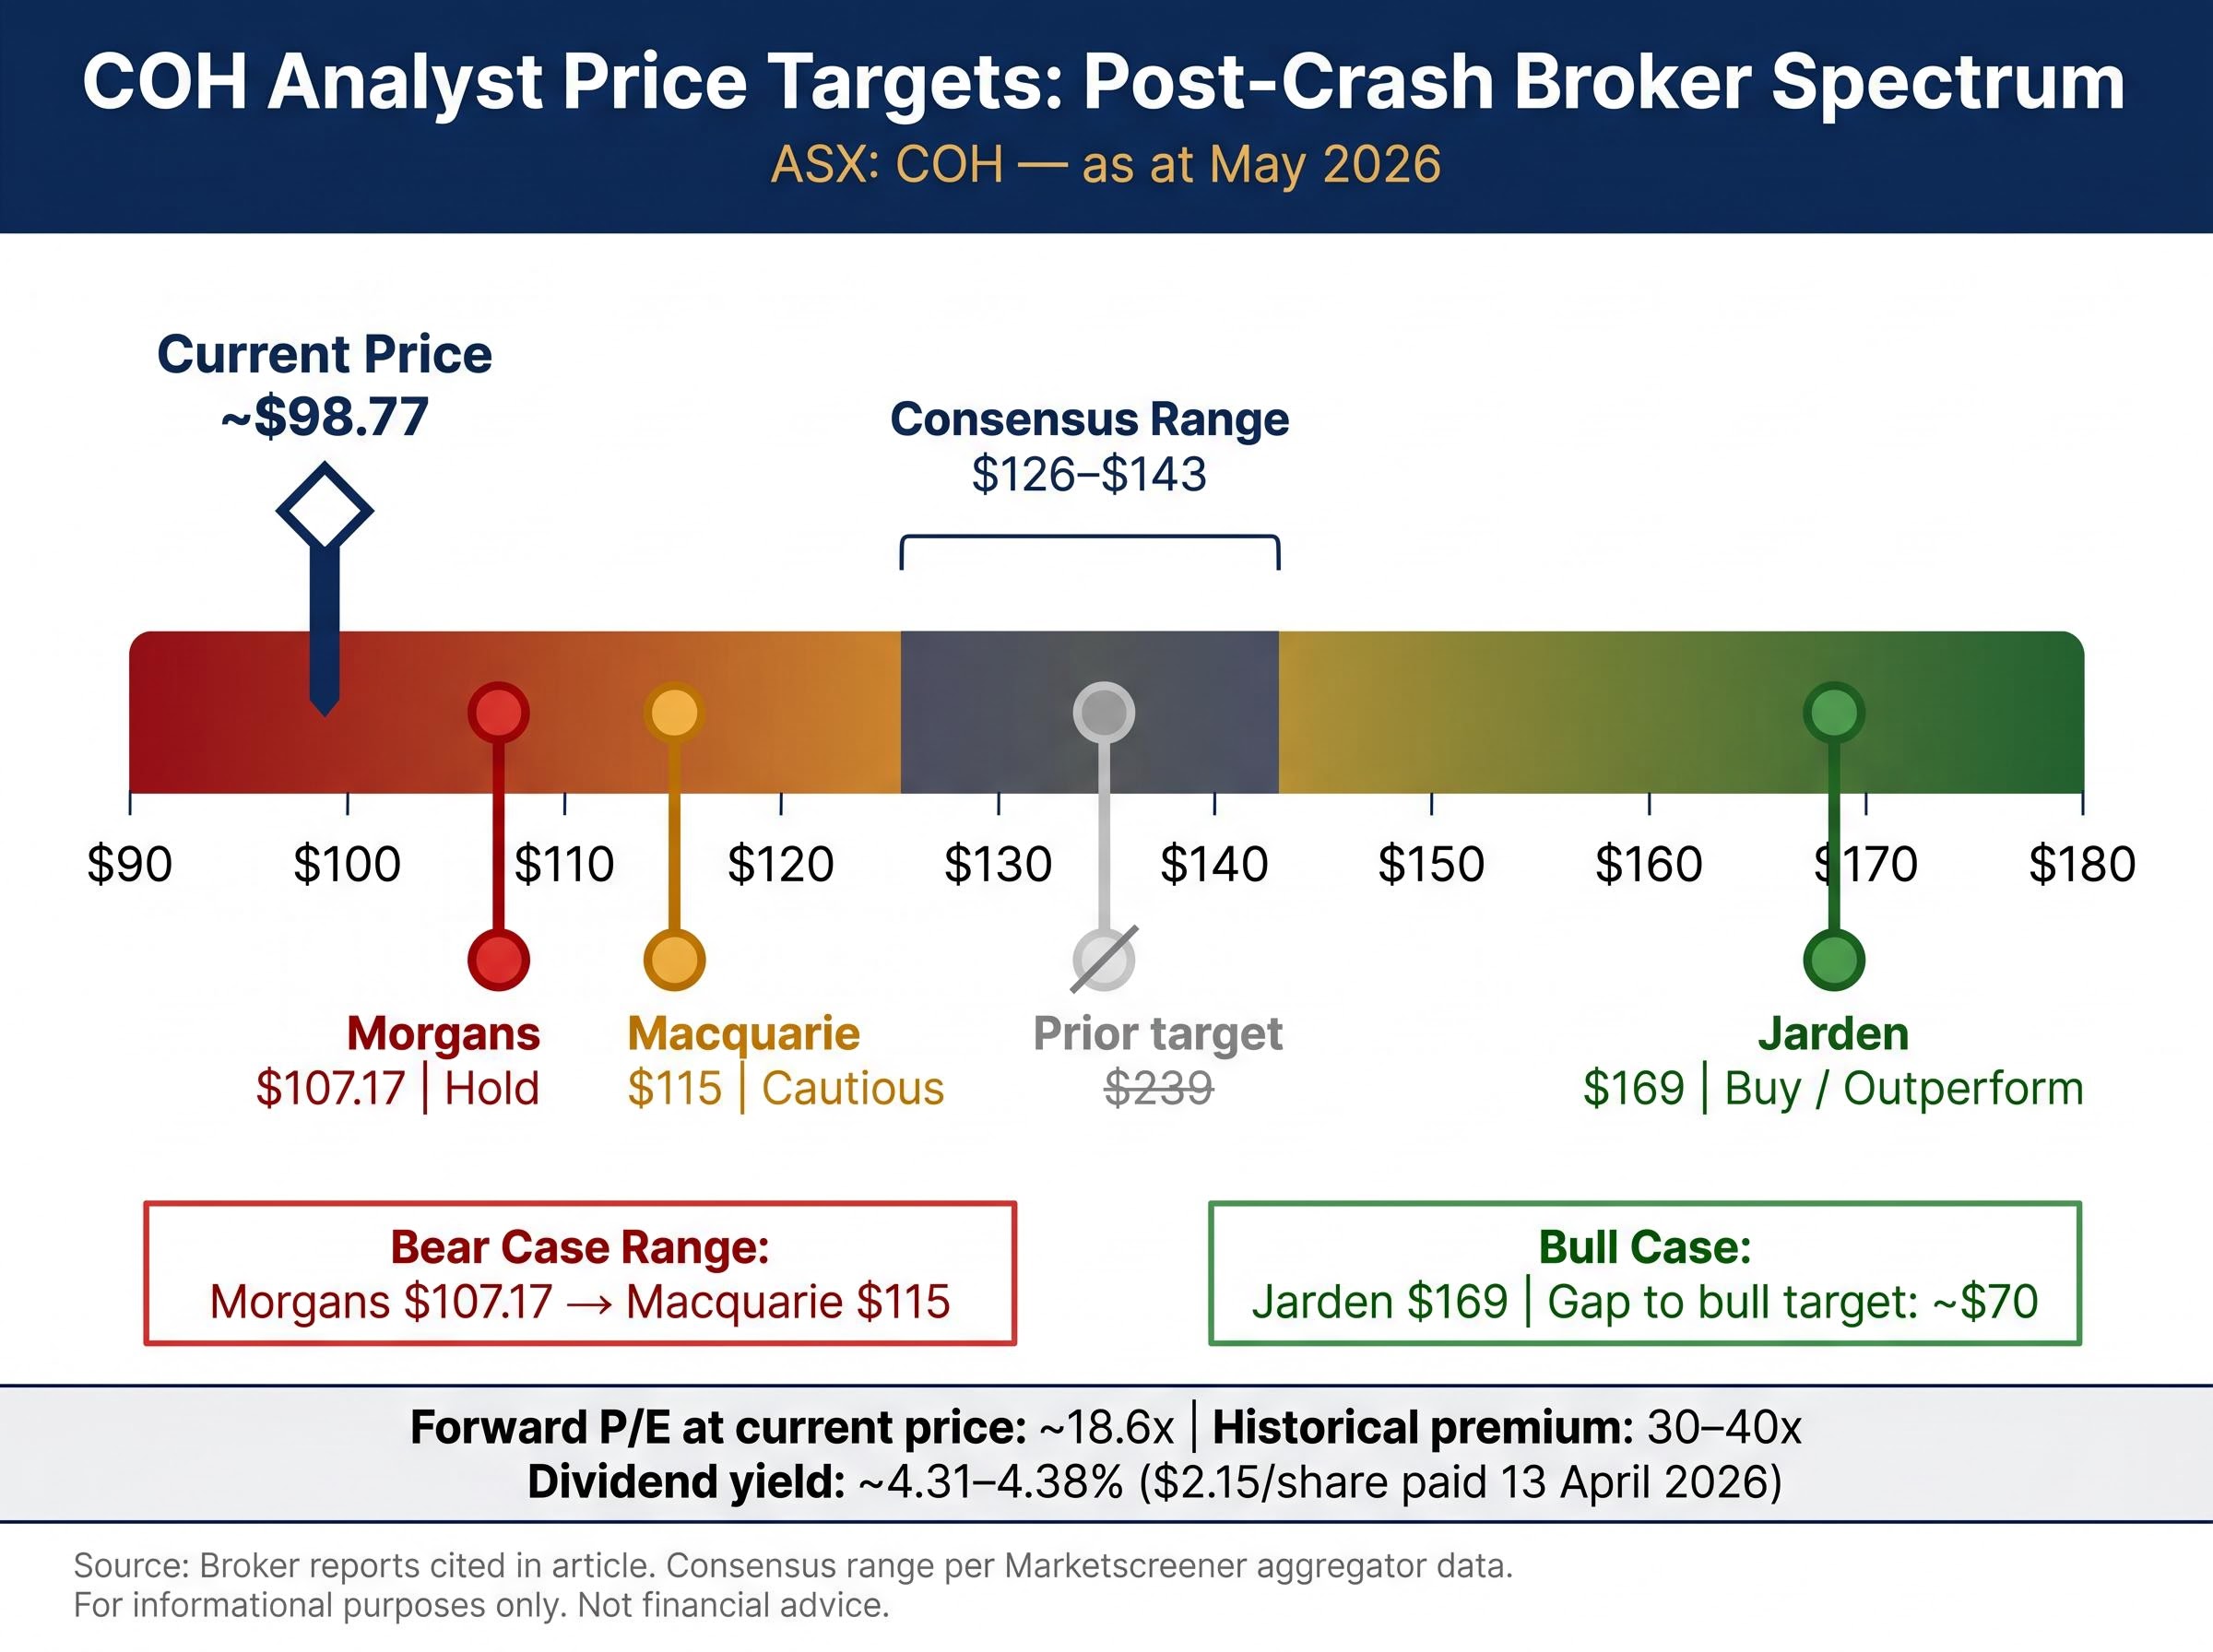
COH now trades at approximately 18.6x forward earnings, versus its historical premium of 30-40x.
That valuation compression is itself a key input. Jarden’s $169 target implies the market will eventually restore a premium multiple as earnings normalise. Morgans’ $107.17 implies the compressed multiple is closer to where the stock belongs until proof of recovery materialises. The gap between those two positions, approximately $62 per share, is not noise. It is a direct measure of how much the demand recovery timeline is worth.
The current dividend yield of approximately 4.31-4.38%, based on the latest dividend of $2.15 per share paid 13 April 2026, provides a partial income floor but does not resolve the capital return question.
The instinct to buy a 61% drawdown is powerful. Whether it is correct depends entirely on what has to be true for a recovery to materialise.
A $10,000 investment at the July 2025 peak (approximately $319.56) is worth approximately $3,100 at current prices near $98.77. The current market capitalisation of approximately $6.57 billion is down from approximately $11 billion before the crash.
The distinction between the bull and bear cases is not a disagreement about business quality. It is a disagreement about time. A structurally sound company can still be a poor investment if the recovery takes longer than the market assumes or never arrives in the expected form.
For investors wanting to stress-test the multiple compression argument beyond what a single forward P/E figure captures, our full explainer on forward P/E limitations walks through the PEG ratio, EV/EBITDA, and P/FCF as complementary tools that correct for the specific blind spots P/E creates when earnings are temporarily depressed.
The analytical thread runs through a single question. Cochlear’s crash was caused by a confirmed, severe profit downgrade, not a regulatory failure, competitive loss, or management crisis. The underlying financial metrics, including gross margins above 72%, low leverage, and strong returns on equity, describe a high-quality medical device business. The structural demand story, anchored in aging populations and a vast unimplanted patient pool, has not been invalidated.
What remains unresolved is timing. Management characterised the weakness as cyclical. The recovery thesis is credible but unproven, and it depends almost entirely on whether procedure volumes normalise within the window the market is pricing.
Due diligence from here means watching procedure volume data in upcoming ASX updates, monitoring management commentary on Middle East operations, and tracking whether the “cyclical” characterisation holds through full-year FY26 results.
This article is for informational purposes only and should not be considered financial advice. Investors should conduct their own research and consult with financial professionals before making investment decisions. Past performance does not guarantee future results. Financial projections are subject to market conditions and various risk factors.
Cochlear released an ASX trading update on 22 April 2026 cutting its full-year underlying net profit guidance by approximately 30% at the midpoint, from $435-460 million down to $290-330 million. Management attributed the downgrade to deferred cochlear implant procedures in developed markets and operational disruptions from ongoing conflict in the Middle East.
A cochlear implant is a surgically implanted electronic device that provides a sense of sound to people with severe hearing loss, and Cochlear Ltd is the global market leader with an estimated 50% market share, having distributed more than 750,000 implantable devices across more than 50 countries. Its competitive position is reinforced by decades of intellectual property, clinical validation, and proprietary technology that competitors cannot easily replicate at lower cost.
Analyst opinions are sharply divided: Jarden holds a Buy rating with a $169 price target on the basis that demand normalises within 12-18 months, Macquarie is cautious with a reduced target of $115, and Morgans rates it Hold with a target of $107.17. Broader consensus price targets appear to cluster in the $126-143 range according to aggregator data.
Cochlear's gross margin held because the profit decline originated below the gross line, in the company's large fixed operating cost base covering global sales infrastructure, research and development, and manufacturing overhead that does not scale down proportionally when procedure volumes decline. This operating leverage effect means a slowdown in revenue growth compresses net profit far more severely than it affects gross margin.
Investors should track procedure volume data disclosed in upcoming ASX updates, management commentary on Middle East operational normalisation, and whether full-year FY26 results confirm the 'cyclical' characterisation of the downturn. Key valuation reference points include COH's forward P/E of approximately 18.6x against a historical premium of 30-40x, and whether earnings progress toward the revised guidance midpoint of approximately $310 million.