How Comcast’s Split Ends a Decade of Conglomerate Discount
1 min ago
One fund returned 32%. Another returned 5% on price alone. Both sit in the same ETF category on the ASX, and both are held by hundreds of thousands of Australian investors as core portfolio positions. The gap between them is not a glitch. It is a direct consequence of where global growth is concentrated in 2026, and where it is not.
With combined assets under management now exceeding $80 billion, VAS, VGS, and IVV are no longer niche instruments for self-directed traders. They are the default portfolio infrastructure for a generation of Australian retail investors. In the current environment, characterised by a tightening Reserve Bank of Australia (RBA), sustained US equity momentum, and an ASX that continues to trail international peers, understanding what each fund actually owns and what risks it carries has rarely been more pressing.
This analysis examines the 12-month performance of each fund to May 2026, explains the structural factors behind those results, identifies the risks embedded in each position, and provides a framework for how the three funds function as complementary building blocks in a diversified portfolio.
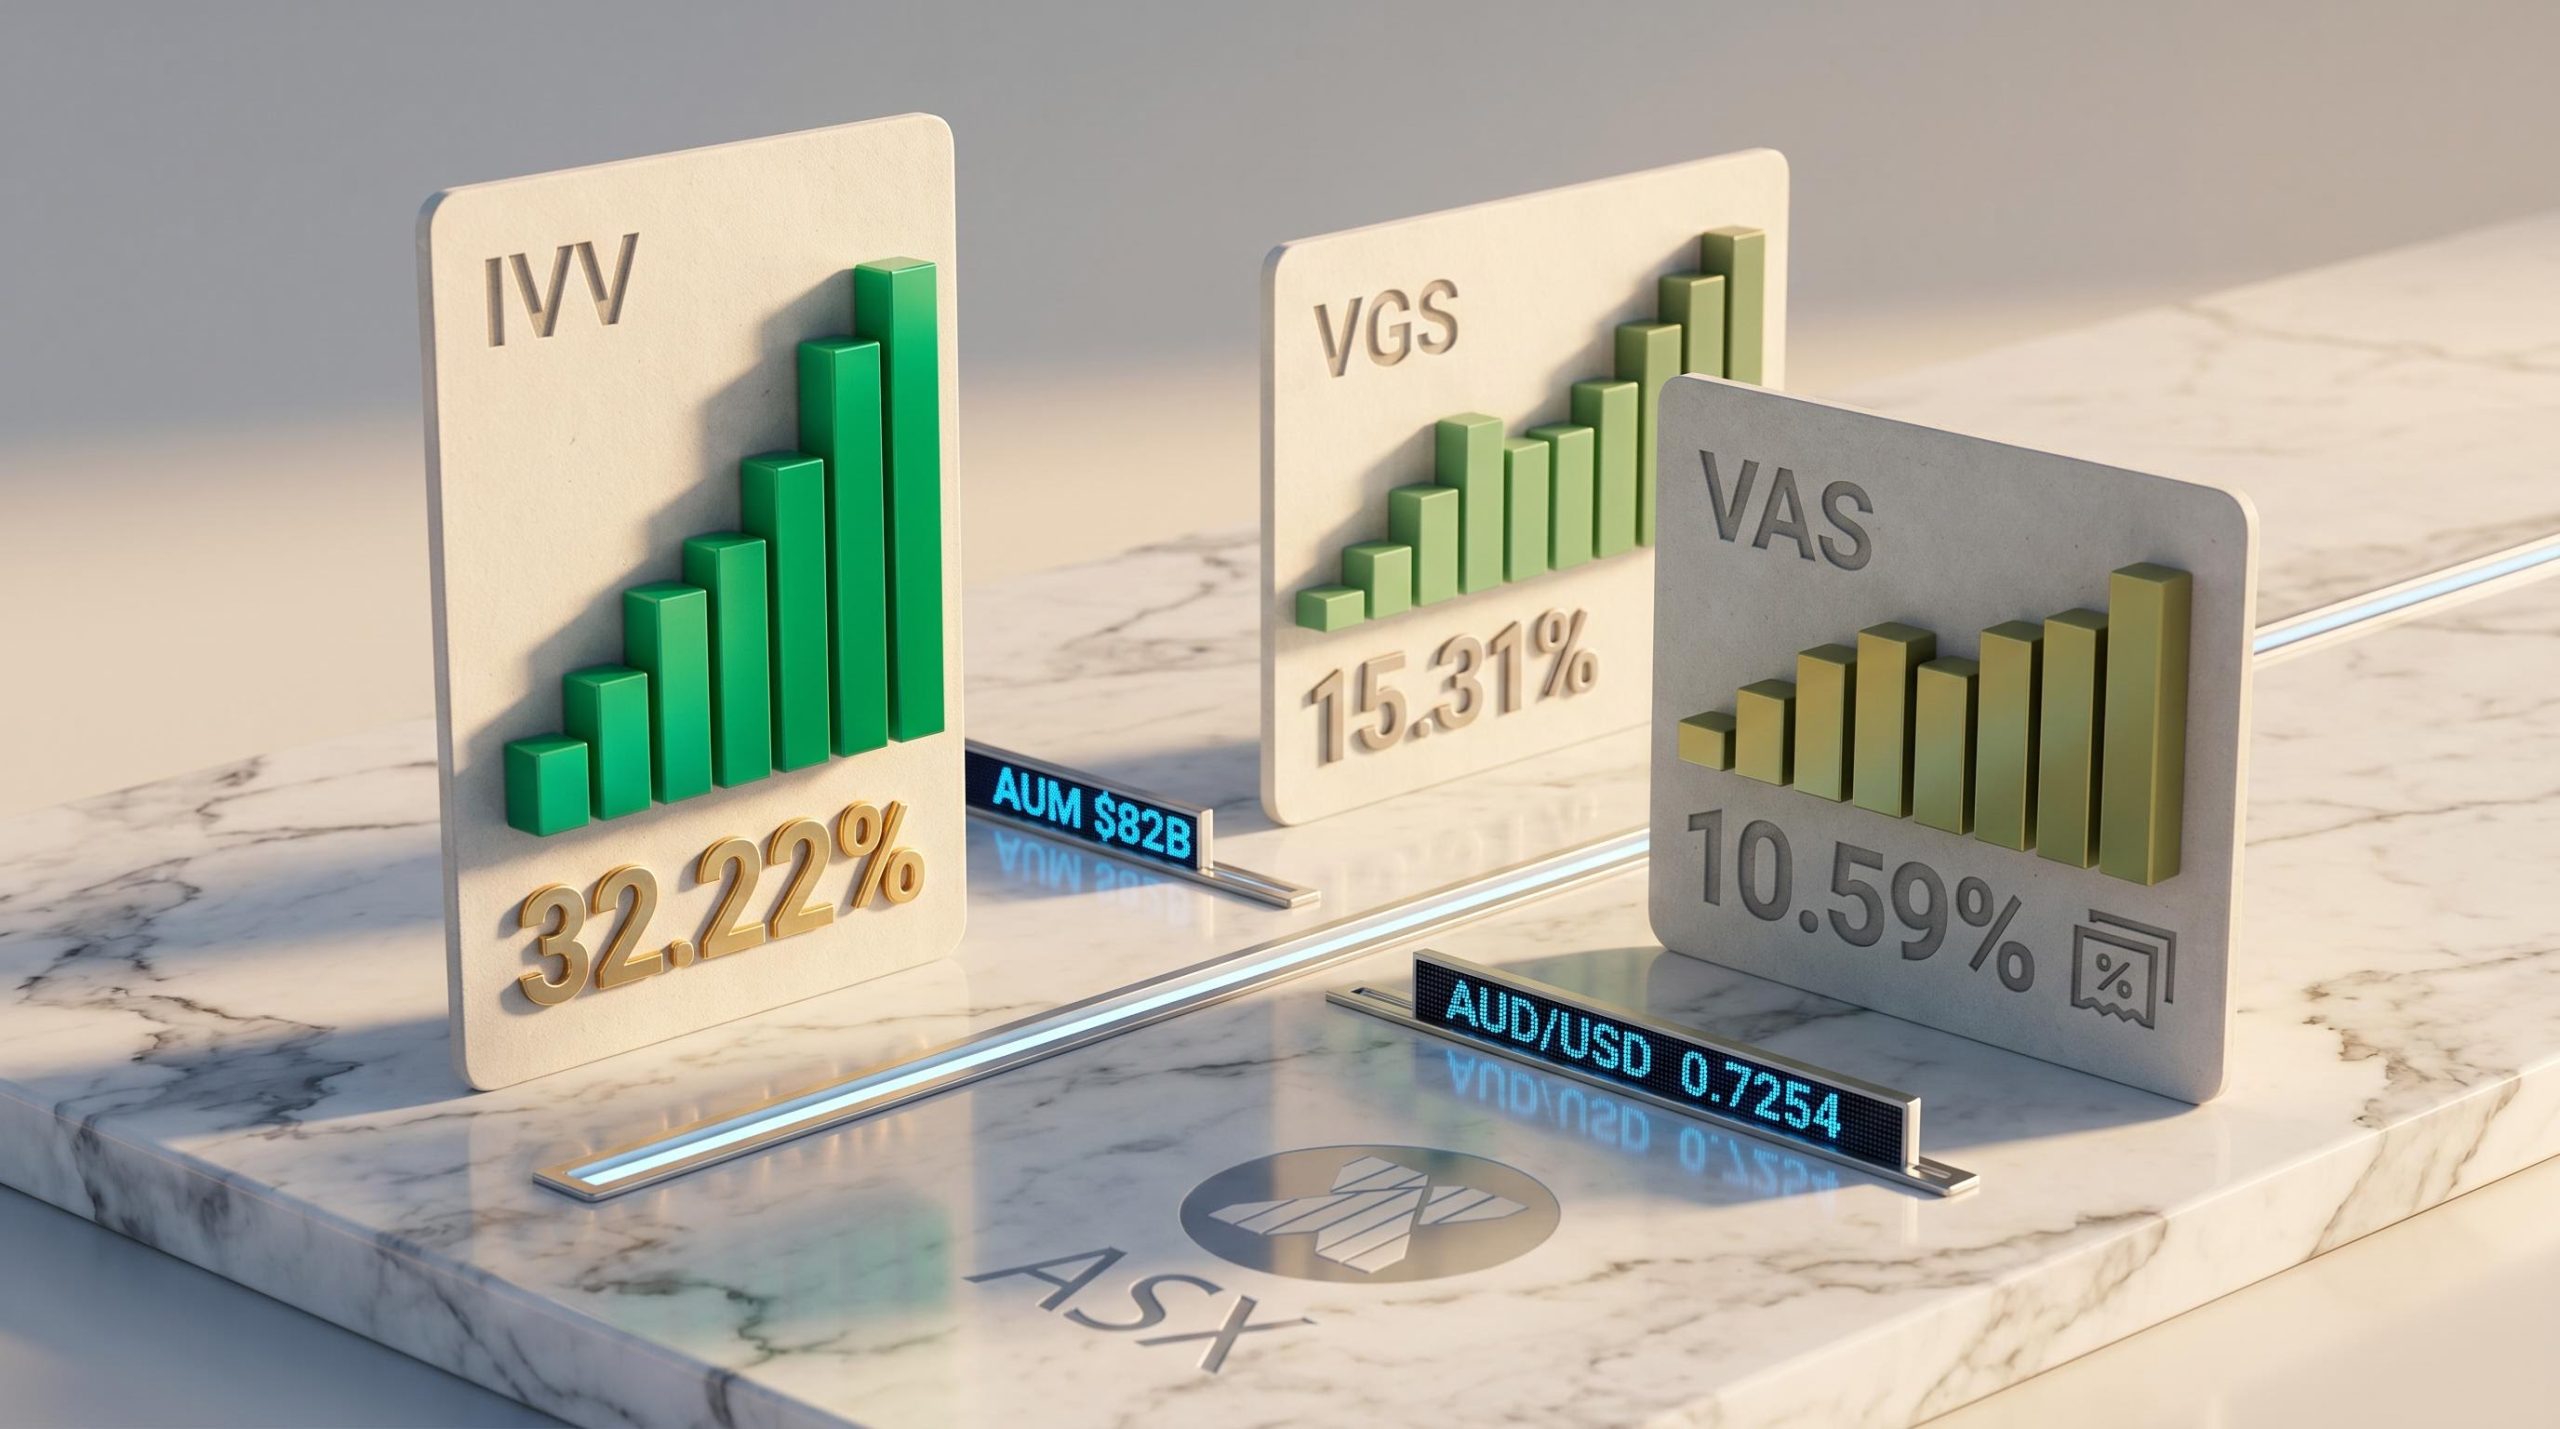
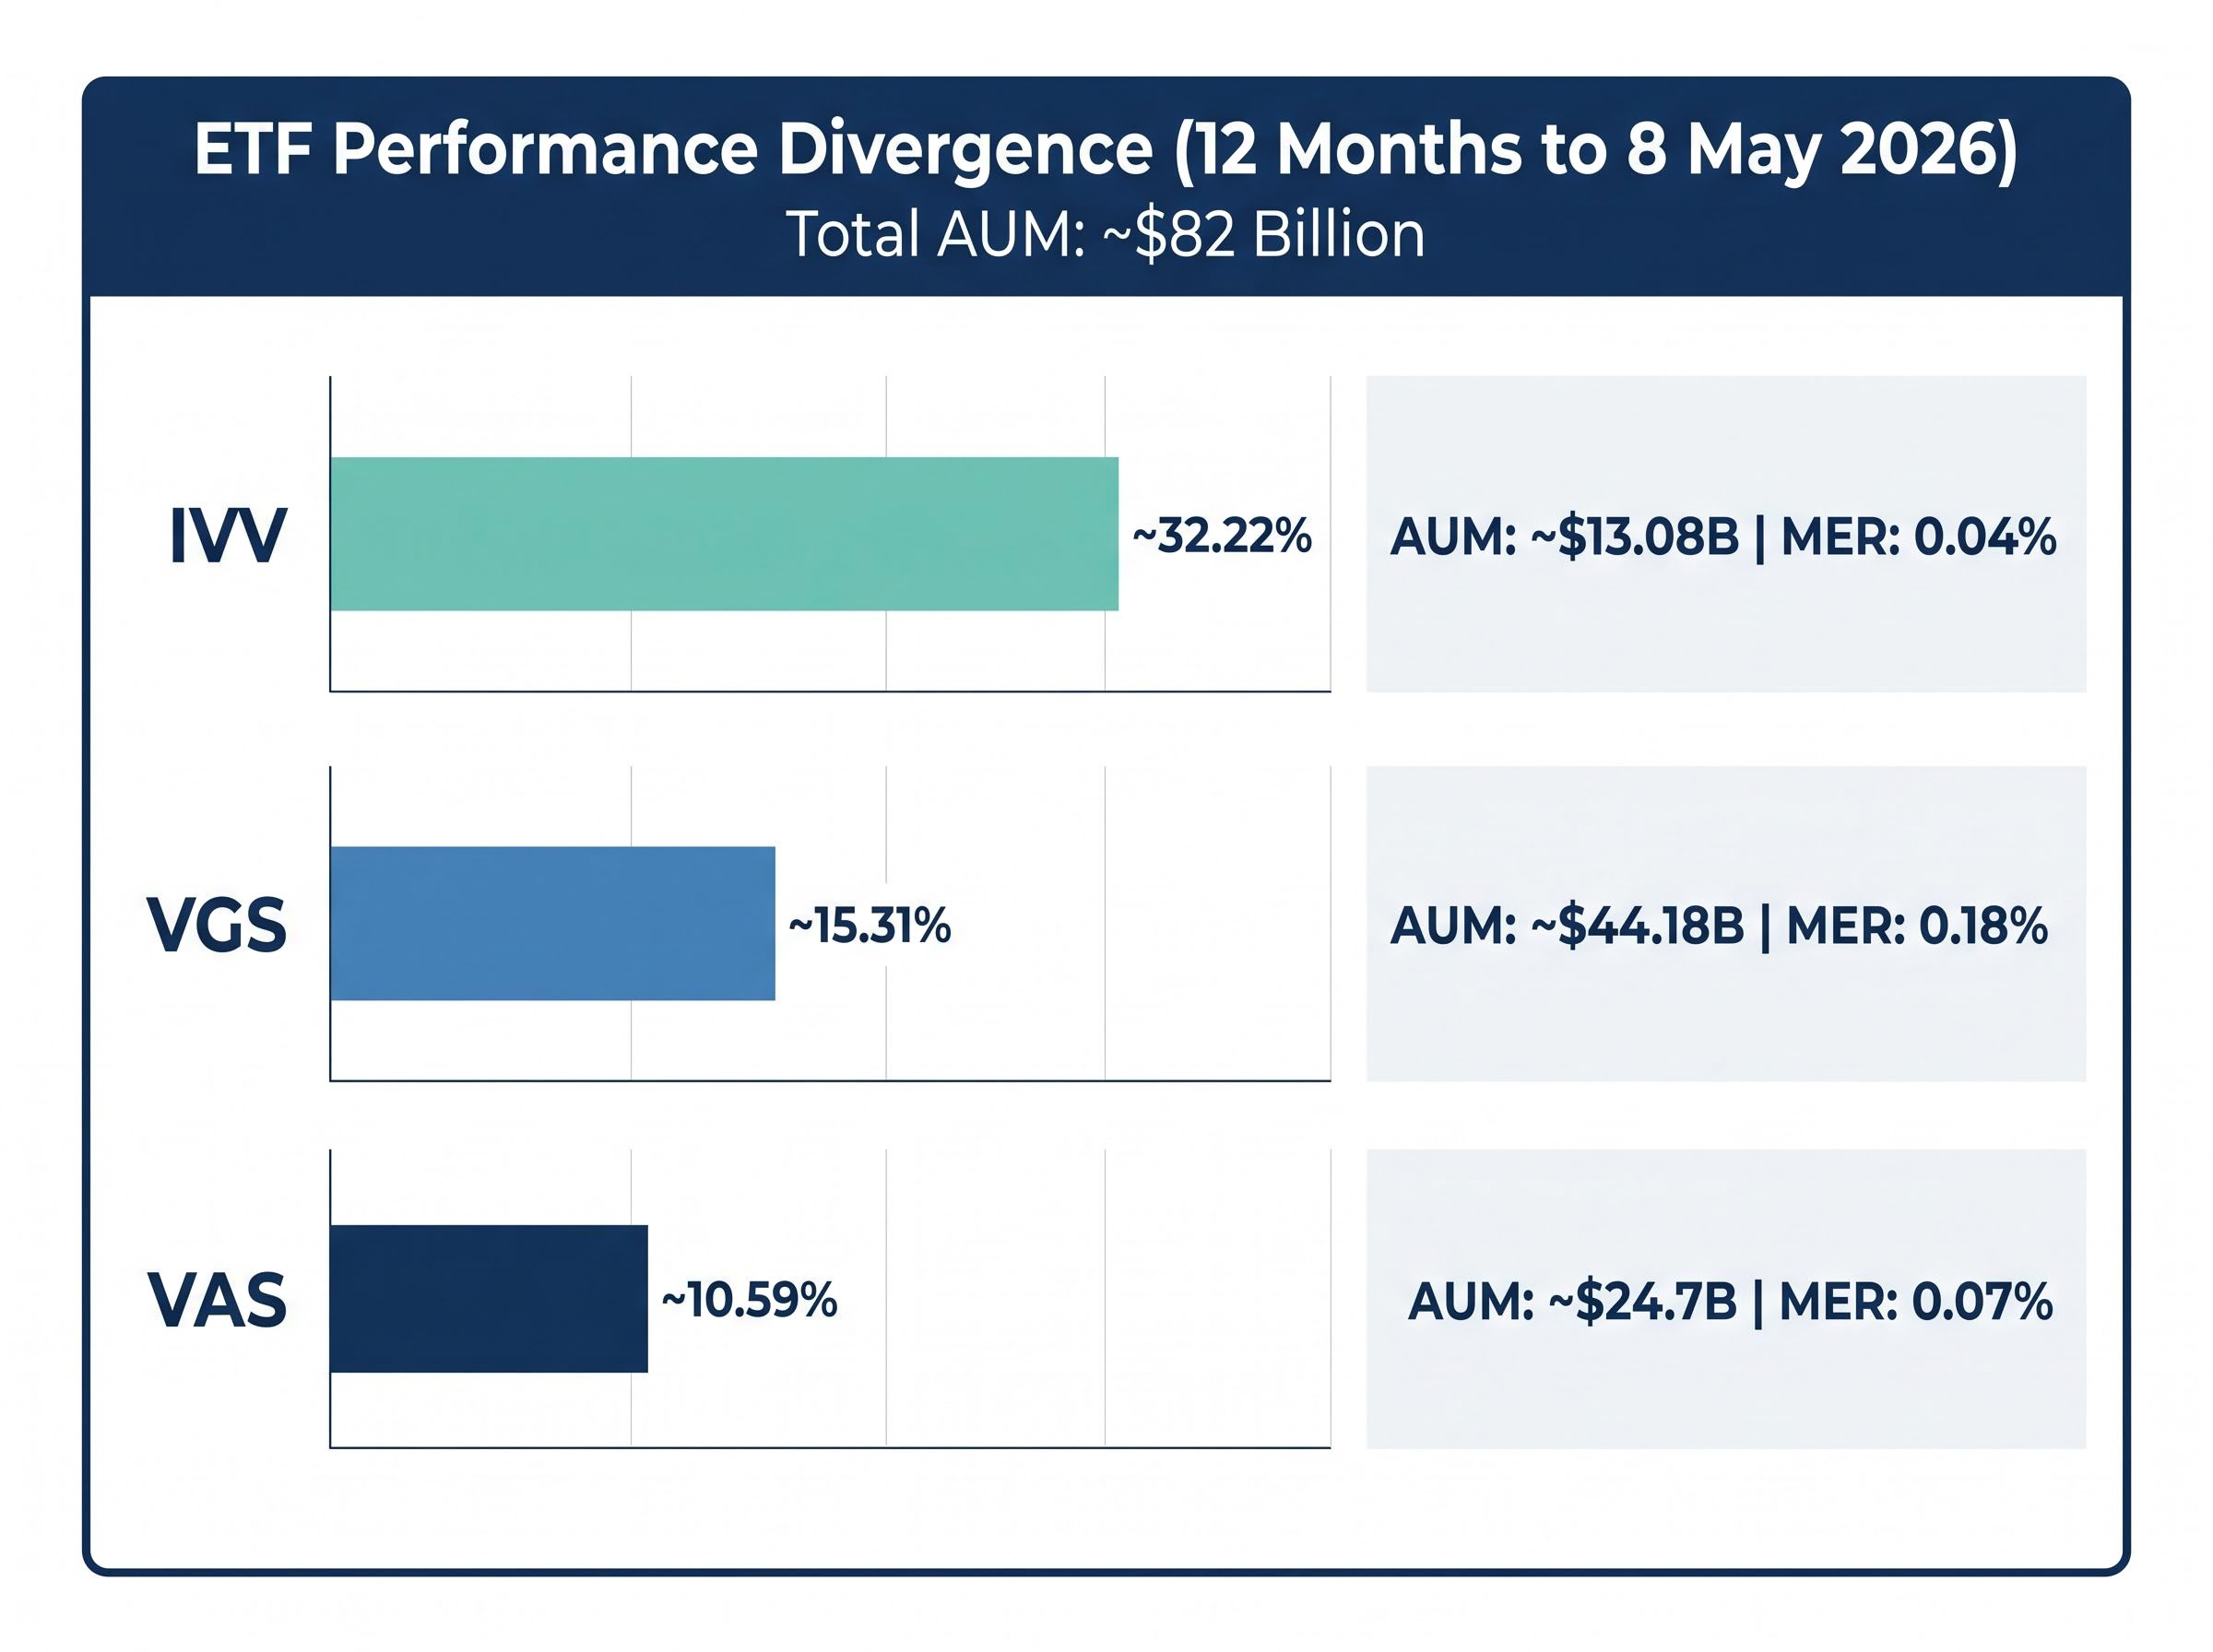
Over the 12 months to 8 May 2026, the three most widely held ASX ETFs delivered starkly different results. IVV returned approximately 32.22%. VGS returned approximately 15.31%. VAS delivered a total return (including dividends) of approximately 10.59%, with a price return of roughly 4.91%.
IVV’s 32.22% one-year return against VAS’s 10.59% total return represents a gap of more than 21 percentage points, the widest divergence between domestic and US equity ETFs in recent memory.
That gap is not random noise. It reflects structural differences in what each fund owns, the economies each is tied to, and the currency dynamics affecting returns for Australian investors. The combined AUM across all three funds tells its own story about scale: VAS holds approximately $24.7 billion, VGS approximately $44.18 billion, and IVV approximately $13.08 billion, totalling roughly $82 billion in Australian investor capital.
| ETF | Exposure | 1-Year Return | AUM (AUD) | MER |
|---|---|---|---|---|
| VAS | Australian equities (ASX 300) | ~10.59% (total) | ~$24.7B | 0.07% |
| VGS | Global ex-Australia (MSCI World ex-AU) | ~15.31% | ~$44.18B | 0.18% |
| IVV | US equities (S&P 500) | ~32.22% | ~$13.08B | 0.04% |
The numbers tell the story of this cycle’s winners and laggards. What follows explains why.
Treating these three ETFs as interchangeable “diversified” holdings is one of the most common errors in Australian retail portfolios. Each fund tracks a different index, holds different companies, operates in a different currency environment, and responds to a different set of economic forces. The performance divergence above becomes predictable once the composition is understood.
The distinction matters most when markets fall sharply: what ETF ownership means in practice, specifically that investors hold units in a pooled trust rather than direct shares, shapes how distributions are calculated, how voting rights work, and how the fund responds to large simultaneous redemptions.
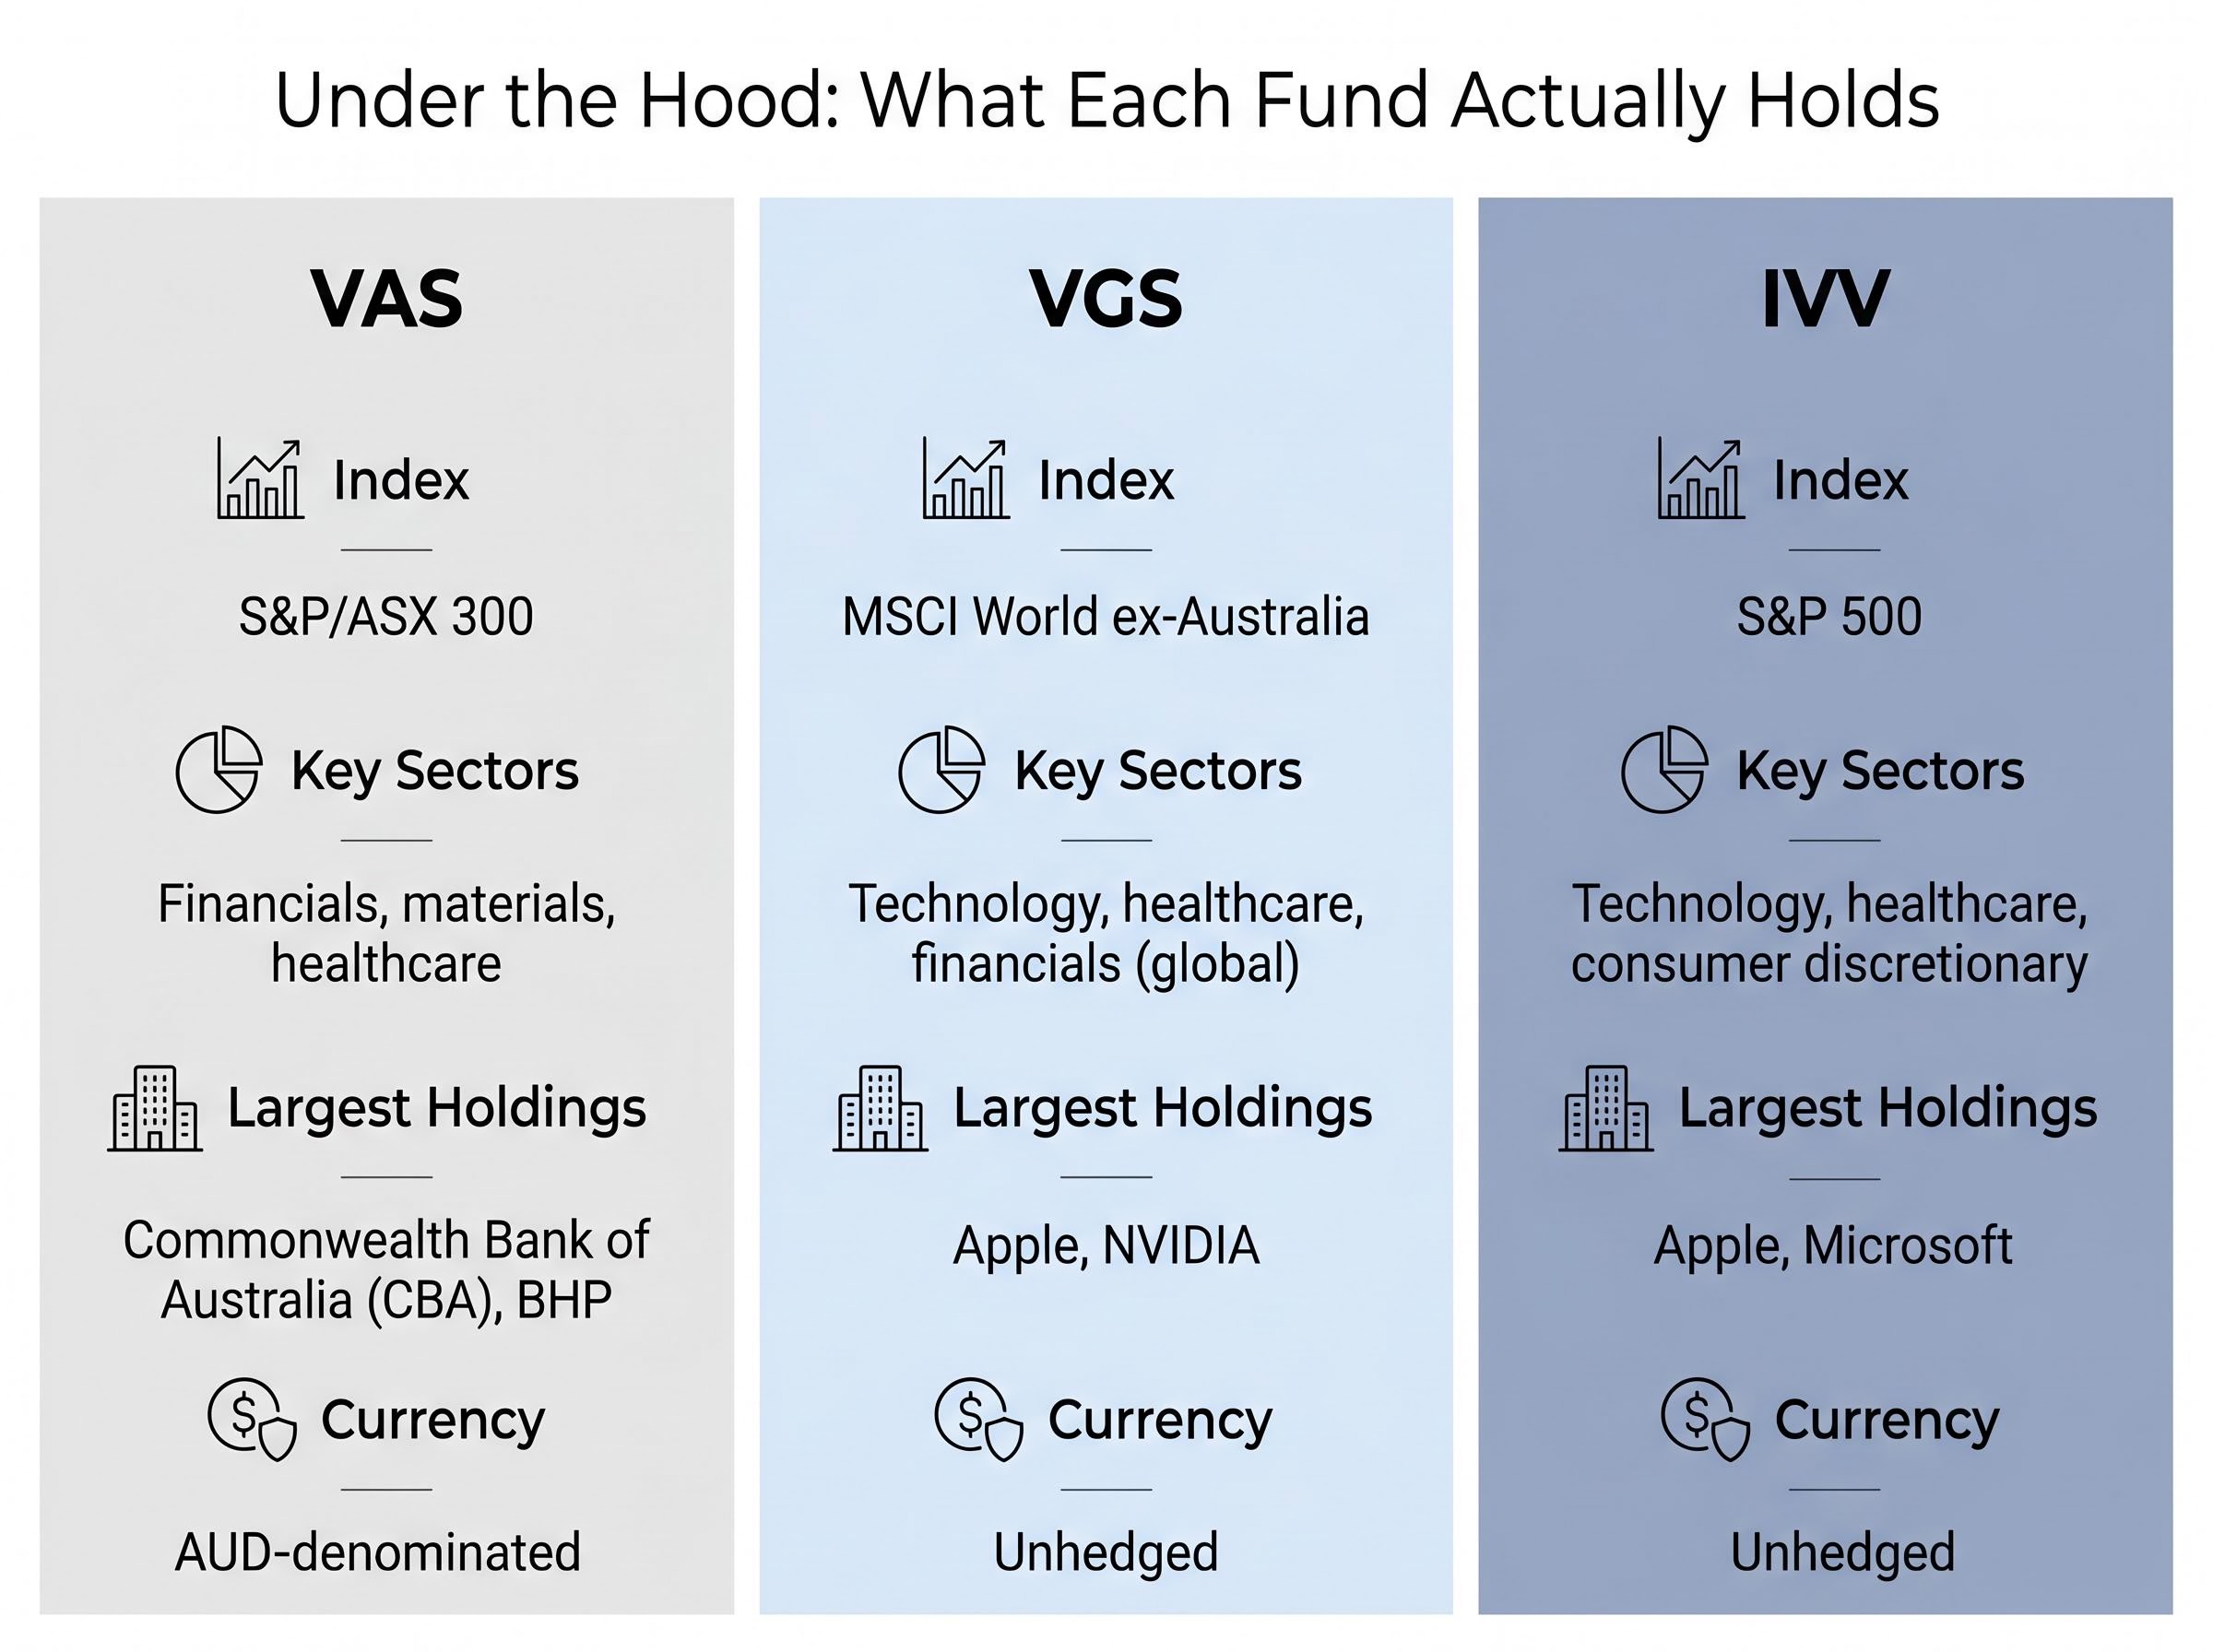
VAS tracks the ASX 300, providing exposure to Australia’s 300 largest listed companies. In practice, the fund is heavily concentrated in two sectors: financials and materials.
The dominance of banks and miners means VAS’s returns are closely tied to domestic credit conditions, commodity prices, and RBA policy.
VGS tracks the MSCI World ex-Australia Index, covering large and mid-cap companies across developed markets outside Australia. Its geographic spread includes the US, Europe, Japan, and the UK.
IVV tracks the S&P 500, giving investors direct exposure to the 500 largest US-listed companies. AI and cloud computing strength has been the primary performance engine over the past year.
With three distinct geographic mandates, three different sector profiles, and two different currency treatments, the funds deliver very different things. The 21-percentage-point gap between IVV and VAS over the past year is not an anomaly; it is the logical result of what each fund holds.
In late 2024, the consensus story for Australian equities was constructive. Morgan Stanley forecast the ASX 200 reaching 8,500 by the end of 2025, supported by projected RBA rate cuts. Dr. Shane Oliver at AMP set a target of 8,800 and approximately 7% returns for Australian shares, with the same easing premise underpinning the outlook.
The index did reach approximately 8,714 by the end of 2025, meeting or exceeding the headline targets. But the mechanism those forecasts relied on never materialised.
The RBA raised the cash rate to 4.35% on 5 May 2026, the third hike in five months, reversing all 2025 cuts and invalidating the easing narrative that was supposed to power domestic equities higher.
The RBA’s May 2026 cash rate decision lifted the target rate to 4.35 per cent, confirming the third increase in five months and formally closing the door on the easing cycle that domestic equity forecasters had built their 2025 outlooks around.
The tightening cycle has placed direct pressure on Australian bank earnings through net interest margin compression and credit growth constraints, both of which weigh on VAS given its heavy financial sector weighting. VAS’s 2026 year-to-date return of +1.24% (as of 8 May 2026) reflects this relatively flat domestic backdrop.
Three macro forces now separate the trajectories of these funds:
Despite the underperformance, VAS attracted +$6.46 billion in net inflows over the past year, suggesting a large cohort of investors continue to value domestic equity exposure for reasons beyond capital appreciation.
A 12-month return figure captures what happened. It does not capture what could happen next. Each of these funds carries specific structural risks that become more relevant, not less, after a period of strong or weak performance.
For VAS, the primary risk is sector concentration. Heavy weighting in banks and materials means a domestic economic slowdown or a sustained commodity price decline would transmit directly into fund returns. The RBA’s tightening stance compounds this pressure on bank earnings.
For VGS, the risk profile is broader: geopolitical exposure across multiple developed markets and currency risk against several foreign currencies. The fund’s wide geographic spread is a partial buffer against single-country shocks but does not eliminate global market cycle risk. At 0.18%, it also carries the highest MER of the three.
For IVV, the risk is concentrated at the top. Mega-cap technology names including Apple and Microsoft represent an outsized share of the S&P 500. A sentiment reversal on AI valuations, or a regulatory shift targeting large technology companies through antitrust or taxation measures, could have disproportionate negative effects on the fund.
Investors comparing IVV to other technology-heavy options should note that Nasdaq 100 concentration takes the S&P 500’s mega-cap skew further still, with the top 10 holdings representing approximately 50% or more of that fund’s portfolio and a three-month drawdown of 8.43% recorded as recently as March 2026.
| ETF | Primary Risk Factor | Secondary Risk Factor | Currency Exposure |
|---|---|---|---|
| VAS | Bank and materials concentration | Domestic economic slowdown | None (AUD-denominated) |
| VGS | Global market cycle exposure | Multi-currency geopolitical risk | Unhedged (multiple currencies) |
| IVV | Mega-cap tech concentration | AI valuation reversal risk | Unhedged (USD; AUD/USD ~0.7254) |
For Australian investors holding VGS or IVV, currency movements are not a secondary consideration. They are a direct component of total returns.
Both funds are unhedged, meaning returns are earned in foreign currencies and converted back to Australian dollars at the prevailing exchange rate. When the AUD strengthens against the USD, IVV’s returns shrink in AUD terms, regardless of what the S&P 500 does. At an AUD/USD rate of approximately 0.7254, a move back toward 0.78 or higher would meaningfully erode the AUD-denominated returns Australian investors see in their brokerage accounts.
IVV’s 32.22% return over the past year partly reflects a favourable currency tailwind. Investors extrapolating that return forward without accounting for potential AUD appreciation are carrying a risk they may not have priced in.
Each fund occupies a distinct role, and recognising those roles is what separates deliberate allocation from accidental concentration.
VAS’s 3.15% distribution yield, combined with franking credit eligibility, remains the primary reason income-focused Australian investors continue to allocate to domestic equities despite international outperformance.
For SMSF trustees and retirees weighing VAS against international alternatives, our dedicated guide to franking credit calculations walks through the 30/70 formula with worked examples, explains the ATO’s automatic refund process for investors aged over 60, and quantifies why a $1,000 fully franked dividend can be worth $1,428.57 in total value to eligible low-tax investors.
The three funds are structurally complementary rather than overlapping. VAS covers domestic Australia. IVV covers the US specifically. VGS covers developed markets outside Australia, with the US as a significant but not exclusive component. Holding all three is not redundancy; it is coverage.
VAS’s $6.46 billion in one-year net inflows confirms that a large cohort of Australian investors understand this distinction and are choosing domestic exposure deliberately, not by default.
A 21-percentage-point gap between IVV and VAS over 12 months is attention-worthy. It is not, by itself, evidence that a portfolio is broken.
Single-year performance divergence is a normal feature of a multi-asset, multi-geography portfolio. The years where all three funds deliver similar returns are rarer than the years where they diverge. That divergence is the mechanism through which diversification operates: when one region or sector lags, the others compensate.
When reviewing holdings, three questions provide a practical framework:
MER comparison: IVV charges 0.04%, VAS 0.07%, and VGS 0.18%. The differences appear modest in a single year, but over a 20-30 year investment horizon, they compound into meaningful cost divergence and are worth factoring into long-term allocation decisions.
The low MER figures cited above sit within a broader context worth understanding: ASX ETF structure and costs differ meaningfully across fund types, with passive index products charging as little as 0.04% while actively managed alternatives run at roughly 20 times that rate, a gap that compounds significantly over a 20-30 year holding period.
VAS’s continued strong inflows suggest that many investors are actively choosing domestic equity exposure for reasons beyond capital growth, including income, franking credits, and reduced currency risk. That decision is defensible when made deliberately.
The investors most likely to make costly decisions at this point are those who see IVV’s return and pile in after the run, or those who abandon VAS out of frustration. Both responses misread what a diversified portfolio is designed to do.
VAS, VGS, and IVV each serve a distinct and defensible role. The 12-month performance gap reflects structural differences in geography, sector composition, and currency exposure, not a strategic failure in any single fund.
The appropriate response is informed review, not reactive reallocation. Before adjusting weightings, investors should assess:
For investors considering a significant reweighting toward IVV given its recent performance, the concentration and currency risks outlined above warrant careful assessment, ideally with the input of a licensed financial adviser.
The macro environment, including the RBA’s tightening cycle and the AUD/USD trajectory, will continue to shape relative performance across these three funds. Periodic review is a reasonable practice. Chasing last year’s best performer is not.
This article is for informational purposes only and should not be considered financial advice. Investors should conduct their own research and consult with financial professionals before making investment decisions. Past performance does not guarantee future results.
VAS tracks Australia's 300 largest listed companies via the S&P/ASX 300, VGS tracks global developed markets outside Australia via the MSCI World ex-Australia Index, and IVV tracks the 500 largest US-listed companies via the S&P 500. Each fund provides exposure to a different geography, sector mix, and currency environment.
IVV's 32.22% return versus VAS's 10.59% total return reflects AI-driven momentum in US mega-cap technology stocks, a favourable AUD/USD currency tailwind for unhedged Australian holders, and the RBA's tightening cycle weighing on Australia's bank-heavy domestic equity market.
Both IVV and VGS are unhedged, meaning returns are earned in foreign currencies and converted back to Australian dollars at the prevailing exchange rate. If the AUD strengthens against the USD, IVV's returns shrink in AUD terms regardless of how the S&P 500 performs.
VAS offers a 3.15% distribution yield plus access to franking credits, which provide a direct tax benefit for eligible Australian investors, making it the preferred income-focused option for retirees and SMSF trustees even when international funds deliver higher capital returns.
IVV charges the lowest MER at 0.04%, VAS sits at 0.07%, and VGS carries the highest at 0.18%. While the differences appear small in a single year, they compound into meaningful cost divergence over a 20-30 year investment horizon.