What JEPI Actually Is and Whether It Fits Your Portfolio
3 hrs ago

The moment a company pays a dividend, its stock price falls by almost exactly that amount. The shareholder receives cash in one hand and loses an equivalent portion of portfolio value in the other. Most investors have never been told this. Dividend-paying stocks are marketed relentlessly as stable income generators, and investor surveys consistently show that a large proportion of retail participants treat dividends like bond interest: money received on top of their investment’s value. That assumption is a meaningful financial error with real consequences for portfolio construction and long-term returns. What follows is a step-by-step explanation of how dividends actually move through a company’s balance sheet into a shareholder’s account, why this does not constitute “extra” income, and how total return, rather than yield, serves as the correct lens for evaluating any dividend-paying investment.
The mental model is intuitive. A company pays $2 per share every quarter, and the cash appears in the brokerage account. It feels like interest on a savings deposit: money earned simply for holding the asset. Most retail investors understand dividends this way, treating the payment as income received on top of the stock’s value, analogous to a bond coupon.
Richard Thaler’s mental accounting framework explains why this belief is so persistent. Investors mentally separate “income” (the dividend) from “capital” (the shares), even though the economics are unified. The dividend cash and the share price are two components of the same total value. Separating them into different mental categories creates the illusion that the dividend is a bonus.
A secondary driver is the bird-in-hand fallacy: the psychological preference for certain near-term cash over equivalent expected future returns. Meir Statman’s research on the “dividend preference puzzle” attributes retail investors’ outsized appetite for dividend stocks to precisely this combination of mental accounting and bird-in-hand bias, rather than rational return expectations.
The bird-in-hand bias and mental accounting that distort dividend evaluation are part of a broader cluster of cognitive bias and investor psychology mechanisms, including loss aversion and recency bias, that interact and amplify one another, particularly during periods of market stress when yield-as-safety narratives gain the most traction.
Spencer Jakab, writing in the Wall Street Journal on 7 May 2026, noted that investor surveys reveal a widespread incorrect belief that dividends constitute free money.
Financial media and fund marketing reinforce the misconception through repeated exposure, routinely presenting dividend yield as a standalone quality signal. Recognising the mental accounting mechanism is the first step toward evaluating dividend-paying stocks on their actual merits.
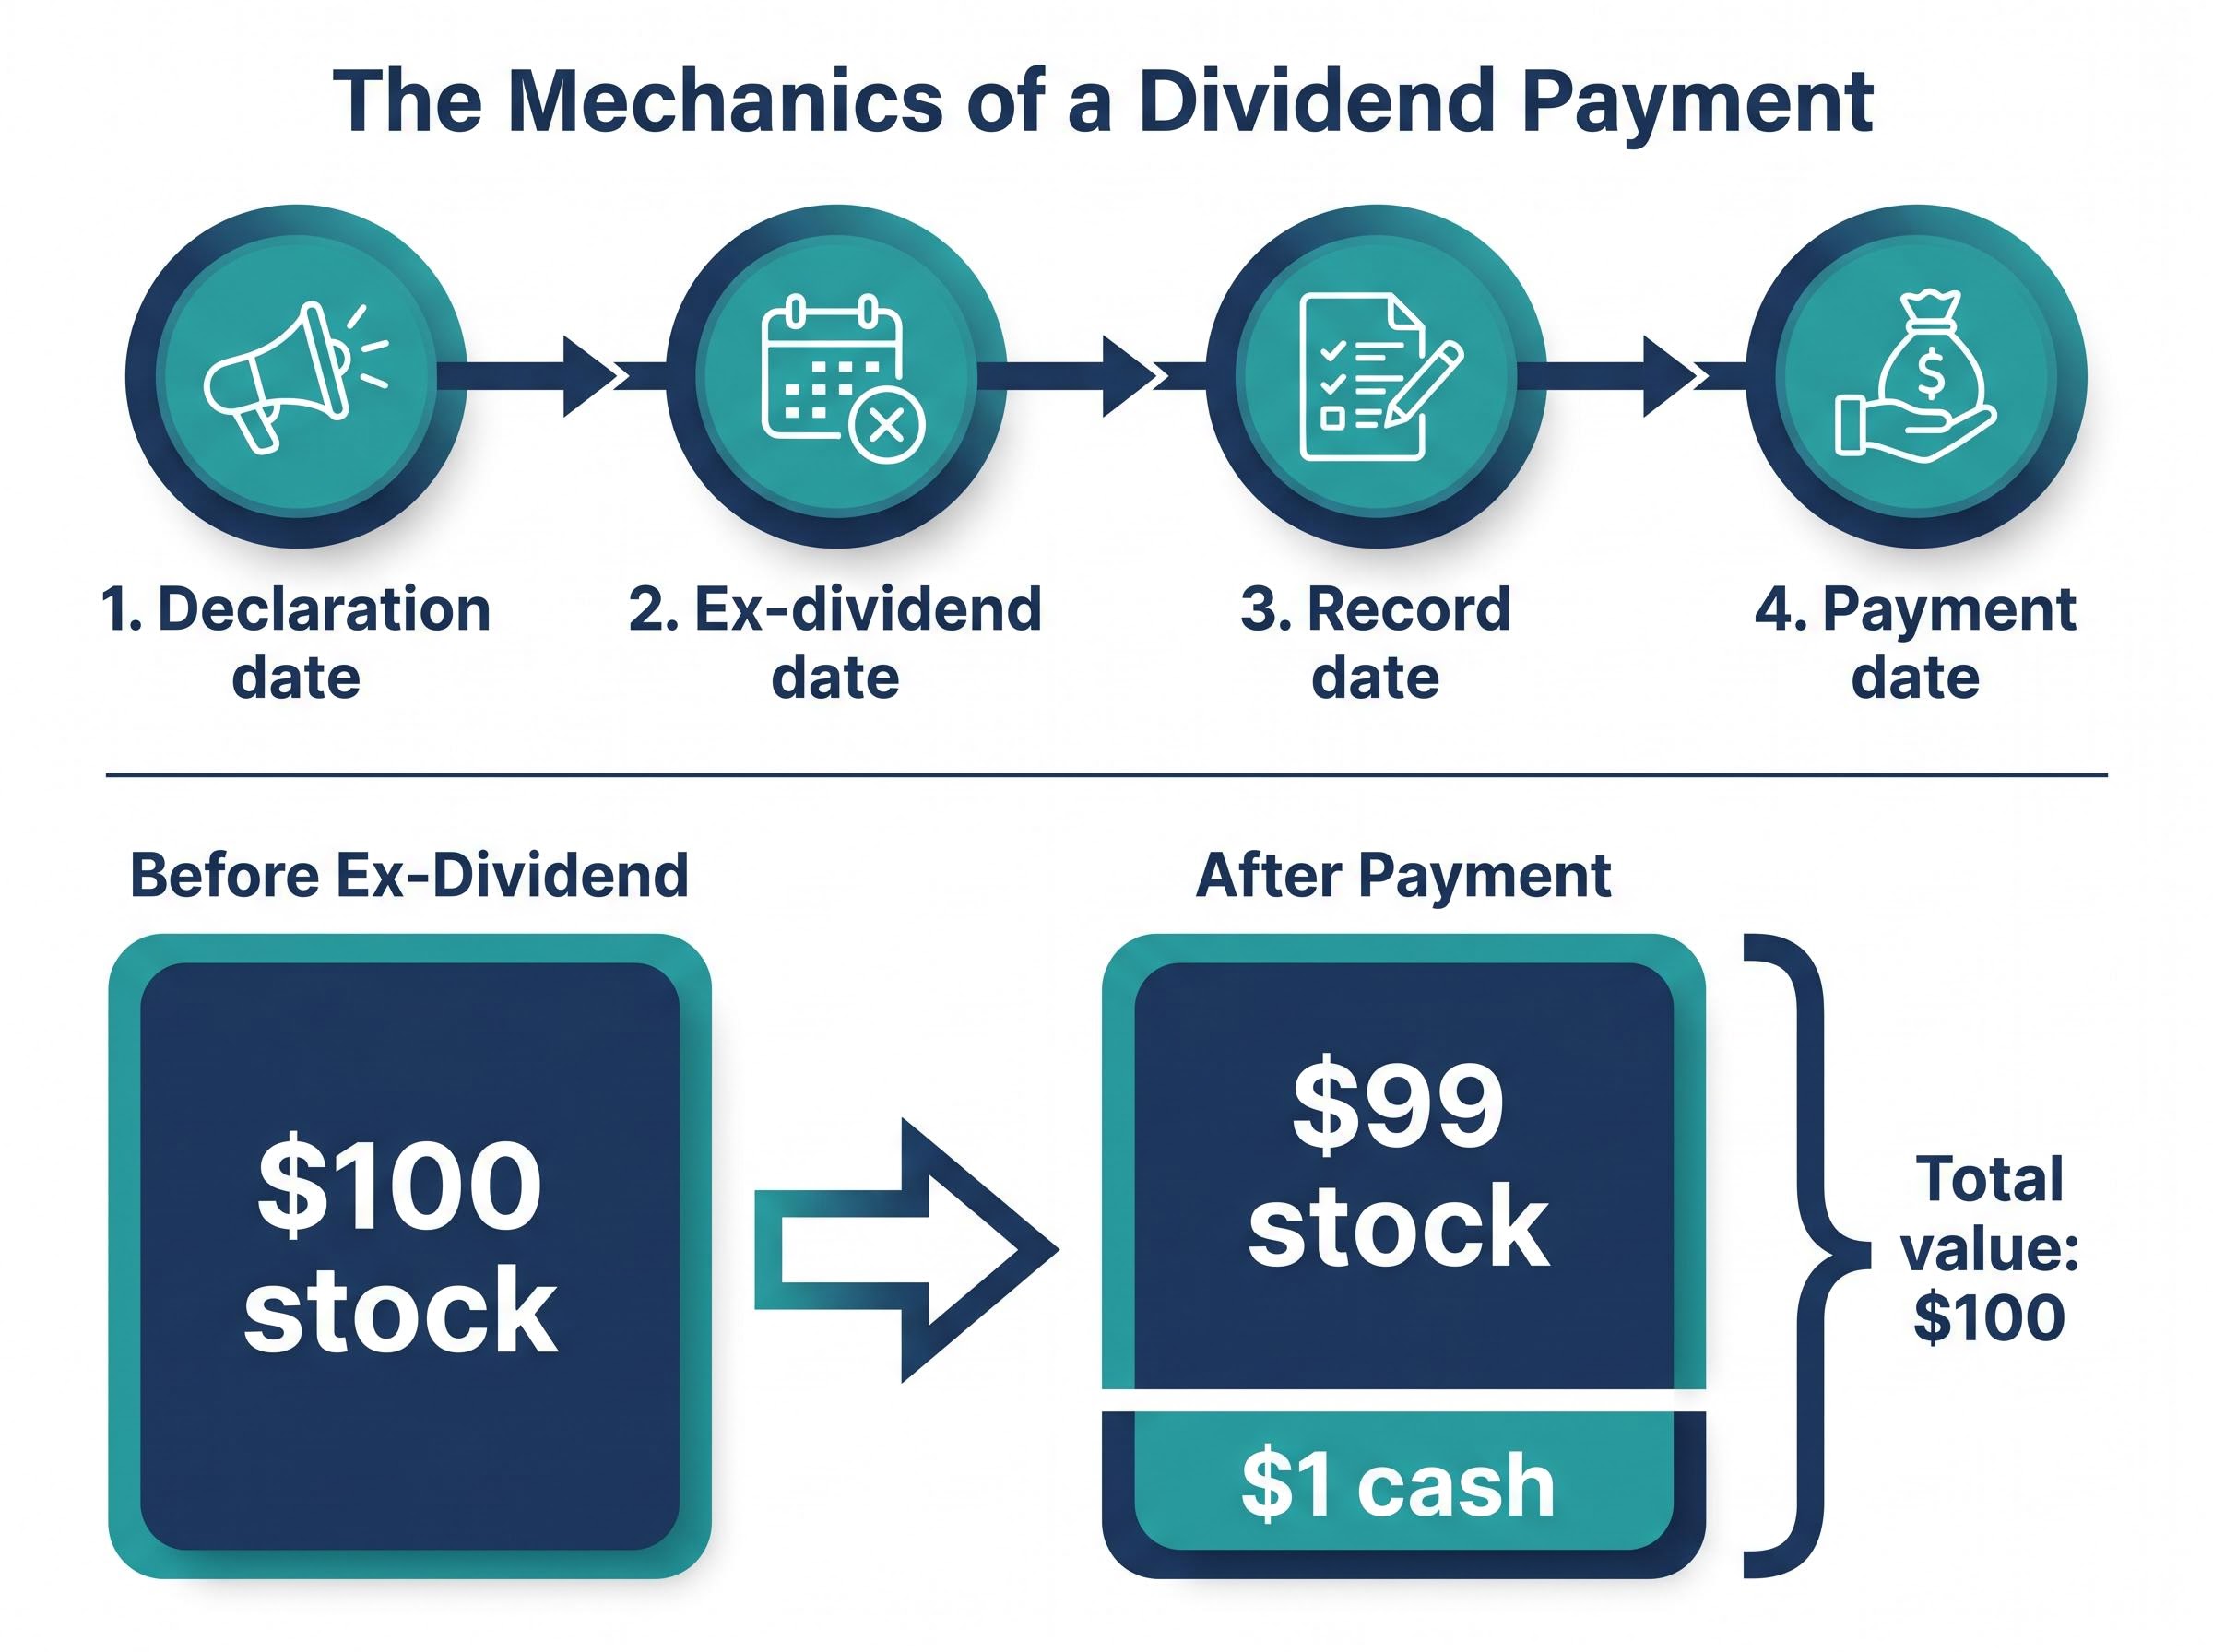
Consider a stock trading at $100 per share. The company declares a $1 dividend. On the ex-dividend date, the stock opens at approximately $99. The investor now holds $99 in stock and $1 in cash. Total value: $100.
The process follows four dates, each with a distinct function:
The distinction from bond interest matters. A bond pays interest in addition to the principal, which is returned at maturity. A dividend, by contrast, reduces the company’s underlying value by the distributed amount. Cash leaves the company’s balance sheet and enters the shareholder’s account. No new value is created in the process.
A $1 dividend received equals a $1 share price decline. Before tax, the investor’s total wealth position is unchanged. After tax on the dividend receipt, the investor may actually be worse off.
This is the correction that reframes everything. Dividends represent a redistribution of existing company value, not a creation of new value. The shareholder’s total economic position (shares plus cash) is identical at the moment of payment, minus any tax liability on the receipt.
Total return measures price appreciation plus dividends. It is the single correct lens for evaluating investment performance, and separating the two components distorts decision-making. An investor who celebrates a 4% yield while ignoring a 6% price decline has lost money, not earned income.
The backtested case for dividend investing vs total return strategies is starker than most yield-focused investors expect: a total market portfolio returned 10.49% annualised from 2016–2025, compared with 9.43% for a dividend-focused equivalent, a gap that compounds to roughly $116,000 on a $100,000 starting position over 20 years.
That said, dividend income has a legitimate use case. Retirees and investors requiring regular cash flow have rational reasons to value predictable payments. The evaluation, however, should still rest on total return. A stock yielding 5% with declining fundamentals is not superior to a stock yielding 1% with strong capital appreciation.
Three practical steps sharpen this framework:
Terry Smith of Fundsmith has noted that taxes substantially erode dividend reinvestment value, a point overlooked by investors exhibiting bird-in-hand bias.
Dividend Reinvestment Plans (DRIPs) make the total return framework concrete. Available through most major brokerages, often without transaction fees and sometimes at a discount to market price, DRIPs convert dividends back into shares, compounding total return rather than treating dividends as withdrawable income.
In 2004, Microsoft held an enormous surplus of cash on its balance sheet and elected to distribute it directly to shareholders through a special dividend: a large, one-time payment in addition to its regular quarterly dividend. The payment was substantial enough to create a visible divergence between two metrics investors rarely examine side by side.
FactSet data covering 31 December 2003 through 31 December 2004 shows the gap clearly.
| Metric | Microsoft price return (full year 2004) | Microsoft total return (full year 2004) | Difference |
|---|---|---|---|
| Annual return | Lower (price only) | Higher (price + dividends) | Approximately equal to the dividend distributed |
The price return lagged the total return by the amount of the dividend. The company’s share price reflected the cash departure; the total return figure added it back. The dividend did not represent additional gain. It represented a reclassification of return from one line to another.
Price return measures only share price movement. Total return adds dividend income to that figure. In economic terms, the two are equivalent: the investor’s wealth is the same regardless of whether value sits in the share price or in a cash receipt.
The illusion arises when investors look at price return alone and feel the stock “underperformed,” then look at the dividend and feel they received a bonus on top. They did not. The total return captures the complete picture, and it is the only metric that accurately measures how an investment performed over a given period.
A high dividend yield attracts attention. It suggests generosity, stability, and reliable income. The instinct is to buy. That instinct deserves scrutiny.
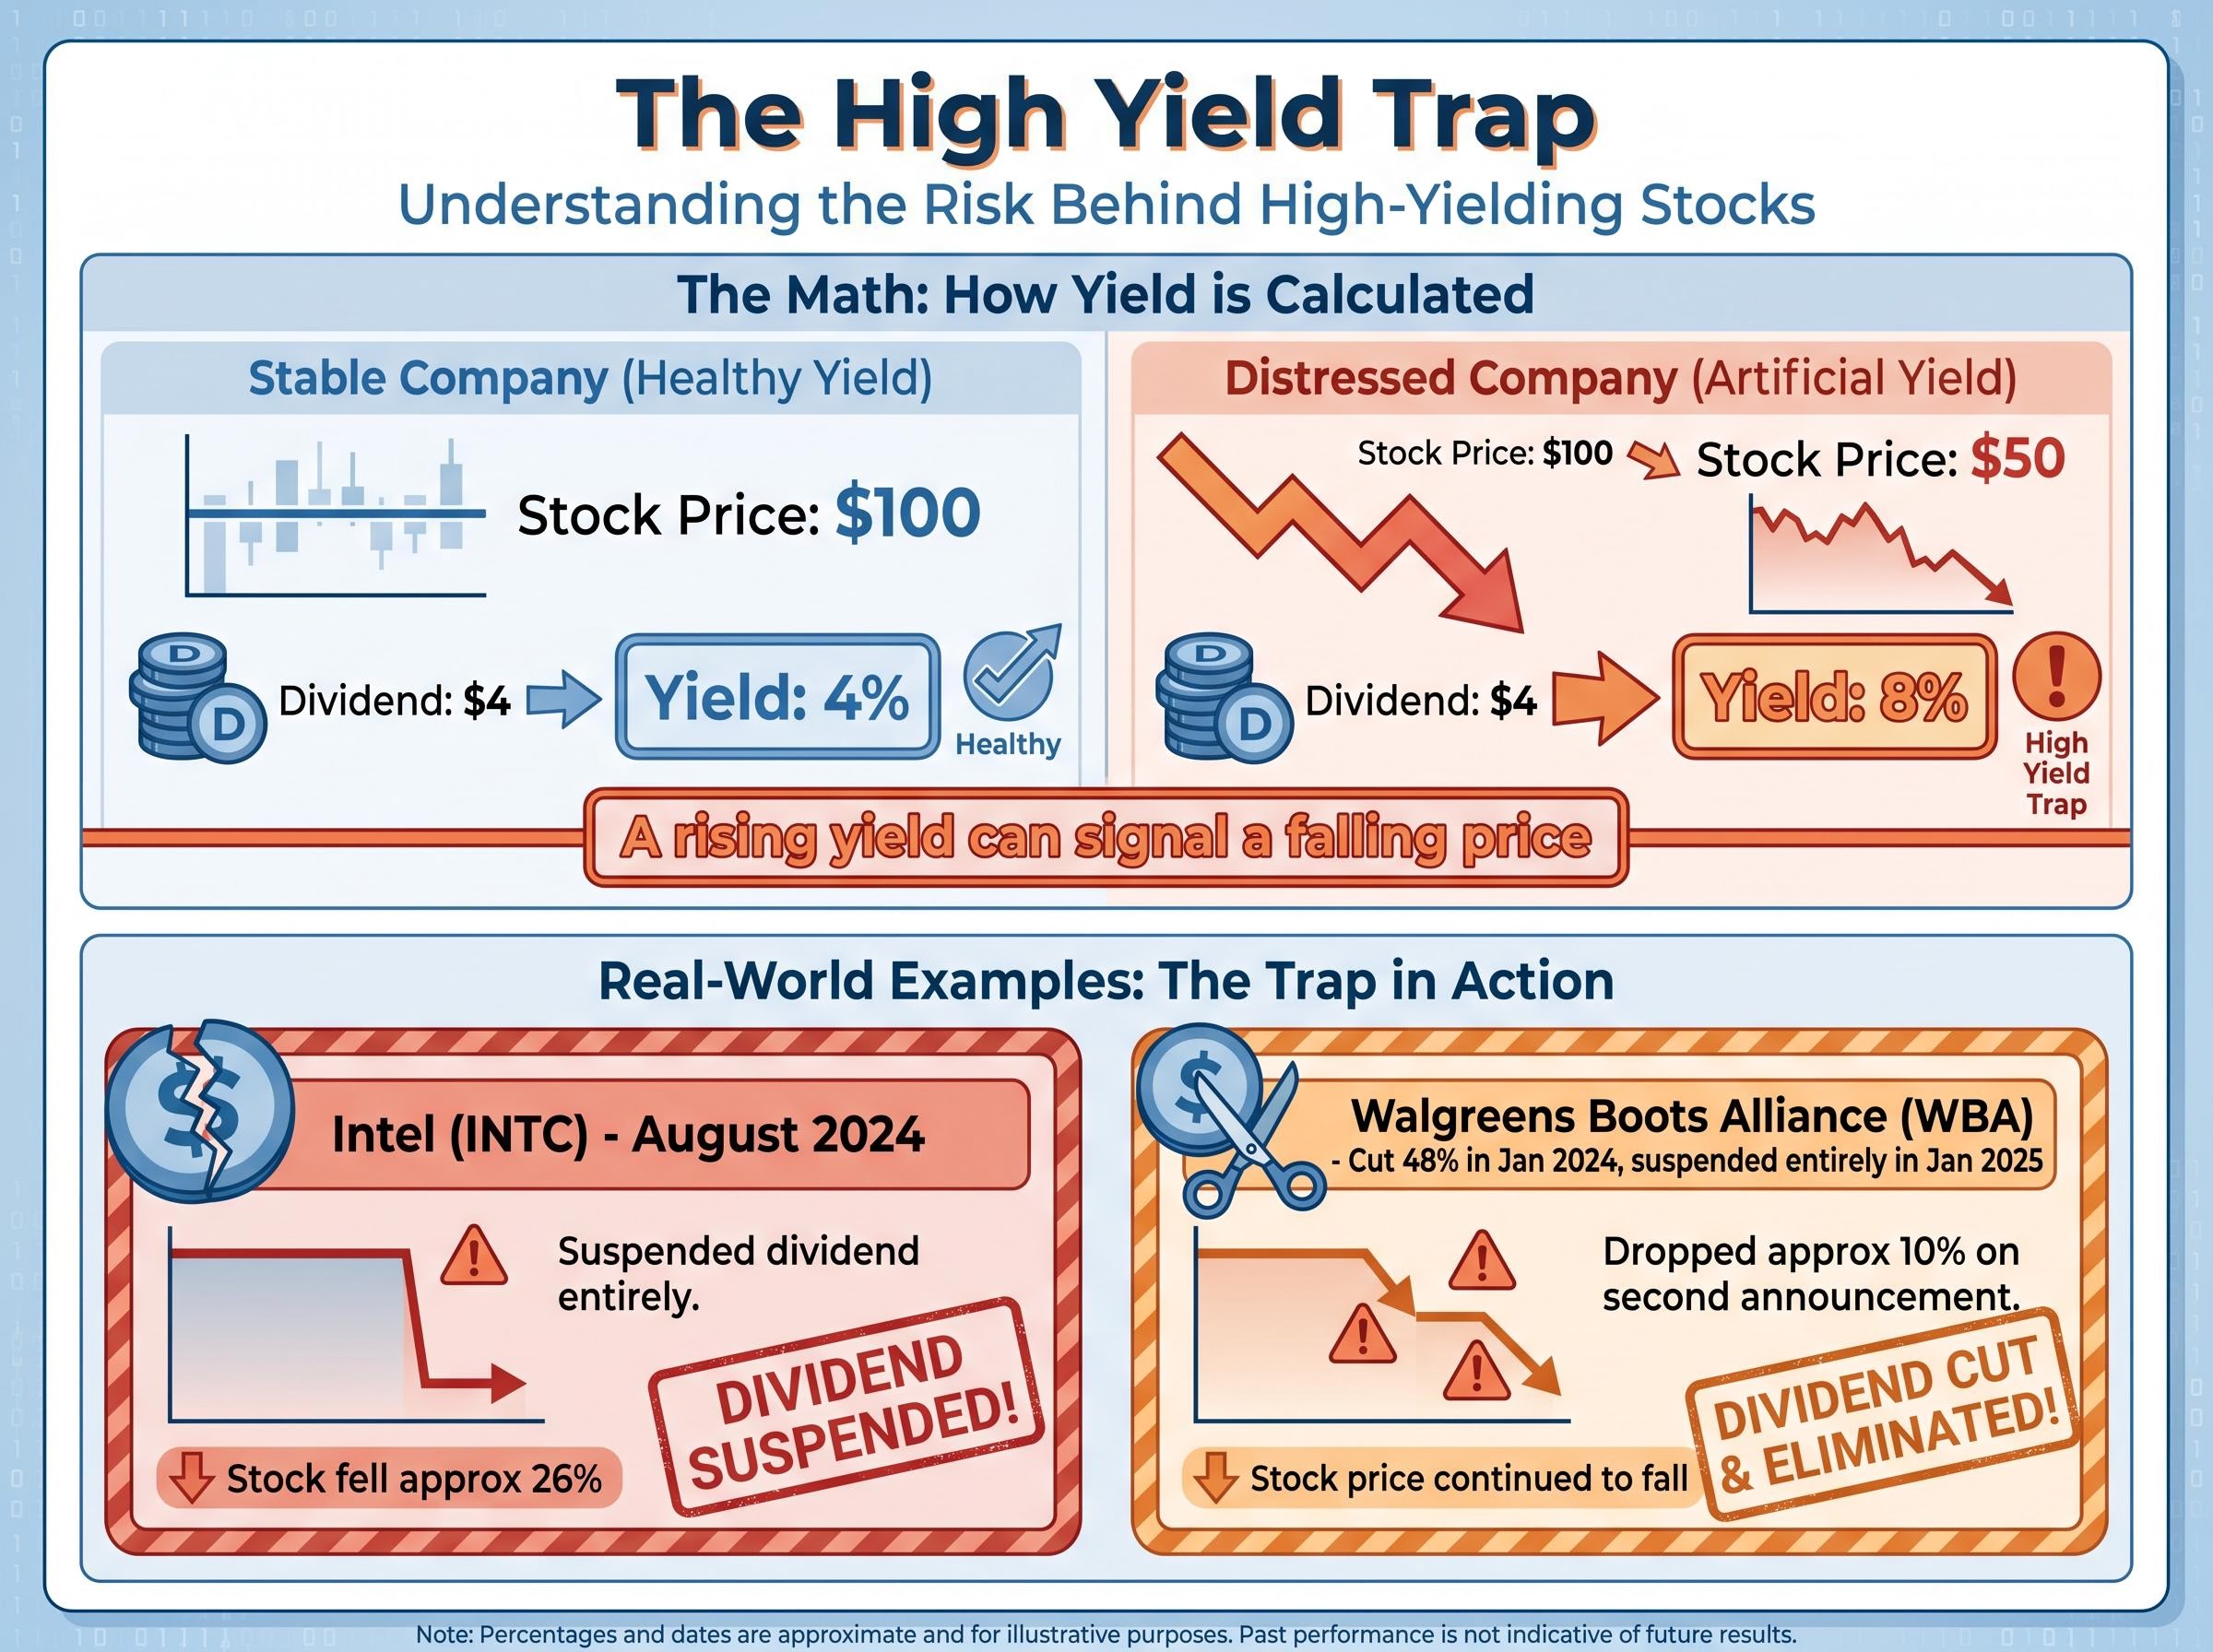
A high yield can reflect two very different situations. The first is a mature, profitable business returning surplus cash to shareholders. The second, and frequently more common, is a falling share price inflating the yield metric. If a stock drops from $100 to $50 while maintaining its $4 annual dividend, the yield doubles from 4% to 8%. The yield looks more attractive precisely because the investment has deteriorated.
| Company | Dividend action | Date | Stock price impact |
|---|---|---|---|
| Intel (INTC) | Suspended dividend entirely | August 2024 | Fell approximately 26% |
| Walgreens Boots Alliance (WBA) | Cut 48% (Jan 2024), then suspended entirely (Jan 2025) | January 2024, January 2025 | Dropped approximately 10% on second announcement |
A high yield can mean a falling price, not a rising payment. The number that looks most attractive may be the one signalling the greatest risk.
There is also a growth-signal interpretation. Companies paying high dividends may be signalling limited confidence in their own reinvestment opportunities, returning cash because they cannot find projects with adequate returns. High-growth companies, particularly in technology, typically retain all earnings for reinvestment and pay no dividend at all.
The S&P 500 overall dividend yield stood at approximately 1.06% as of 8 May 2026, reflecting how low the broad market yields relative to high-yield marketing claims. The MSCI World High-Dividend Yield Index experienced a peak-to-trough decline of approximately -7.6% during the February to March 2026 mini-correction (FactSet, 7 May 2026), compared to the MSCI World Index fall of approximately -8.9% over a slightly wider window. The modest outperformance does not match the “safe haven” narrative. Global equities recovered to all-time highs around mid-April 2026, while high-dividend stocks remained below that threshold and traded sideways for roughly one month after.
The MSCI World High-Dividend Yield Index lagged the broader market recovery through April and May 2026, providing fresh empirical weight to the high-dividend safe haven myth that persists despite the data consistently pointing in the other direction.
Investors who screen primarily by yield end up holding a portfolio that looks remarkably similar regardless of which stocks they select. High-dividend equities cluster disproportionately in three sectors:
A yield-focused portfolio produces significant sector concentration by default. This concentration carries a diversification cost that is invisible to investors focused on yield alone.
Portfolio construction under pressure, particularly the tendency to concentrate in yield-generating sectors during periods of market stress, is a documented pattern: SMSF investors in early 2026 increased cash allocations and reduced equity exposure at precisely the moments when high-dividend marketing was most intense, locking in losses that a rules-based rebalancing framework would have avoided.
The S&P 500 Dividend Aristocrats, companies with 25 or more consecutive years of dividend increases, yield notably more than the broad S&P 500 and carry an implicit quality screen. They nonetheless represent a narrow slice of the market with its own sector biases.
Technology and Communication Services have led cumulative broad market performance over the decade prior to May 2026, according to Fisher Investments research. These sectors tend to pay low or zero dividends. Investors who screen primarily by yield systematically under-participate in the highest-growth areas of the market.
This does not mean dividend stocks are inferior investments. It means that yield as the primary filter produces a systematically skewed sample of the investable universe. An investor who understands this effect can audit their own holdings for unintended sector concentration and adjust accordingly.
Dividends are a value redistribution mechanism, not a source of additional wealth. The investor’s economic position does not improve at the moment of payment. A $1 dividend in the hand is a $1 reduction in the portfolio on the other side of the ledger.
What dividends genuinely offer is a disciplined cash return mechanism, a potential quality signal when sustained over decades, and a practical income stream for investors who require regular cash flow. None of these qualities make dividends “free money.”
The single most actionable takeaway: evaluate any dividend-paying investment on its total return prospects, including the tax treatment of the dividend, before treating yield as a reason to buy. Total return is the measure that captures the full picture. Everything else is mental accounting.
This article is for informational purposes only and should not be considered financial advice. Investors should conduct their own research and consult with financial professionals before making investment decisions.
When a company pays a dividend, the stock price falls by approximately the same amount on the ex-dividend date, so the shareholder receives cash but loses an equivalent portion of portfolio value. The investor's total economic position before tax is unchanged at the moment of payment.
The ex-dividend date is the cutoff after which new buyers do not receive the declared dividend payment. On this date, the stock price adjusts downward by approximately the dividend amount, reflecting the cash leaving the company.
Total return measures price appreciation plus dividends received, and it is the most accurate way to evaluate investment performance. Focusing on dividend yield alone ignores price movement, which can easily wipe out any income received.
A high dividend yield can result from a falling share price rather than a growing dividend payment. For example, if a stock drops from $100 to $50 while maintaining a $4 annual dividend, the yield doubles from 4% to 8%, making a deteriorating investment appear more attractive.
Dividends are taxable in most jurisdictions, reducing their after-tax value below the headline figure. In the US, qualified dividends are taxed at capital gains rates of 0%, 15%, or 20%, while UK additional-rate taxpayers can face rates up to 39.35%, meaning the real income received is always less than the pre-tax amount.