How to Build a Global Portfolio With Two ASX ETFs
1 hr ago

Australian major bank stocks collectively represent over one-third of the ASX 200 by market capitalisation. They sit in almost every superannuation portfolio, every income-focused watchlist, and every conversation about yield. Yet most retail investors who hold them, or are considering buying them, cannot articulate how to determine whether these stocks are cheap, expensive, or fairly priced.
With National Australia Bank (NAB) trading around $39-40 per share in May 2026, a fully franked interim dividend of 85 cents per share just declared, and the banking sector price-to-earnings (PE) ratio sitting at 22.7x (above the three-year average of 17.6x), the question of fair value is immediate and practical.
This guide walks through the two primary valuation methodologies applied to bank shares: the PE ratio approach and the Dividend Discount Model (DDM). Each is constructed step by step using NAB as a live worked example, with a sensitivity analysis that shows how to interpret the output range rather than fixate on a single number. The same framework applies to Commonwealth Bank, ANZ, or Westpac with minimal adaptation.
Most investors treat bank stocks as straightforward. The dividends are reliable, the brands are familiar, and the share prices tend to move in a narrow range. That familiarity creates a dangerous assumption: that banks can be valued with the same tools applied to a retailer or a technology company.
They cannot. A bank’s earnings are driven primarily by its net interest margin, the difference between what it charges borrowers and what it pays depositors. Credit provisioning (the money set aside for loans that may not be repaid) can swing reported profit by hundreds of millions in a single half-year, even when the underlying business has not changed. The loan book itself is a leveraged asset that behaves nothing like inventory or intellectual property. Standard discounted cash flow models built for industrial companies struggle to account for these dynamics.
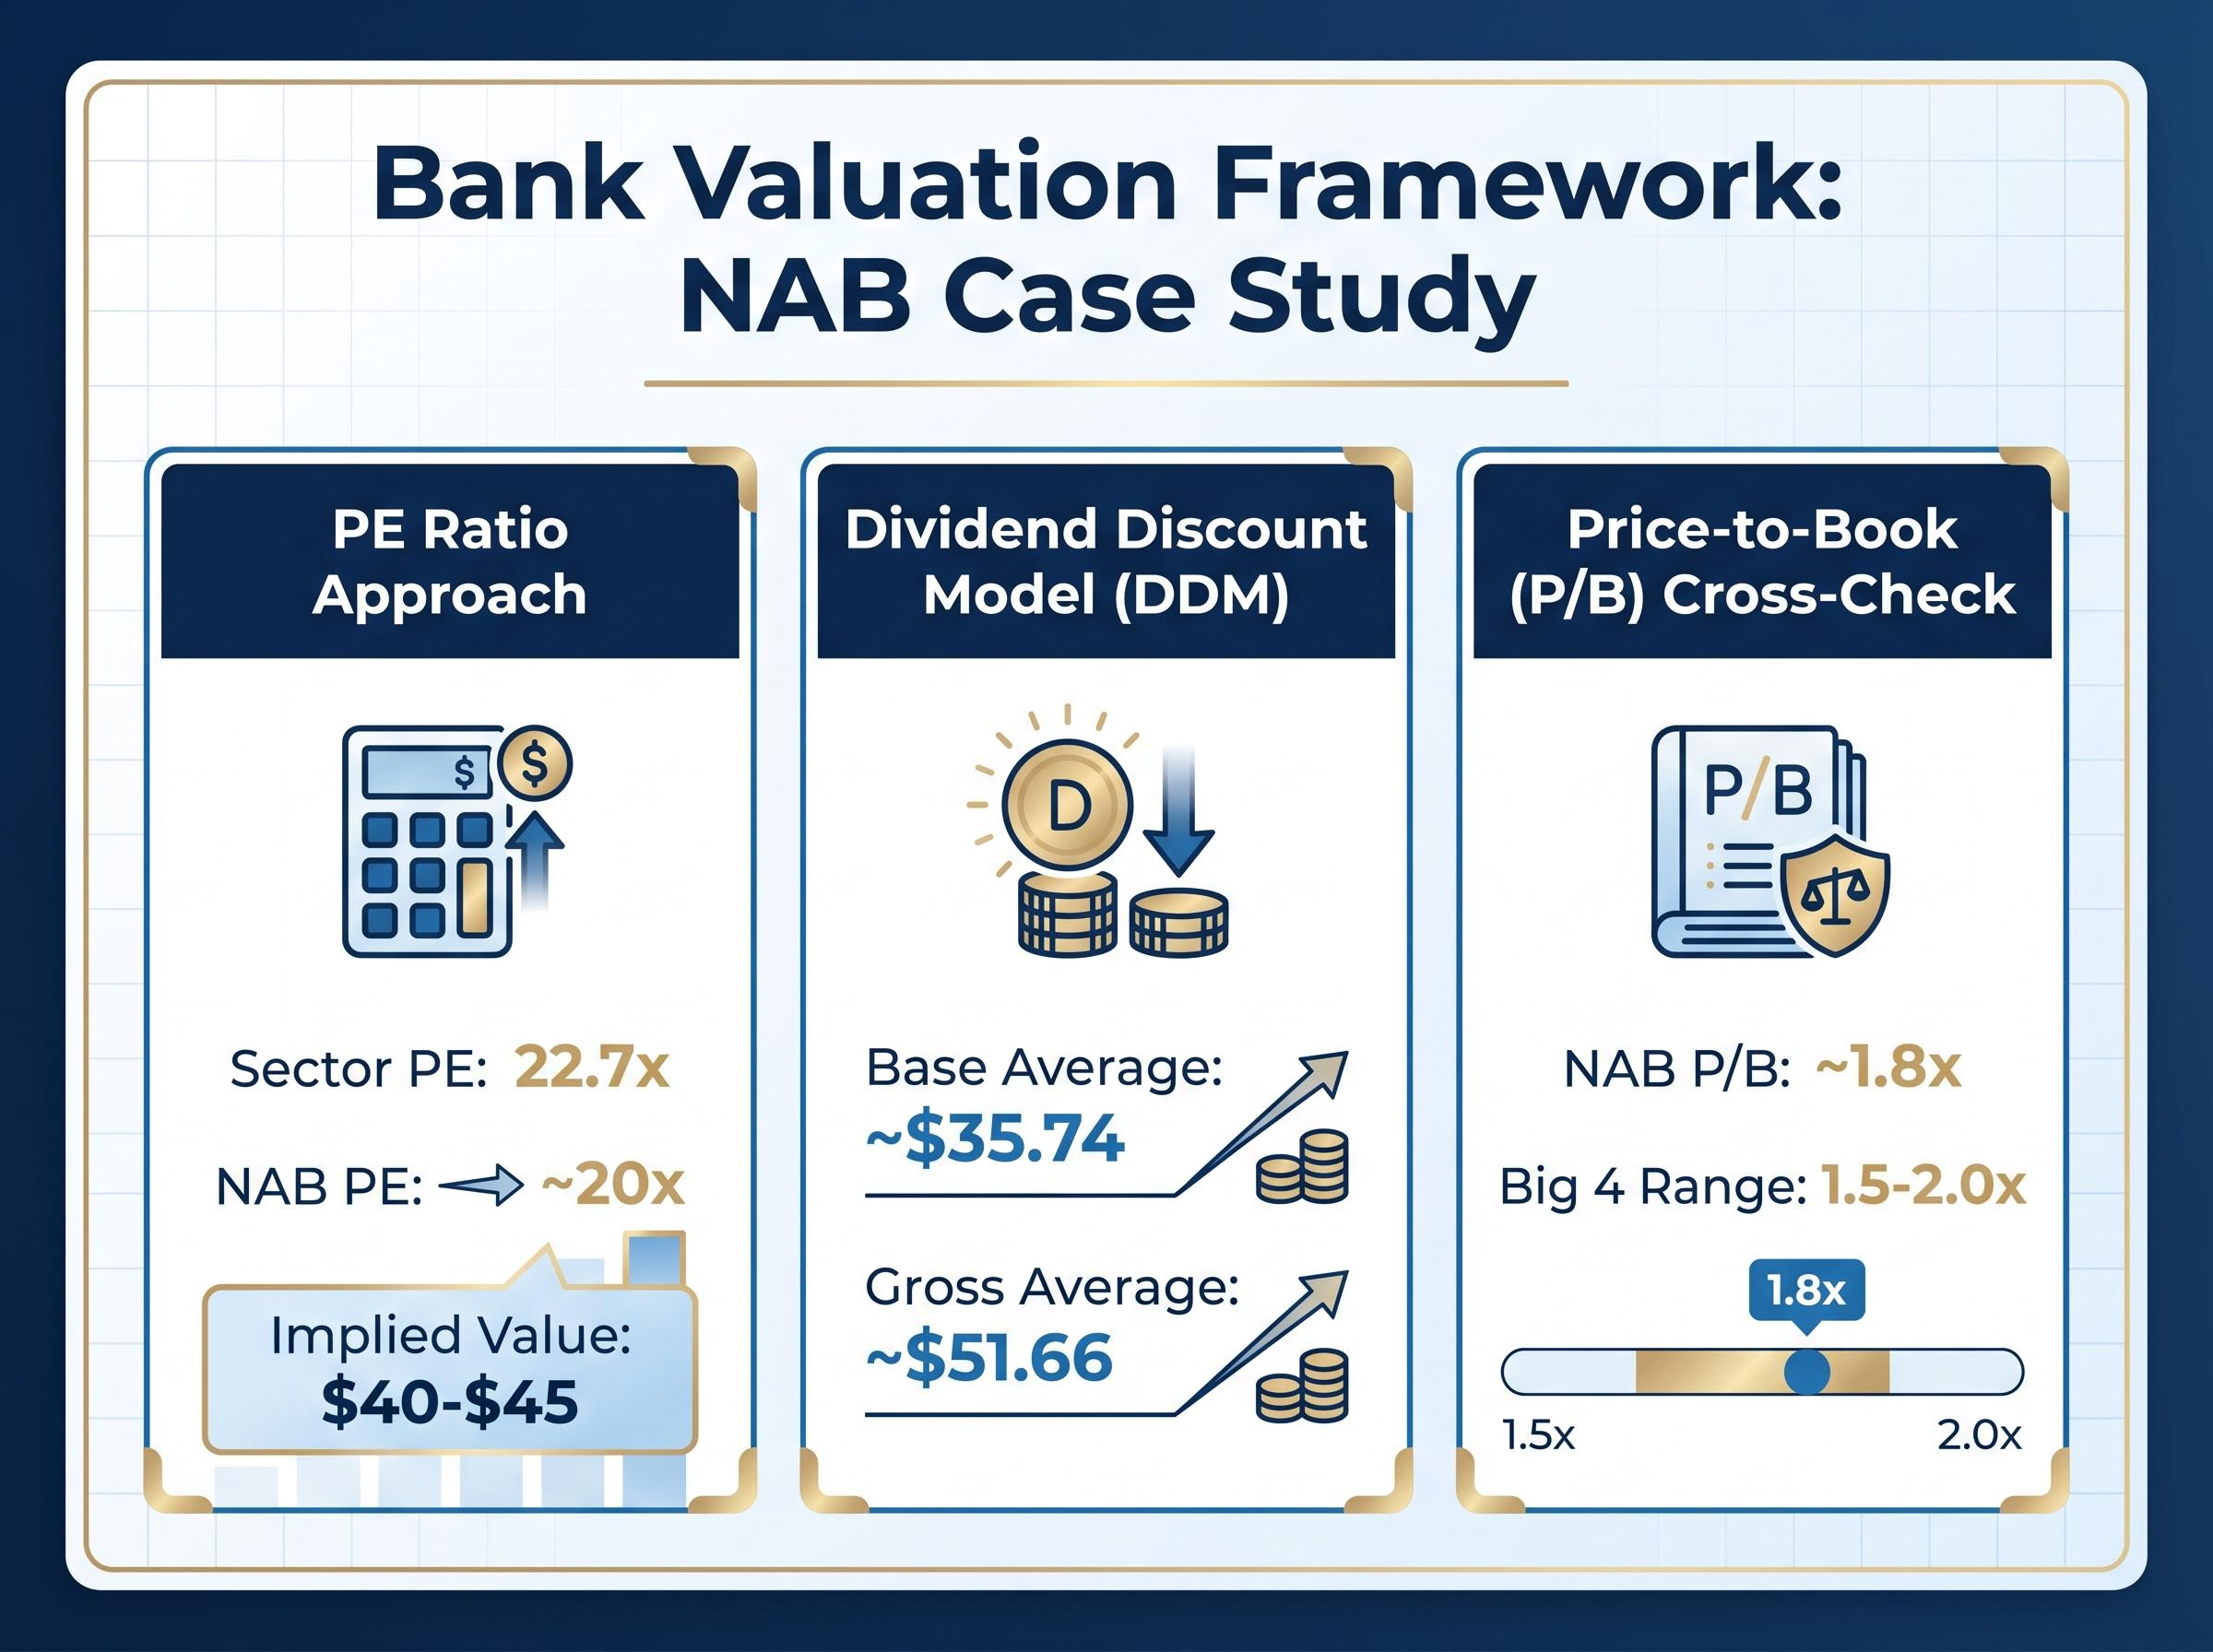
Australian major banks collectively represent over one-third of the ASX 200 by market capitalisation, making this a material literacy gap for most local equity investors. The sector PE of 22.7x is well above the three-year average of 17.6x, and NAB specifically trades at approximately 1.8x price-to-book, within the big four range of 1.5-2.0x. Whether those multiples signal overvaluation or a structural re-rating depends entirely on which valuation tool is applied and how its output is interpreted.
No valuation model produces a guaranteed result. The outputs are estimates to be stress-tested, not price targets to be acted on mechanically.
PE and DDM are the primary focus of this guide. P/B is introduced as a cross-check only.
A PE ratio measures how many dollars the market is paying for each dollar of a company’s annual earnings. The calculation is straightforward:
PE Ratio = Share Price ÷ Earnings Per Share (EPS)
If a bank’s share price is $40 and its EPS is $2.00, the PE ratio is 20x. The market is paying $20 for every $1 of annual profit.
The question is what to do with that number. There are three approaches, each offering a different level of insight:
PE ratio, EPS, and price-to-book sit within a broader set of fundamental analysis metrics that work together to build a picture of a company’s financial health; understanding how each one answers a different diagnostic question is the prerequisite for using any single multiple with confidence.
For NAB, the FY24 EPS is approximately $2.00. The table below shows how implied fair value shifts depending on which PE multiple is applied.
| Metric | NAB (Current PE) | Sector Average PE |
|---|---|---|
| PE Multiple | ~20x | 22.7x |
| EPS (FY24) | $2.00 | $2.00 |
| Implied Fair Value | ~$40 | ~$45 |
At its own PE of approximately 20x, NAB’s implied fair value is roughly $40, consistent with the current trading range. At the sector average of 22.7x, the implied value rises to approximately $45, suggesting modest undervaluation relative to peers.
Earnings cyclicality and credit provisioning variability make isolated PE readings unreliable for banks. A single quarter of elevated provisioning can compress EPS and inflate the PE ratio without any change to the bank’s underlying earning power. Peer-relative comparison is the more dependable application: it answers the question “is this bank cheaper or more expensive than its peers?” rather than “is this bank cheap in absolute terms?”
The DDM values a stock based on the income stream it pays to shareholders, discounted to reflect the return an investor requires for holding the stock. The formula is:
DDM Fair Value = Annual Dividend ÷ (Required Return – Dividend Growth Rate)
Each input is concrete and traceable. Here is how to build the model for NAB:
The mechanism behind how franking credits reduce tax liability is straightforward in principle but has meaningful variation across investor types: SMSFs in pension phase receive the credit as a full cash refund from the ATO, while investors on the top marginal rate receive a smaller effective benefit, which is precisely why the grossed-up DDM output shifts so materially depending on whose tax position is assumed.
The ATO franking credits refund rules establish the eligibility conditions under which Australian resident taxpayers can claim the tax offset attached to fully franked dividends, including the 45-day holding period requirement that directly affects whether investors receive the full grossed-up benefit modelled in the DDM calculation above.
The sensitivity table below shows how fair value shifts across different combinations of risk rate and growth rate, for both the base dividend and the gross dividend inclusive of franking credits.
| Risk Rate / Growth | 2% Growth (Base) | 4% Growth (Base) | 2% Growth (Gross) | 4% Growth (Gross) |
|---|---|---|---|---|
| 6% | $42.50 | $85.00 | $61.00 | $122.00 |
| 8% | $28.33 | $42.50 | $40.67 | $61.00 |
| 11% | $18.89 | $24.29 | $27.11 | $34.86 |
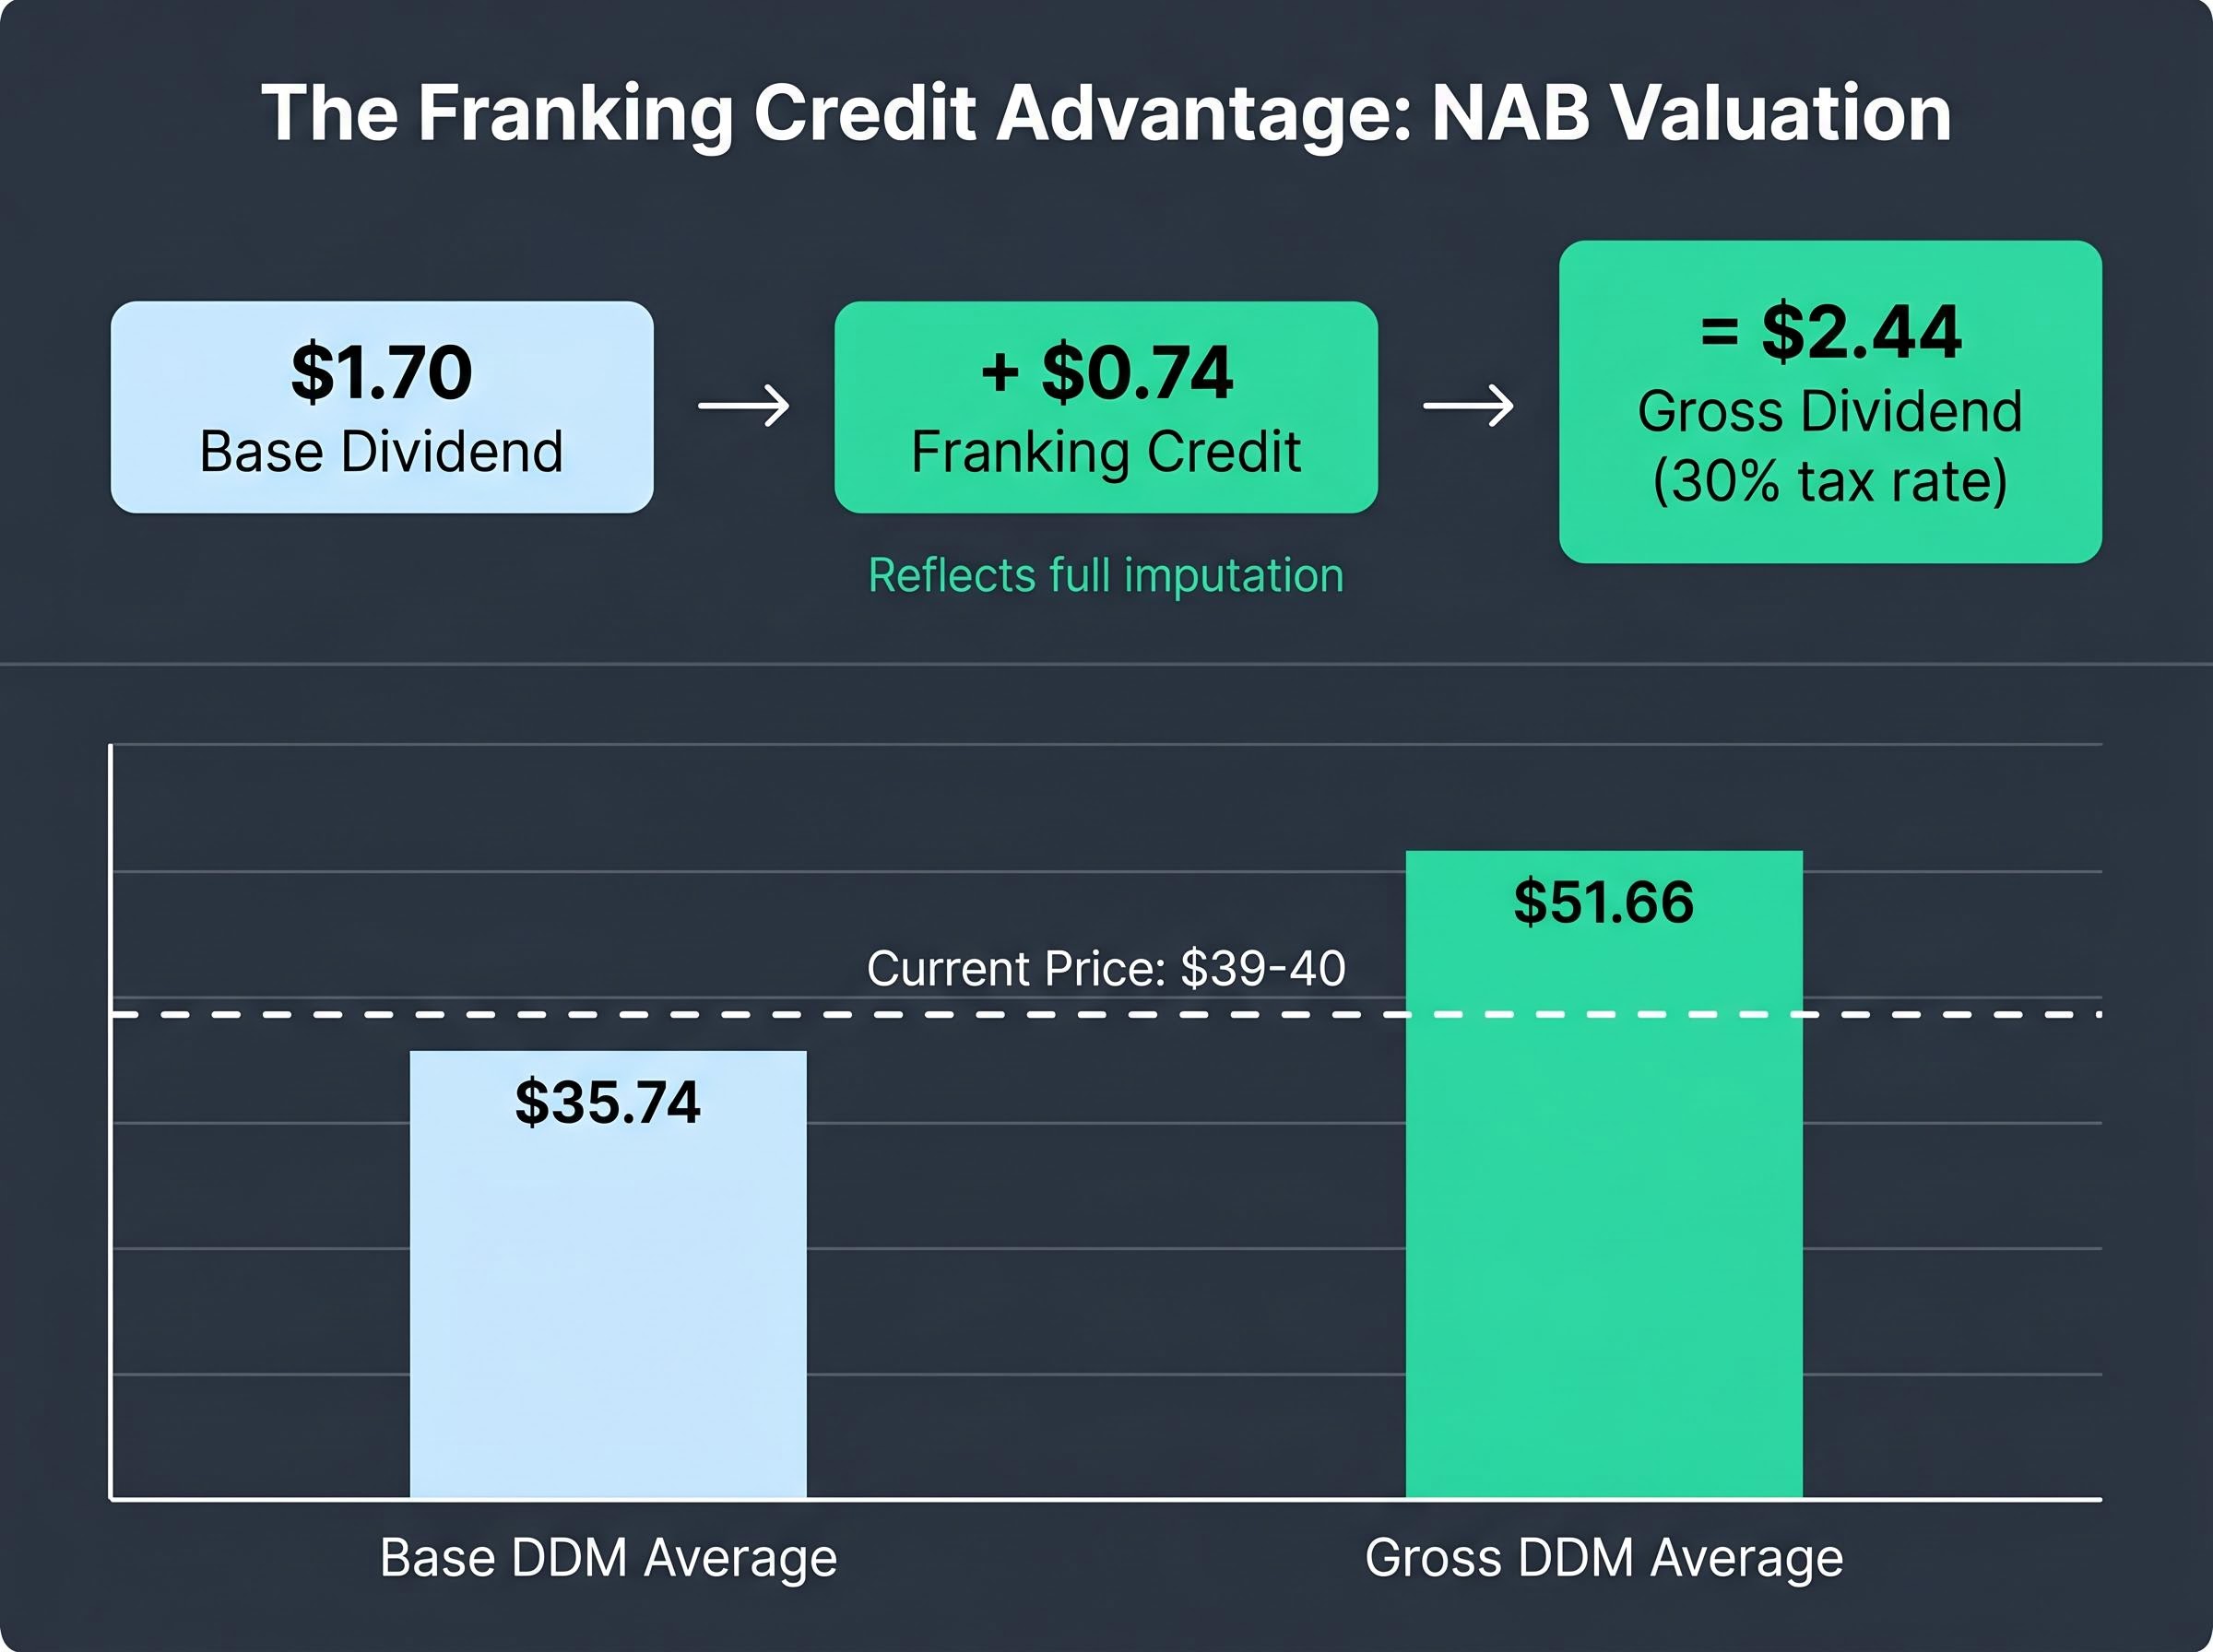
The blended average across these scenarios is approximately $35.74 per share using the base dividend and approximately $51.66 using the gross dividend with franking credits. The wide range is not a flaw; it reflects the model’s sensitivity to assumptions, which is precisely why the next section matters.
The DDM sensitivity table produces outputs ranging from approximately $19 per share to over $85 per share. That range may look like the model is broken. It is not. It is doing exactly what it should: showing how heavily the fair value estimate depends on the required return and growth assumptions chosen.
A lower required return and higher growth rate produce optimistic valuations. A higher required return and lower growth rate produce conservative ones. No single cell in that table is “correct.” The range itself is the output.
To extract a usable estimate, average across the full matrix of scenarios. For NAB, the blended averages are approximately $35.74 (base dividend) and $51.66 (gross dividend with franking credits). The current share price of $39-40 sits between these two figures, above the base-case average but well below the franking-adjusted average. For Australian resident taxpayers who capture the full franking benefit, the income case appears stronger than the capital growth case at current prices.
Big four bank dividend sustainability is not uniform across the sector: ANZ and Westpac carry payout ratios above their own stated target ranges, while NAB’s grossed-up yield of approximately 6.06% leads the peer group, a divergence that matters when DDM inputs assume a stable long-run payout trajectory across any of the four names.
No single model should carry the entire weight of a valuation judgment. The value of running both PE and DDM analyses, alongside a P/B cross-check, is that each model uses different inputs and captures different dimensions of value. When multiple models converge on a similar range, the estimate becomes more defensible.
The three approaches together bracket NAB’s current share price in a way that is broadly consistent with fair value rather than clear over- or undervaluation.
A PE ratio uses historical earnings. A DDM uses the current dividend. Neither captures the forward-looking variables that will determine whether those inputs hold, improve, or deteriorate.
Four factors sit outside the models and require ongoing monitoring:
A thorough assessment of any bank share requires examination of growth strategy, macroeconomic conditions, and management quality beyond what valuation models alone can capture.
A six-month-old DDM output is not a standing price target. It is a snapshot based on assumptions that may have already shifted. The discipline lies in knowing when to re-run the model with updated inputs.
The NAB case study above can be condensed into a five-step process that works for CBA, ANZ, or Westpac with no structural change:
Suggested data sources for each input include company investor relations pages, ASX announcements, and financial data platforms such as Motley Fool Australia, Morningstar, and SimplyWallSt for comparative PE and dividend data.
| Method | Key Input | NAB Example | Output Signal |
|---|---|---|---|
| PE Ratio | EPS | ~$2.00 (FY24) | Fair value $40-$45 depending on multiple |
| DDM (Base) | Annualised dividend | $1.70 | Blended average ~$35.74 |
| DDM (Gross) | Franking-adjusted dividend | $2.44 | Blended average ~$51.66 |
| P/B Cross-check | Book value per share | ~1.8x | Within big four range of 1.5-2.0x |
An investor who works through this framework for one big four bank can apply the identical process to the other three within an hour, creating a consistent basis for comparing relative value across the sector.
Investors who have worked through the NAB valuation framework and want to extend it to portfolio construction will find our full explainer on building an ASX income portfolio covers payout ratio screening, ex-dividend date sequencing, DRP compounding mechanics, and how to diversify across sector buckets to reduce concentration risk in the big four.
The combined PE and DDM analysis suggests NAB is trading broadly in line with fair value at $39-40 per share. The PE-implied range of $40-$45 and the franking-adjusted DDM average of approximately $51.66 bracket the current price, while the base DDM average of $35.74 sits modestly below it. The annual dividend yield of 4.25%, fully franked, offers a materially higher grossed-up yield for resident taxpayers, reinforcing that the income case is stronger than the capital growth case at current levels.
Three takeaways from the NAB case study:
The next step after establishing a valuation range is to assess whether the business fundamentals, including earnings trajectory, dividend sustainability, and macroeconomic conditions, support the assumptions embedded in the model. A valuation range tells an investor where the price sits relative to the models’ outputs. What happens next requires judgment the models cannot provide.
This article is for informational purposes only and should not be considered financial advice. Investors should conduct their own research and consult with financial professionals before making investment decisions. Past performance does not guarantee future results. Financial projections are subject to market conditions and various risk factors.
The Dividend Discount Model (DDM) values a stock based on the income stream it pays to shareholders, discounted by the return an investor requires for holding the stock. For Australian bank shares, the formula is: fair value equals the annual dividend divided by the difference between the required return and the dividend growth rate, with a grossed-up version that includes franking credits producing materially higher fair value estimates.
Divide the current share price by the bank's earnings per share (EPS) to get the PE ratio. For NAB, a share price of around $40 divided by an EPS of approximately $2.00 produces a PE of roughly 20x, which can then be compared against the banking sector average of 22.7x or the three-year average of 17.6x to assess relative pricing.
Franking credits represent tax already paid by the company, and Australian resident taxpayers can use them to offset their own tax liability, with SMSFs in pension phase receiving the credit as a full cash refund. Including franking credits in the DDM calculation raises the effective annual dividend from $1.70 to approximately $2.44 per share, shifting the blended fair value average from roughly $35.74 to approximately $51.66.
The big four Australian banks (NAB, CBA, ANZ, and Westpac) typically trade within a price-to-book range of 1.5x to 2.0x, with NAB currently sitting at approximately 1.8x, placing it within the sector norm rather than at an extreme of cheap or stretched.
The five-step framework covers sourcing the latest EPS and dividend data from investor relations pages, calculating a PE ratio and comparing it to the sector average, building a DDM sensitivity table using both the cash dividend and the franking-adjusted gross dividend, cross-checking with the price-to-book ratio, and then synthesising all three outputs to see where the current share price sits relative to each model's implied range.