VGS Leads Vanguard ETF Pack With 14% FY26 Capital Return
2 hrs ago

Around 65% of new Australian retail investors are now building portfolios with fewer than five ETFs. That is not a sign of corner-cutting. It is a sign that the case for simple, low-cost index investing has moved from theory to practice. The Australian ETF market now holds more than $220 billion in assets, and the three-fund combination examined here, VAS, VGS, and NDQ, has become the structure most commonly cited by Australian retail ETF investors in 2025 and 2026. This guide walks through why each of those three funds earns its place in an ASX ETF portfolio, how to allocate across them for different risk profiles, what Australian tax considerations apply, and how to place a first order on the ASX.
The Betashares annual ETF industry review for 2025 recorded total funds under management reaching $330.6 billion with net flows of $53 billion for the year, figures that contextualise why the three-fund structures favoured by retail investors have attracted sustained attention from both new and experienced market participants.
The instinct to invest domestically makes sense. Australian investors know Australian companies, earn income in Australian dollars, and benefit from franking credits on local dividends. The problem is structural.
The ASX is dominated by two sectors. Financials account for 32% of the VAS index and materials for 20%. That means more than half of a purely domestic equity allocation sits in just two industries. The concentration sharpens further at the top: Commonwealth Bank (8.9%), BHP (7.2%), CSL (6.1%), Westpac (4.8%), and NAB (4.2%) collectively represent more than 31% of the index. Owning “the Australian market” is, in practice, a large bet on banks and miners.
ASX wealth concentration data from Morningstar Australia reinforces this structural argument: only 36% of large-cap Australian stocks outperformed the ASX 300 over 15 years, and a single company, Pro Medicus, generated 27% of all wealth created across the 210-stock dataset, a distribution so skewed that most stock pickers statistically cannot replicate it.
What is missing matters just as much. Entire industries generating wealth globally are either absent or severely underrepresented on the ASX:
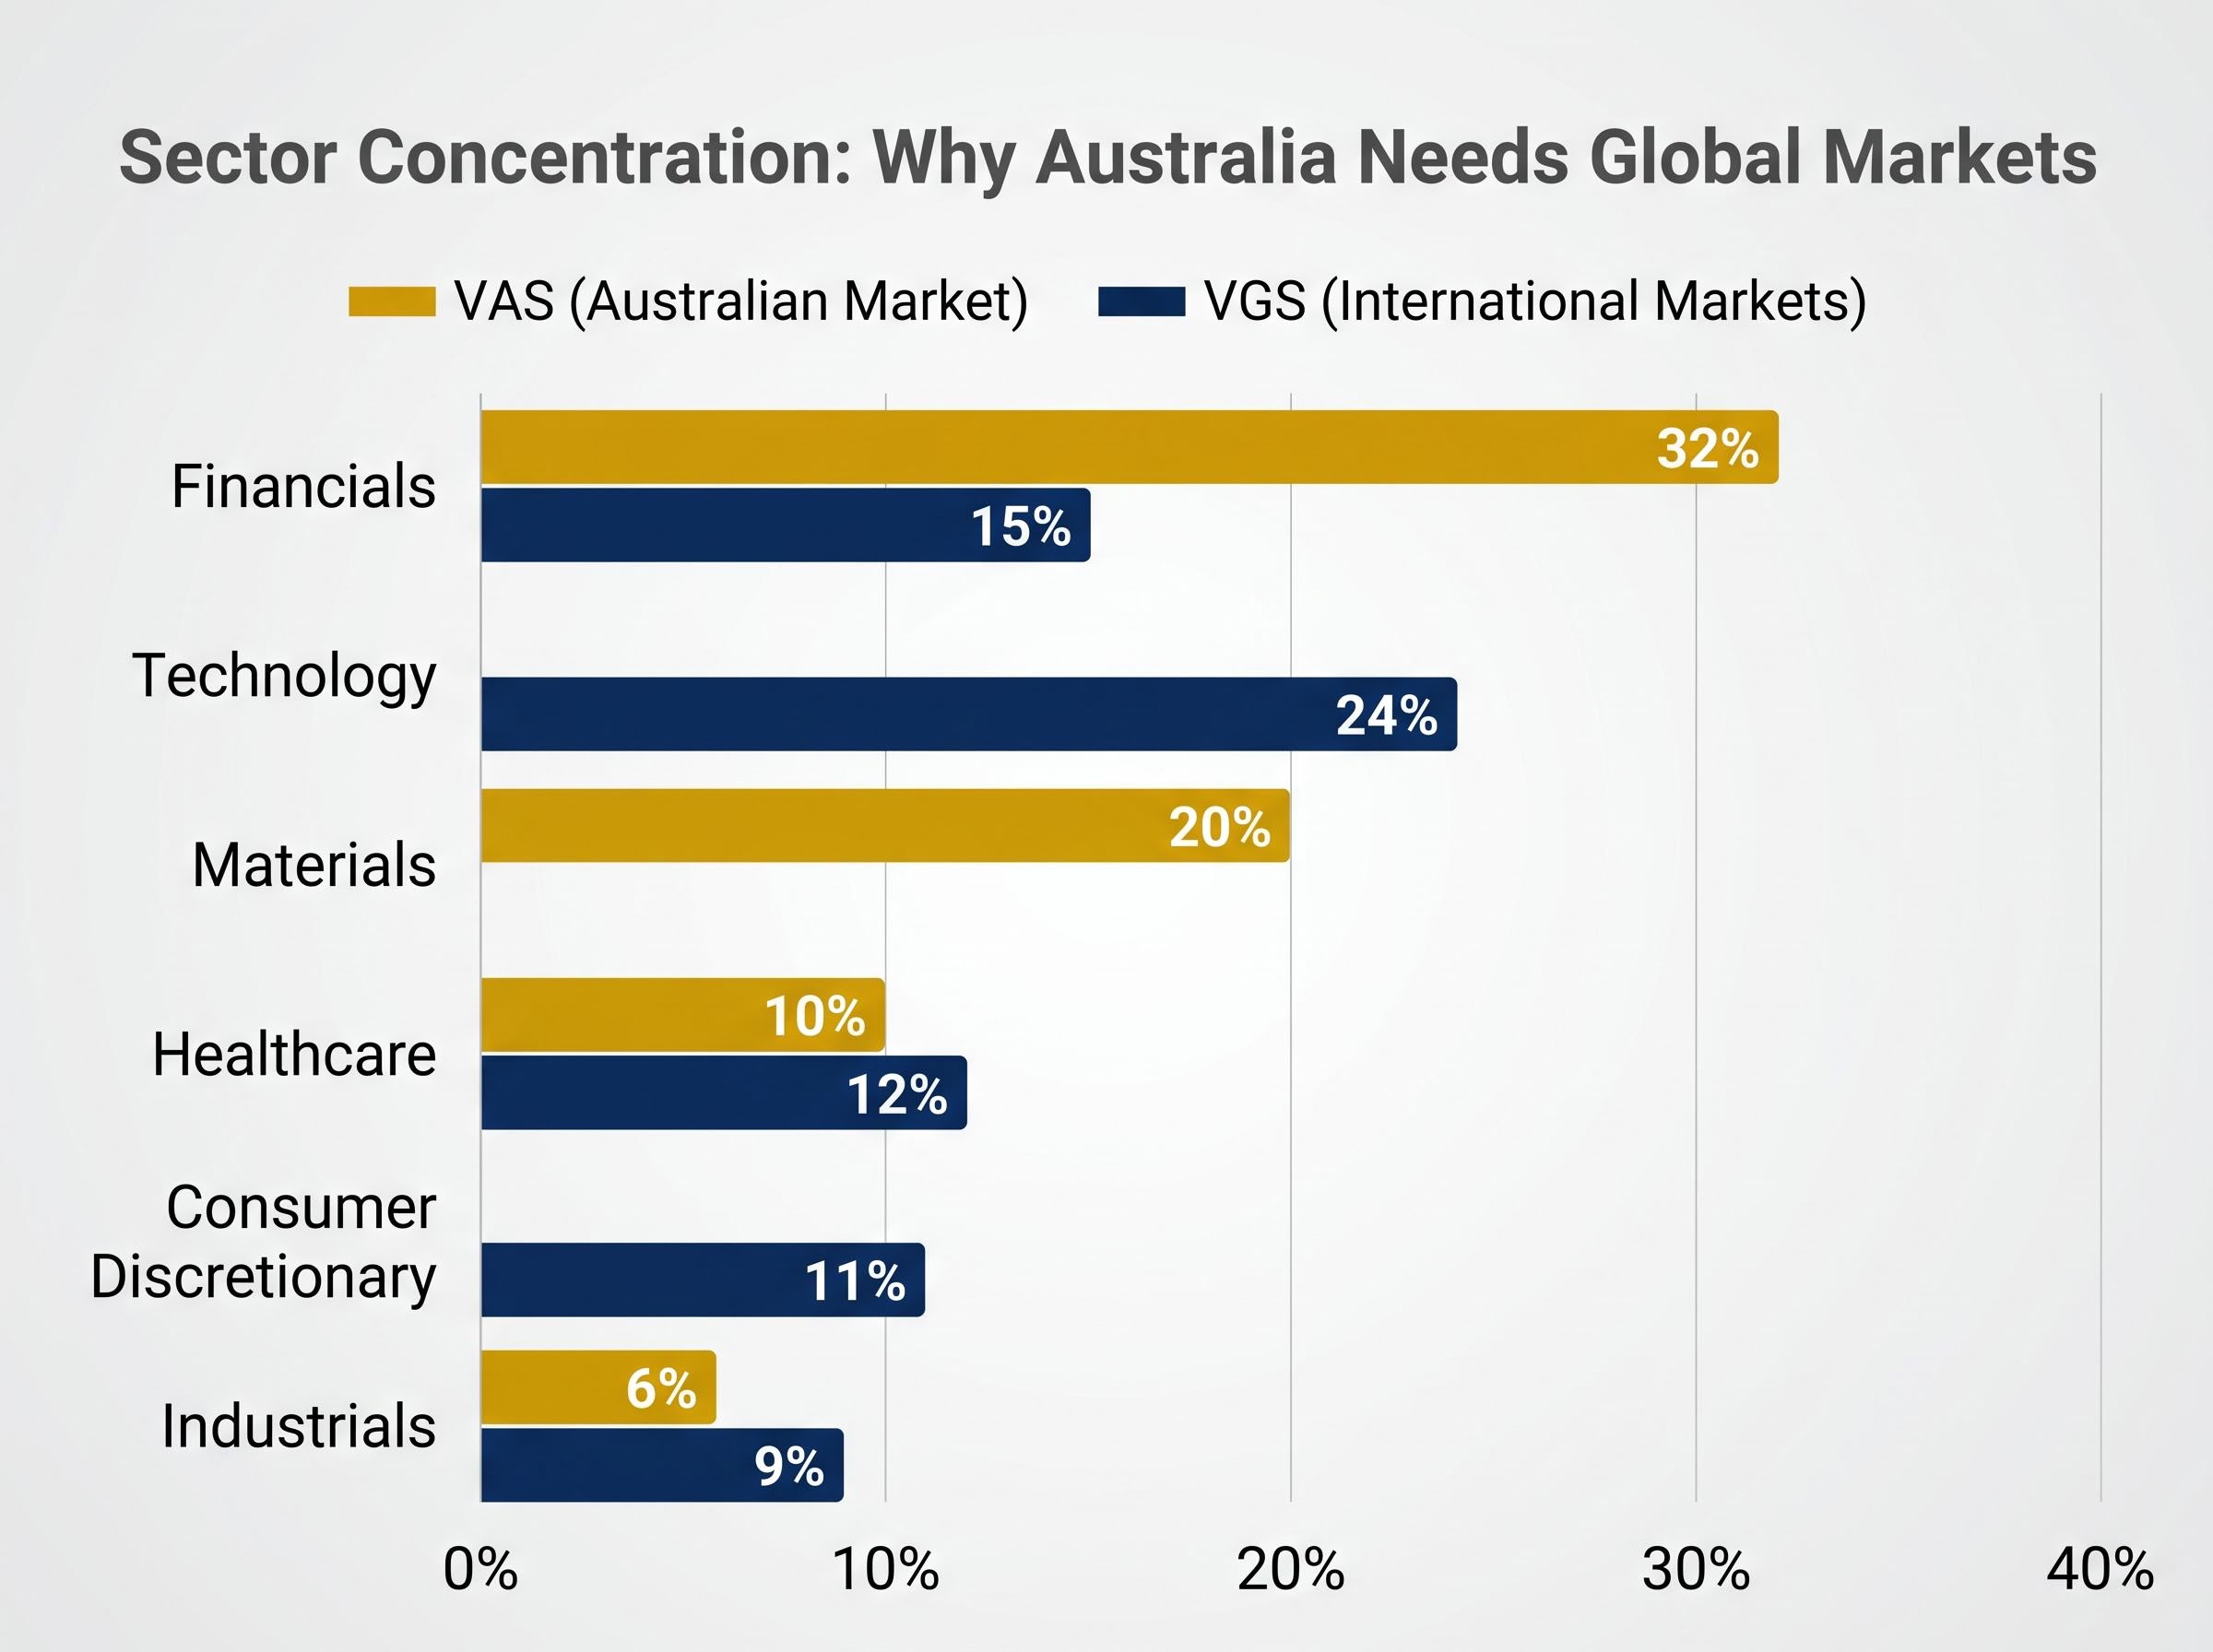
Compare that with VGS, which tracks developed international markets. Its sector mix reads differently: Technology 24%, Financials 15%, Healthcare 12%, Consumer Discretionary 11%. Its geographic spread, with the US at 72%, Japan 6%, UK 4%, Canada 3%, and France 2%, delivers exposure to economies and sectors the ASX structurally cannot provide.
| Sector | VAS weighting | VGS weighting |
|---|---|---|
| Financials | 32% | 15% |
| Materials | 20% | — |
| Technology | — | 24% |
| Healthcare | 10% | 12% |
| Consumer Discretionary | — | 11% |
| Industrials | 6% | 9% |
The three-ETF approach is not a convenience shortcut. It is a structural response to the concentration limits of the Australian market.
Each fund in this portfolio has a distinct job. Understanding those roles converts three ticker codes into a system.
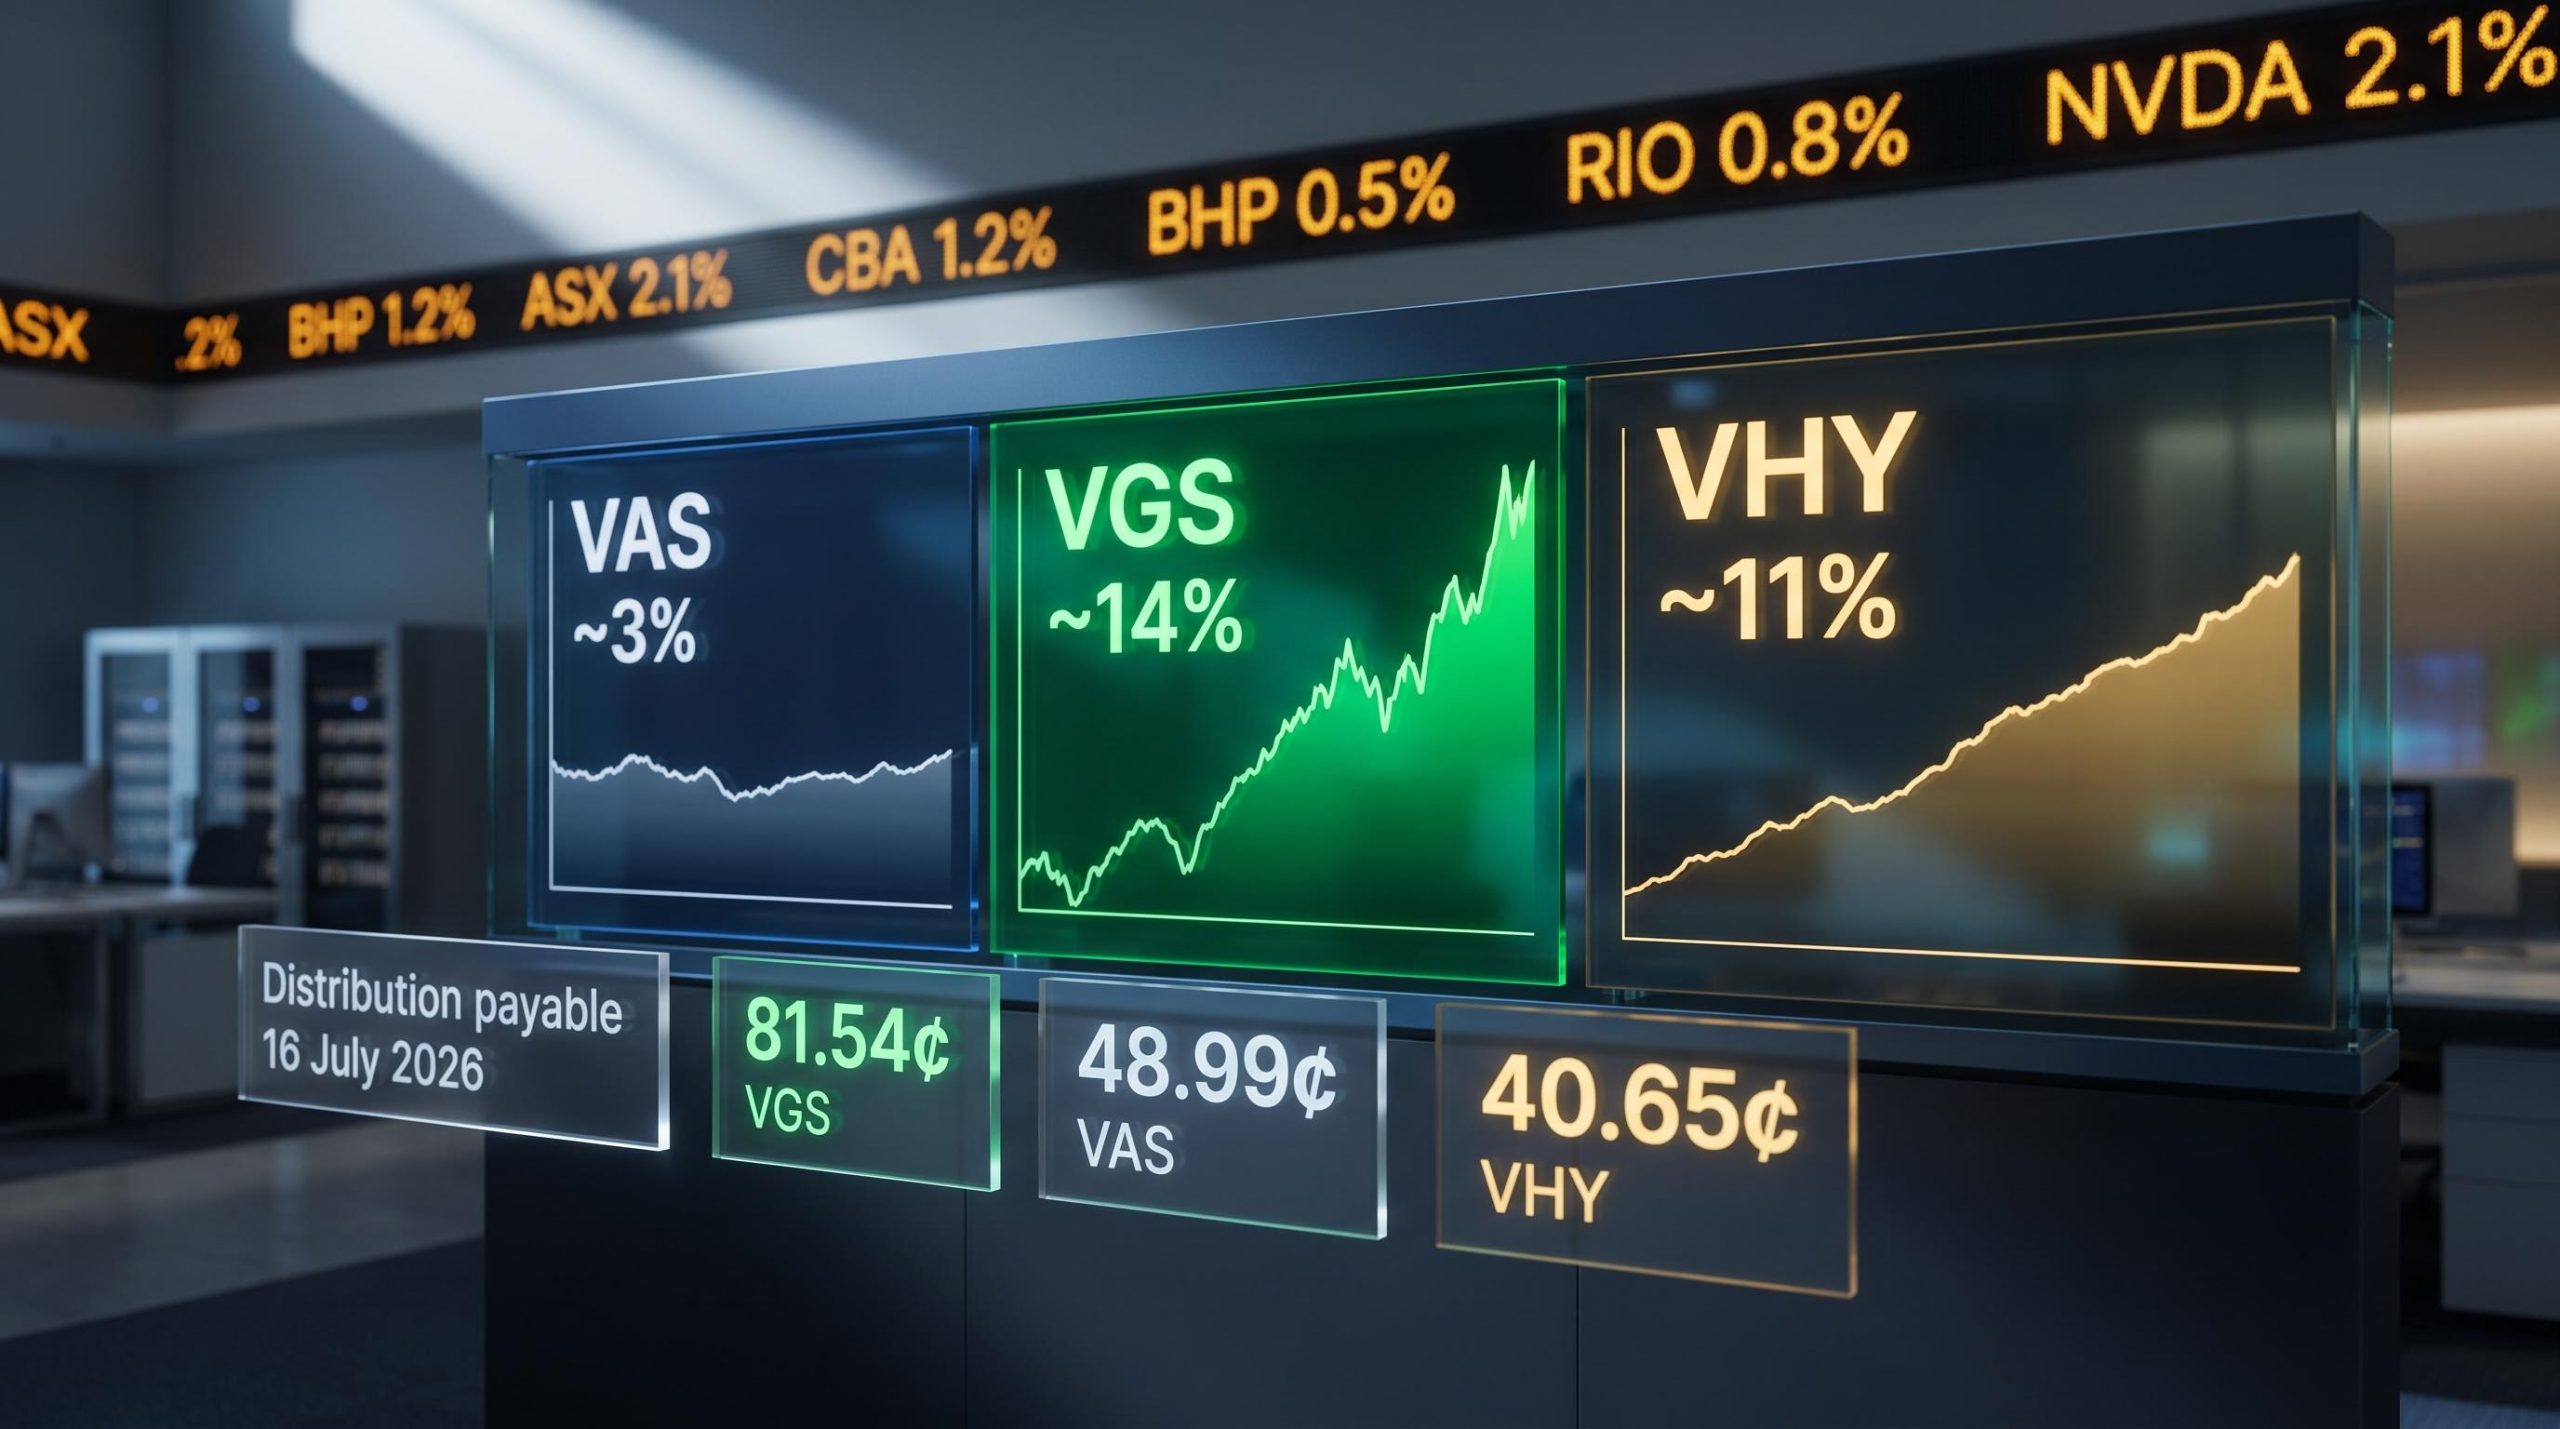
VAS is the income and stability anchor. It holds 300 Australian stocks, charges a management expense ratio (MER) of just 0.07%, and carries a 12-month trailing yield of 3.92%. That yield, often enhanced by franking credits, makes VAS the portfolio’s primary income generator. Its five-year annualised return of 11.7% reflects the steady, dividend-rich character of the Australian market.
VGS is the diversification engine. With 1,532 holdings spanning developed markets outside Australia, it delivers the sector breadth and geographic reach that VAS cannot. Its MER of 0.18% buys access to companies such as Apple, Microsoft, Nvidia, and Eli Lilly across 22 countries. Its five-year annualised return of 13.9% has outpaced VAS, driven by technology and healthcare exposure. The trailing yield of 1.45% is lower, reflecting VGS’s growth orientation.
NDQ is the deliberate growth tilt. This concentrated 100-stock exposure to the Nasdaq tracks the dominant names in technology and innovation: Nvidia (8.7%), Apple (7.1%), Microsoft (5.3%). Information Technology alone accounts for 53.7% of the fund, with Communication Services adding another 15.1%. The five-year annualised return of 16.51% is the highest of the three, but the MER of 0.48% and the concentration in a single sector make it a higher-risk satellite, not a core holding.
NDQ’s volatility profile became concrete in early 2026 when the fund posted a 3-month return of negative 8.43% to March, a drawdown that followed years of outsized gains and reminded investors that the fund’s 10-year annualised return of nearly 20% has been earned through periods of significant short-term pain.
On fees: VAS’s 0.07% MER is among the lowest available on the ASX. On a $1,000 holding, that represents approximately 70 cents per year. VGS at 0.18% and NDQ at 0.48% cost more, but each fee reflects the cost of accessing markets an Australian investor would otherwise struggle to reach efficiently.
| ETF | Portfolio role | MER | Holdings | 5-year return (annualised) |
|---|---|---|---|---|
| VAS | Income and stability anchor | 0.07% | 300 | 11.7% |
| VGS | Diversification engine | 0.18% | 1,532 | 13.9% |
| NDQ | Growth tilt (satellite) | 0.48% | 100 | 16.51% |
The most commonly referenced allocation model in Australian retail ETF commentary is 40% VAS, 40% VGS, 20% NDQ. The logic is straightforward: equal weighting between the domestic core (VAS) and the international core (VGS), with a smaller growth satellite (NDQ) adding a deliberate tilt toward technology-driven returns.
This split has become the default reference point in 2025-2026 discussion, and it provides a balanced exposure to Australian income, developed-market diversification, and Nasdaq-led growth. It is a starting point, not a mandate.
Three factors should shape how an investor deviates from the 40/40/20 base:
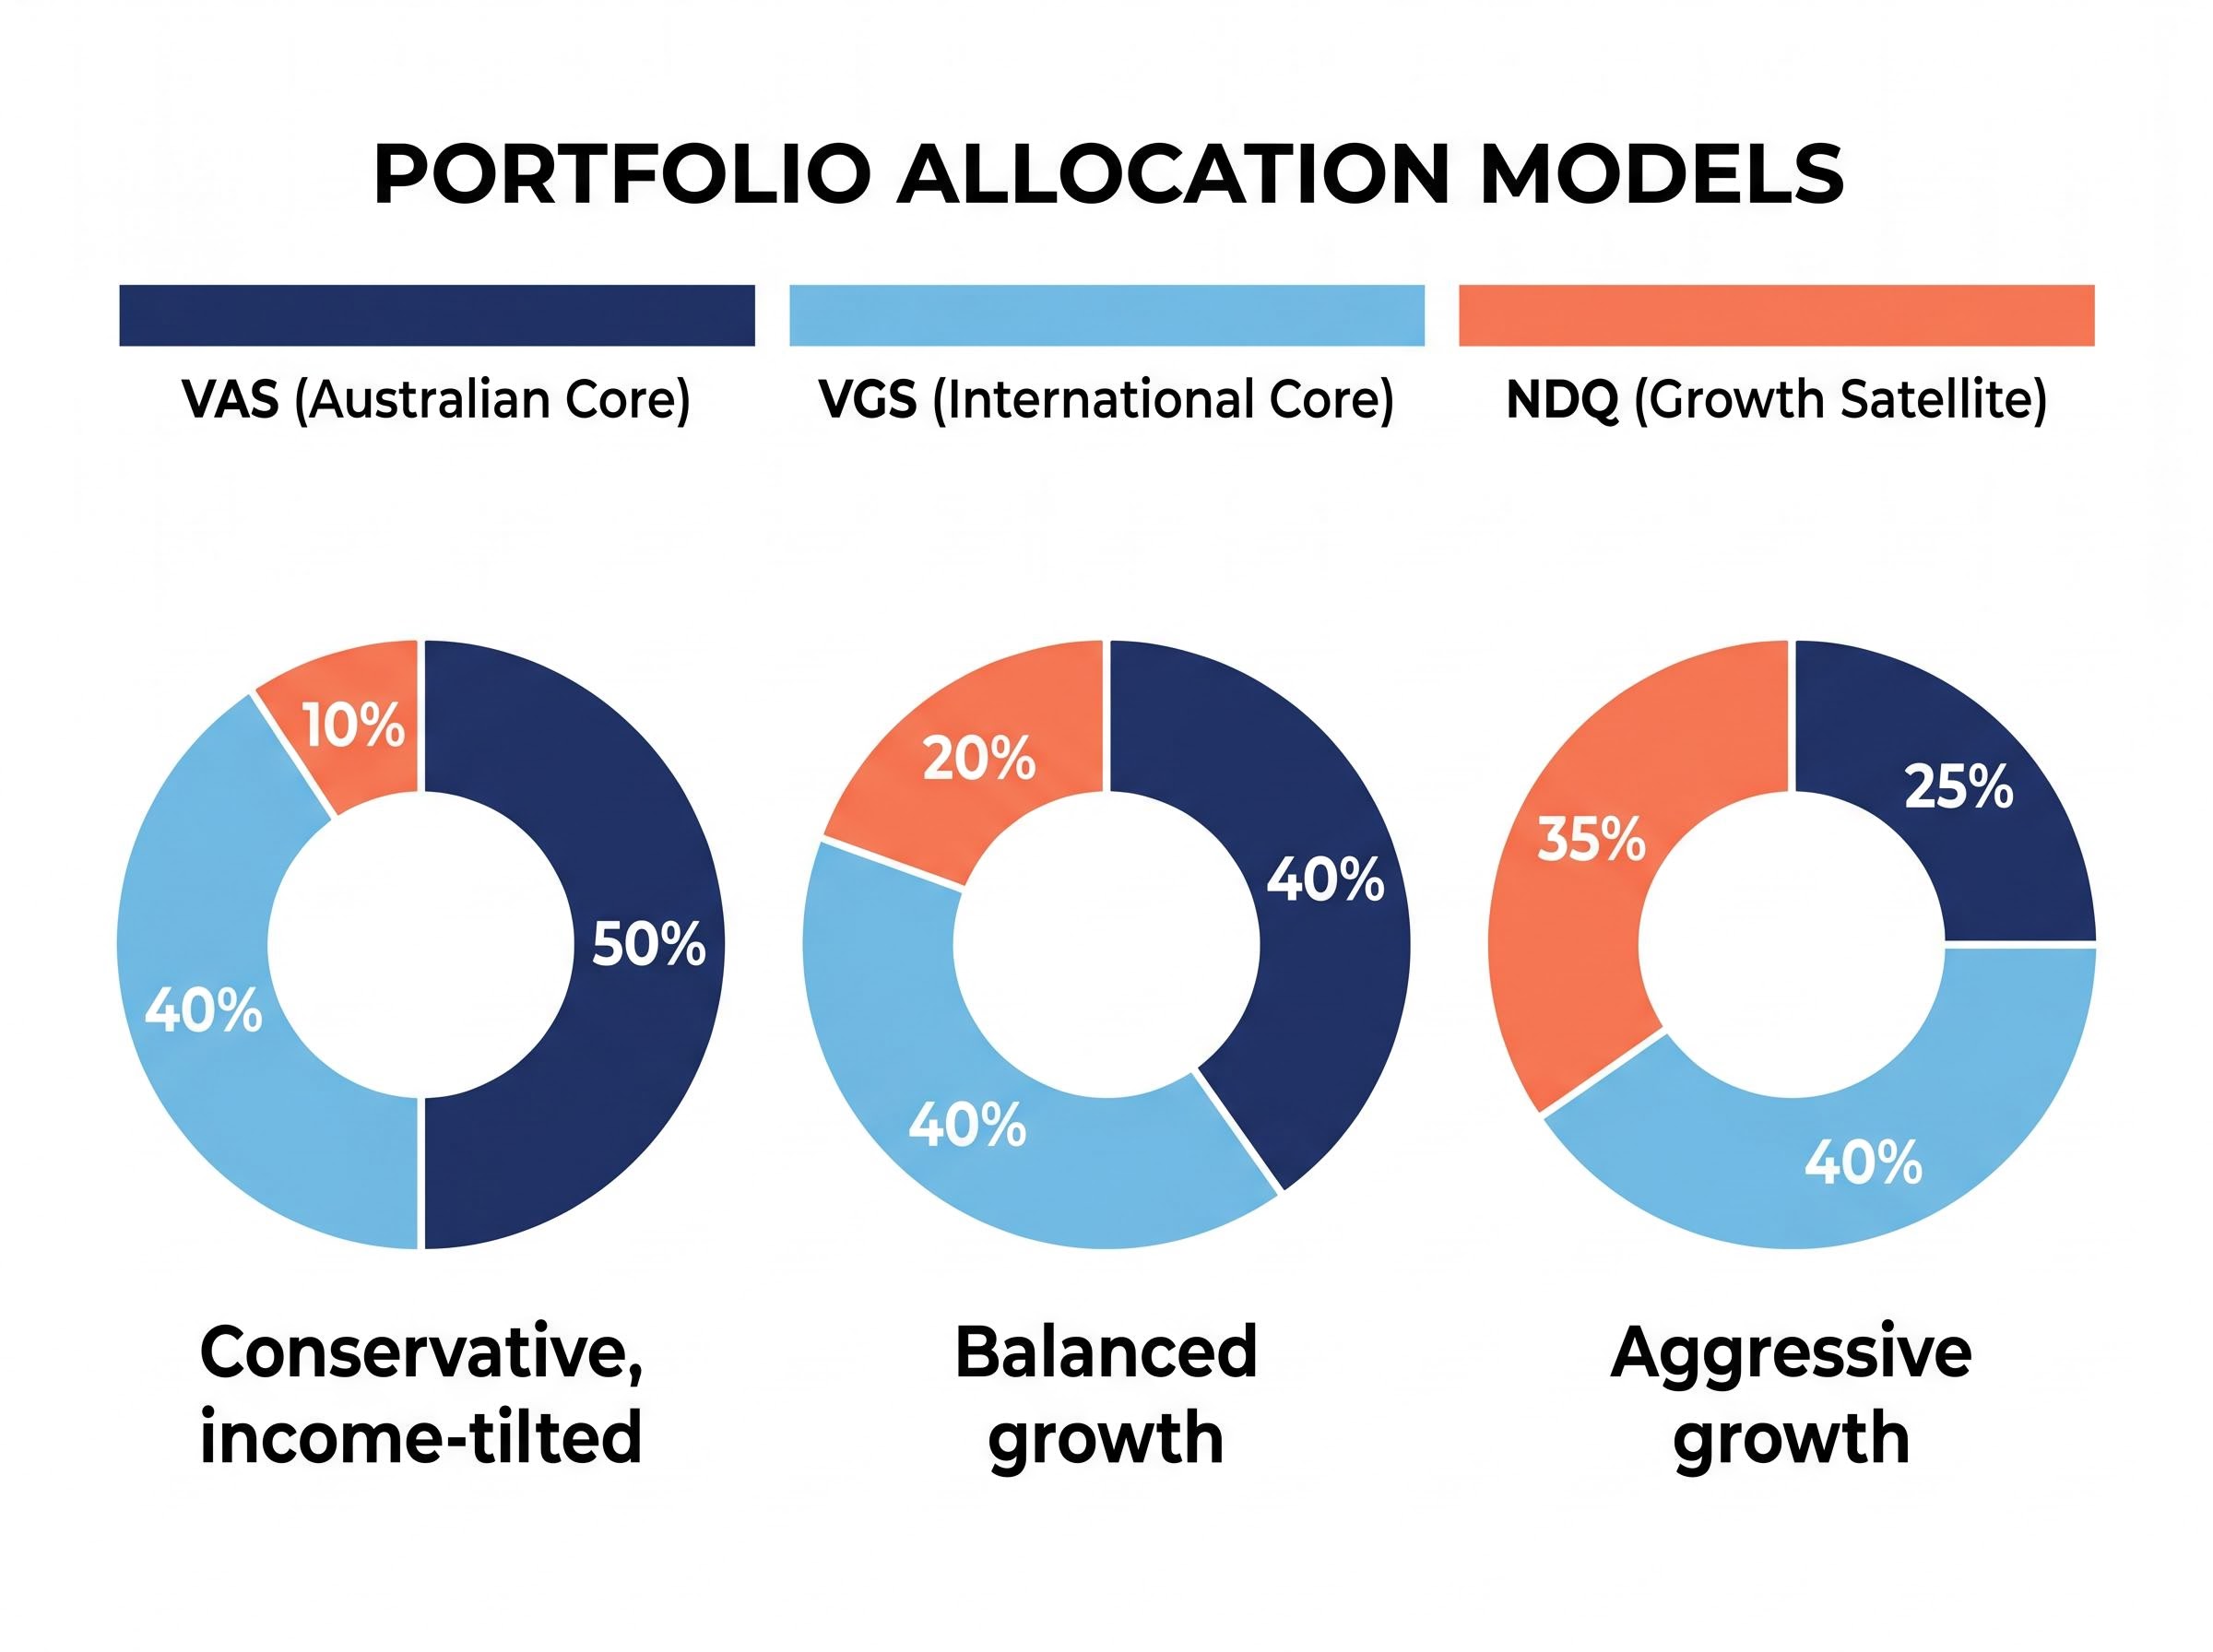
Morningstar has flagged that pushing VAS above 50% of the total portfolio begins to replicate the sector concentration problem the three-fund structure is designed to solve. On the other end, Pearler and the Get Rich Slow Club have cautioned against exceeding 30% in NDQ, given the fund’s concentration in US technology following the 2025 AI-driven rally. The Vanguard Australia Blog has noted that a simpler 50/50 VAS/VGS split may suit conservative investors who prefer to exclude the satellite position entirely.
The allocation that works is the one an investor can hold through a downturn without abandoning. Choose based on time horizon, income needs, and honest tolerance for volatility.
Tax is where generic global ETF guides fall short for Australian readers. Three specific dimensions apply to this portfolio.
Franking credit calculations follow a specific formula: a fully franked dividend is grossed up by multiplying the cash amount by 30 and dividing by 70, reflecting the 30% corporate tax already paid at the company level, which means a $1,000 VAS distribution can be worth $1,428.57 in total value to an SMSF in pension phase or an eligible low-income retiree once the ATO refunds the credit.
For self-managed super fund (SMSF) investors, the concessional 15% tax rate within superannuation changes the franking credit calculus and may favour a higher VAS allocation inside super relative to a taxable portfolio.
Tax treatment varies by individual circumstances. Investors should consult a registered tax adviser and refer to the ATO’s official guidance on ETFs at ato.gov.au/).
The gap between knowing what to buy and buying it is where many informed investors stall. The process is simpler than it appears.
Choose a broker. Australian retail investors can purchase these ETFs through any CHESS-sponsored online broker with ASX access. Four widely used platforms:
Place the order. The purchase process follows five steps:
ASIC Regulatory Guide 282, published in November 2025, sets out the licensing and disclosure obligations that ETF issuers must meet before listing on the ASX, establishing the investor protection framework that applies to VAS, VGS, and NDQ as exchange traded products available to Australian retail investors.
At current prices (as at 10 May 2026), a single unit of VAS costs approximately $108.56, VGS approximately $151.54, and NDQ approximately $58.54. A starter position of one unit in each costs under $320, making entry accessible at almost any scale.
A three-ETF structure improves diversification. It does not remove risk. Being direct about what can go wrong is the mark of a serious investor, not a reason to avoid the approach.
Currency risk. VGS and NDQ are unhedged. Movements in the AUD/USD exchange rate directly affect the AUD value of returns, regardless of how the underlying equities perform. A strengthening Australian dollar reduces the value of international holdings when converted back, even if those holdings have risen in their local currency.
VGS’s US concentration, which sits above 72% of the portfolio, is a nuance worth dwelling on: investors adding VGS for geographic diversification are simultaneously making a large implicit bet on American equities and US dollar assets, a dynamic that behaves differently from the broad international exposure the fund’s label suggests.
Market-wide drawdowns. No diversification structure eliminates the possibility of simultaneous declines across all three funds during a global risk-off event. 2022 demonstrated that Australian equities, developed international equities, and technology stocks can all fall at the same time.
NDQ concentration risk. With 53.7% in Information Technology and a single holding (Nvidia) at 8.7%, NDQ carries sector-specific vulnerability that VAS and VGS do not. A regulatory action targeting major technology companies or a broad sector downturn would disproportionately affect this fund. NDQ’s three-year annualised return of 24.17% illustrates both the potential upside and the magnitude of possible reversals.
Rebalancing drift. After a sustained period of strong technology performance, NDQ’s share of the portfolio can drift above its intended weight. Annual rebalancing, selling a portion of the outperformer and redirecting to the underweight fund, is broadly recommended to maintain the allocation that matches the investor’s risk tolerance.
The VAS/VGS/NDQ structure earns its simplicity because each fund has a clearly defined, non-duplicative role. VAS delivers Australian income and stability. VGS provides international breadth. NDQ adds a deliberate growth tilt.
The right allocation varies by investor, but the 40/40/20 model offers a practical starting point that most readers can act on today. This is not a set-and-forget approach requiring zero attention; annual rebalancing and continued regular investment are the two disciplines that make it work over time.
Past performance does not guarantee future results. Financial projections are subject to market conditions and various risk factors.
This article is for informational purposes only and should not be considered financial advice. Investors should conduct their own research and consult with a licensed financial adviser before making investment decisions.
A three-fund ETF portfolio on the ASX typically combines VAS for Australian equity exposure, VGS for international developed-market diversification, and NDQ for a growth tilt toward Nasdaq-listed technology companies, giving investors broad coverage across geographies and sectors with minimal complexity.
The most commonly referenced starting allocation in 2025-2026 Australian retail ETF commentary is 40% VAS, 40% VGS, and 20% NDQ, though investors can adjust this based on their income needs, time horizon, and tolerance for volatility.
VAS distributions may carry franking credits representing corporate tax already paid by the underlying Australian companies, which can reduce an investor's personal income tax liability or generate a refund, making VAS particularly valuable for income-focused and SMSF investors.
NDQ carries significant concentration risk, with 53.7% of the fund in Information Technology and a single holding in Nvidia at 8.7%, meaning a sector-specific downturn or regulatory action could disproportionately affect the fund; it also posted a negative 8.43% three-month return to March 2026 as a reminder of its short-term volatility.
You can purchase VAS, VGS, and NDQ through any CHESS-sponsored online broker with ASX access, such as CommSec, SelfWealth, Stake, or Pearler, by opening a verified account, depositing funds, searching for the ticker code, and placing a market or limit order during ASX trading hours between 10:00am and 4:00pm AEST.