How to Value Transition-Stage Stocks Using Scenario Analysis
22 mins ago

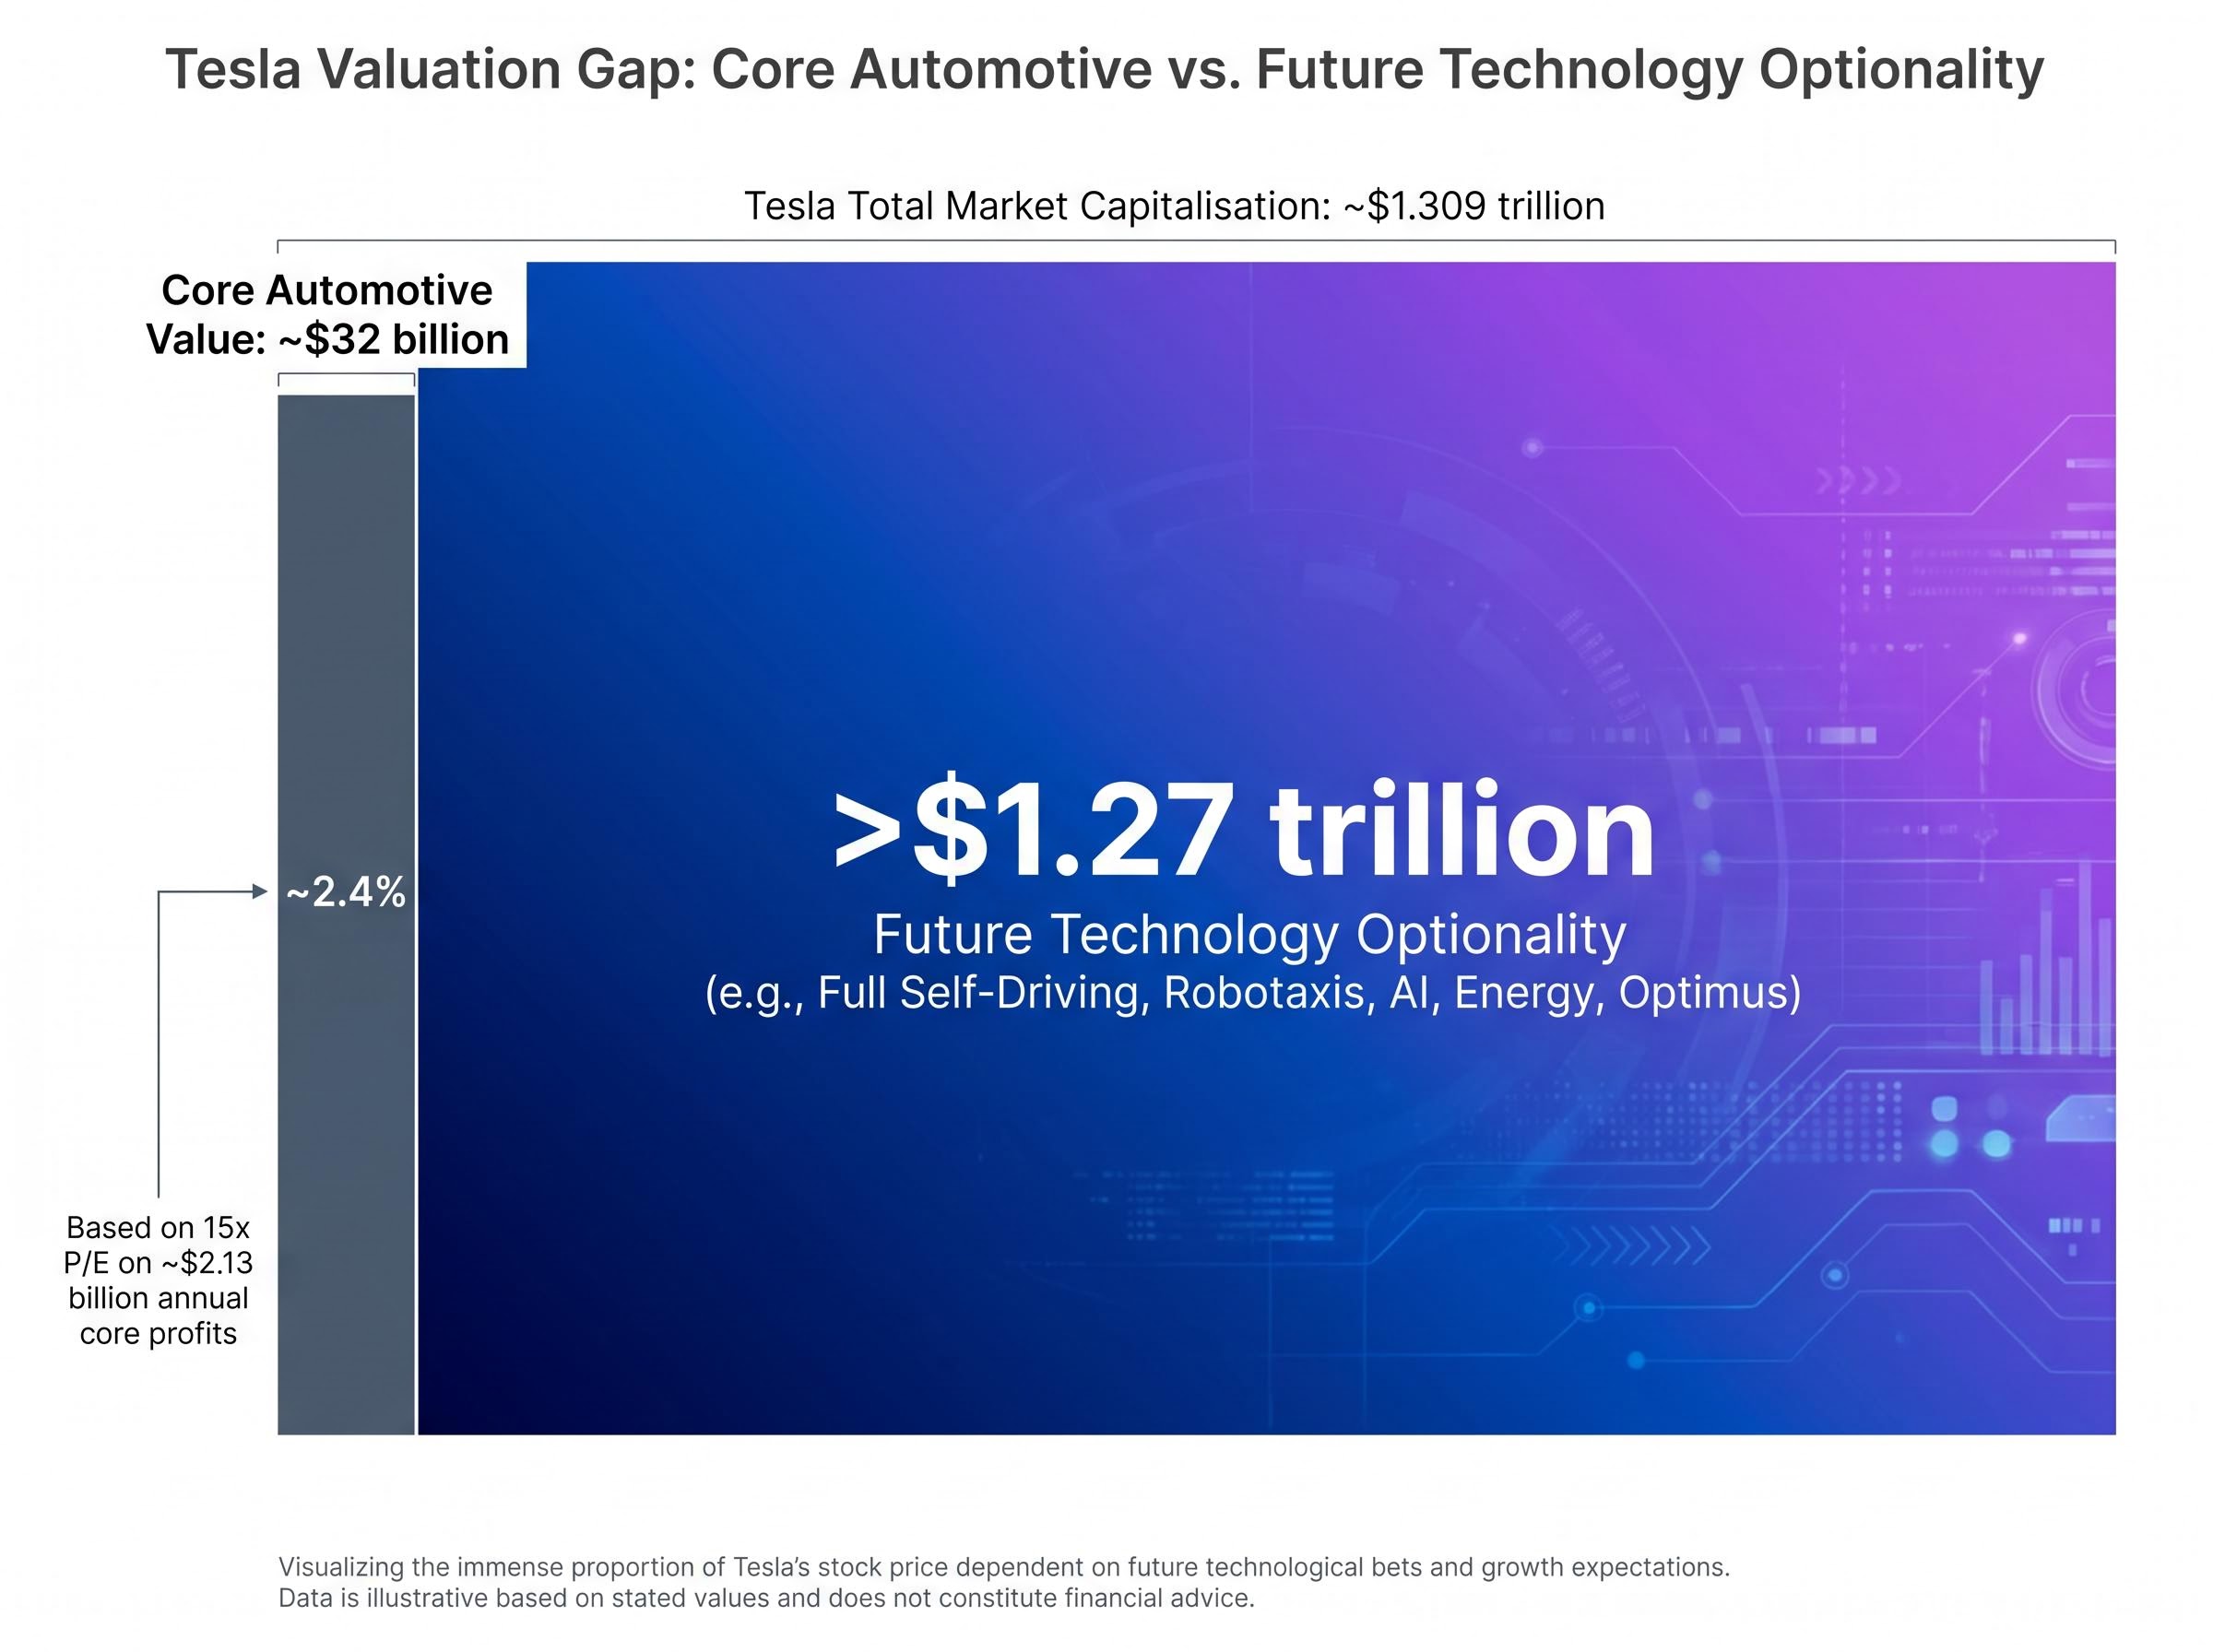
Tesla trades at roughly 85x forward earnings. Its core automotive business, valued on traditional auto-sector multiples, would justify perhaps $32 billion. The market capitalisation sits above $1.3 trillion. That gap is not an error. It is a deliberate bet, and understanding exactly what kind of bet it is represents one of the most instructive exercises in modern stock valuation analysis.
With Q1 2026 results now reported (revenue of $22.4 billion, earnings per share of $0.41, both beating consensus), the near-term operating picture is clearer than it has been in several quarters. Yet analyst price targets still range from $119 to approximately $600, with certain DCF models reaching $1,746 as a separate bull-case output. The disagreement is not about last quarter. It is entirely about which version of Tesla exists in 2030.
This guide uses Tesla’s current valuation as a working case study to teach a replicable framework: how to construct bull and bear scenarios, how to model what each scenario implies for returns, and why the price paid at entry shapes outcomes more than most investors expect.
The instinct is reasonable. Check the forward P/E. Compare it to peers. Decide whether the stock is expensive. For most companies, that three-step process produces a useful starting point. For Tesla in May 2026, it produces a number that is simultaneously “cheap” and “dangerously expensive,” depending entirely on which future materialises.
At a forward P/E of approximately 85x (based on consensus FY2026 EPS of roughly $5.03), Tesla looks extraordinarily expensive relative to any traditional automaker. Yet if the Robotaxi and Optimus programmes deliver the revenue and margins that bull-case models project, that same 85x multiple compresses rapidly into single digits on 2030 earnings. The single number tells the investor nothing without a scenario attached.
Scenario-based stock valuation treats revenue growth, net profit margin, and exit multiple as adjustable inputs rather than fixed consensus figures, producing a range of return outcomes that single-point estimates systematically conceal.
The optionality gap: Tesla’s core automotive business is estimated at roughly $32 billion (15x P/E on approximately $2.13 billion in annual core profits). The market capitalisation is approximately $1.309 trillion. The difference, more than $1.27 trillion, represents the market’s explicit pricing of future technology optionality.
The analyst price target range tells the same story. Bear-case targets sit near $119. Bull-case DCF models reach $1,746. Hold ratings cluster around $389-$400. This is not a range of opinions about Tesla’s quality as a company. It is a range of structurally different assumptions about which business model Tesla operates under in five years.
Forward P/E is structurally inadequate as a standalone valuation tool when any of the following conditions apply:
Tesla meets all three conditions. Recognising when a standard metric is structurally inadequate, before the analysis begins, protects investors from confident conclusions built on the wrong foundation.
When a company contains both operating businesses and significant option-value bets, sum-of-the-parts analysis becomes the appropriate starting framework. The method forces a separation between what current cash flows can justify and what the investor is paying for in expectation of future cash flows that do not yet exist.
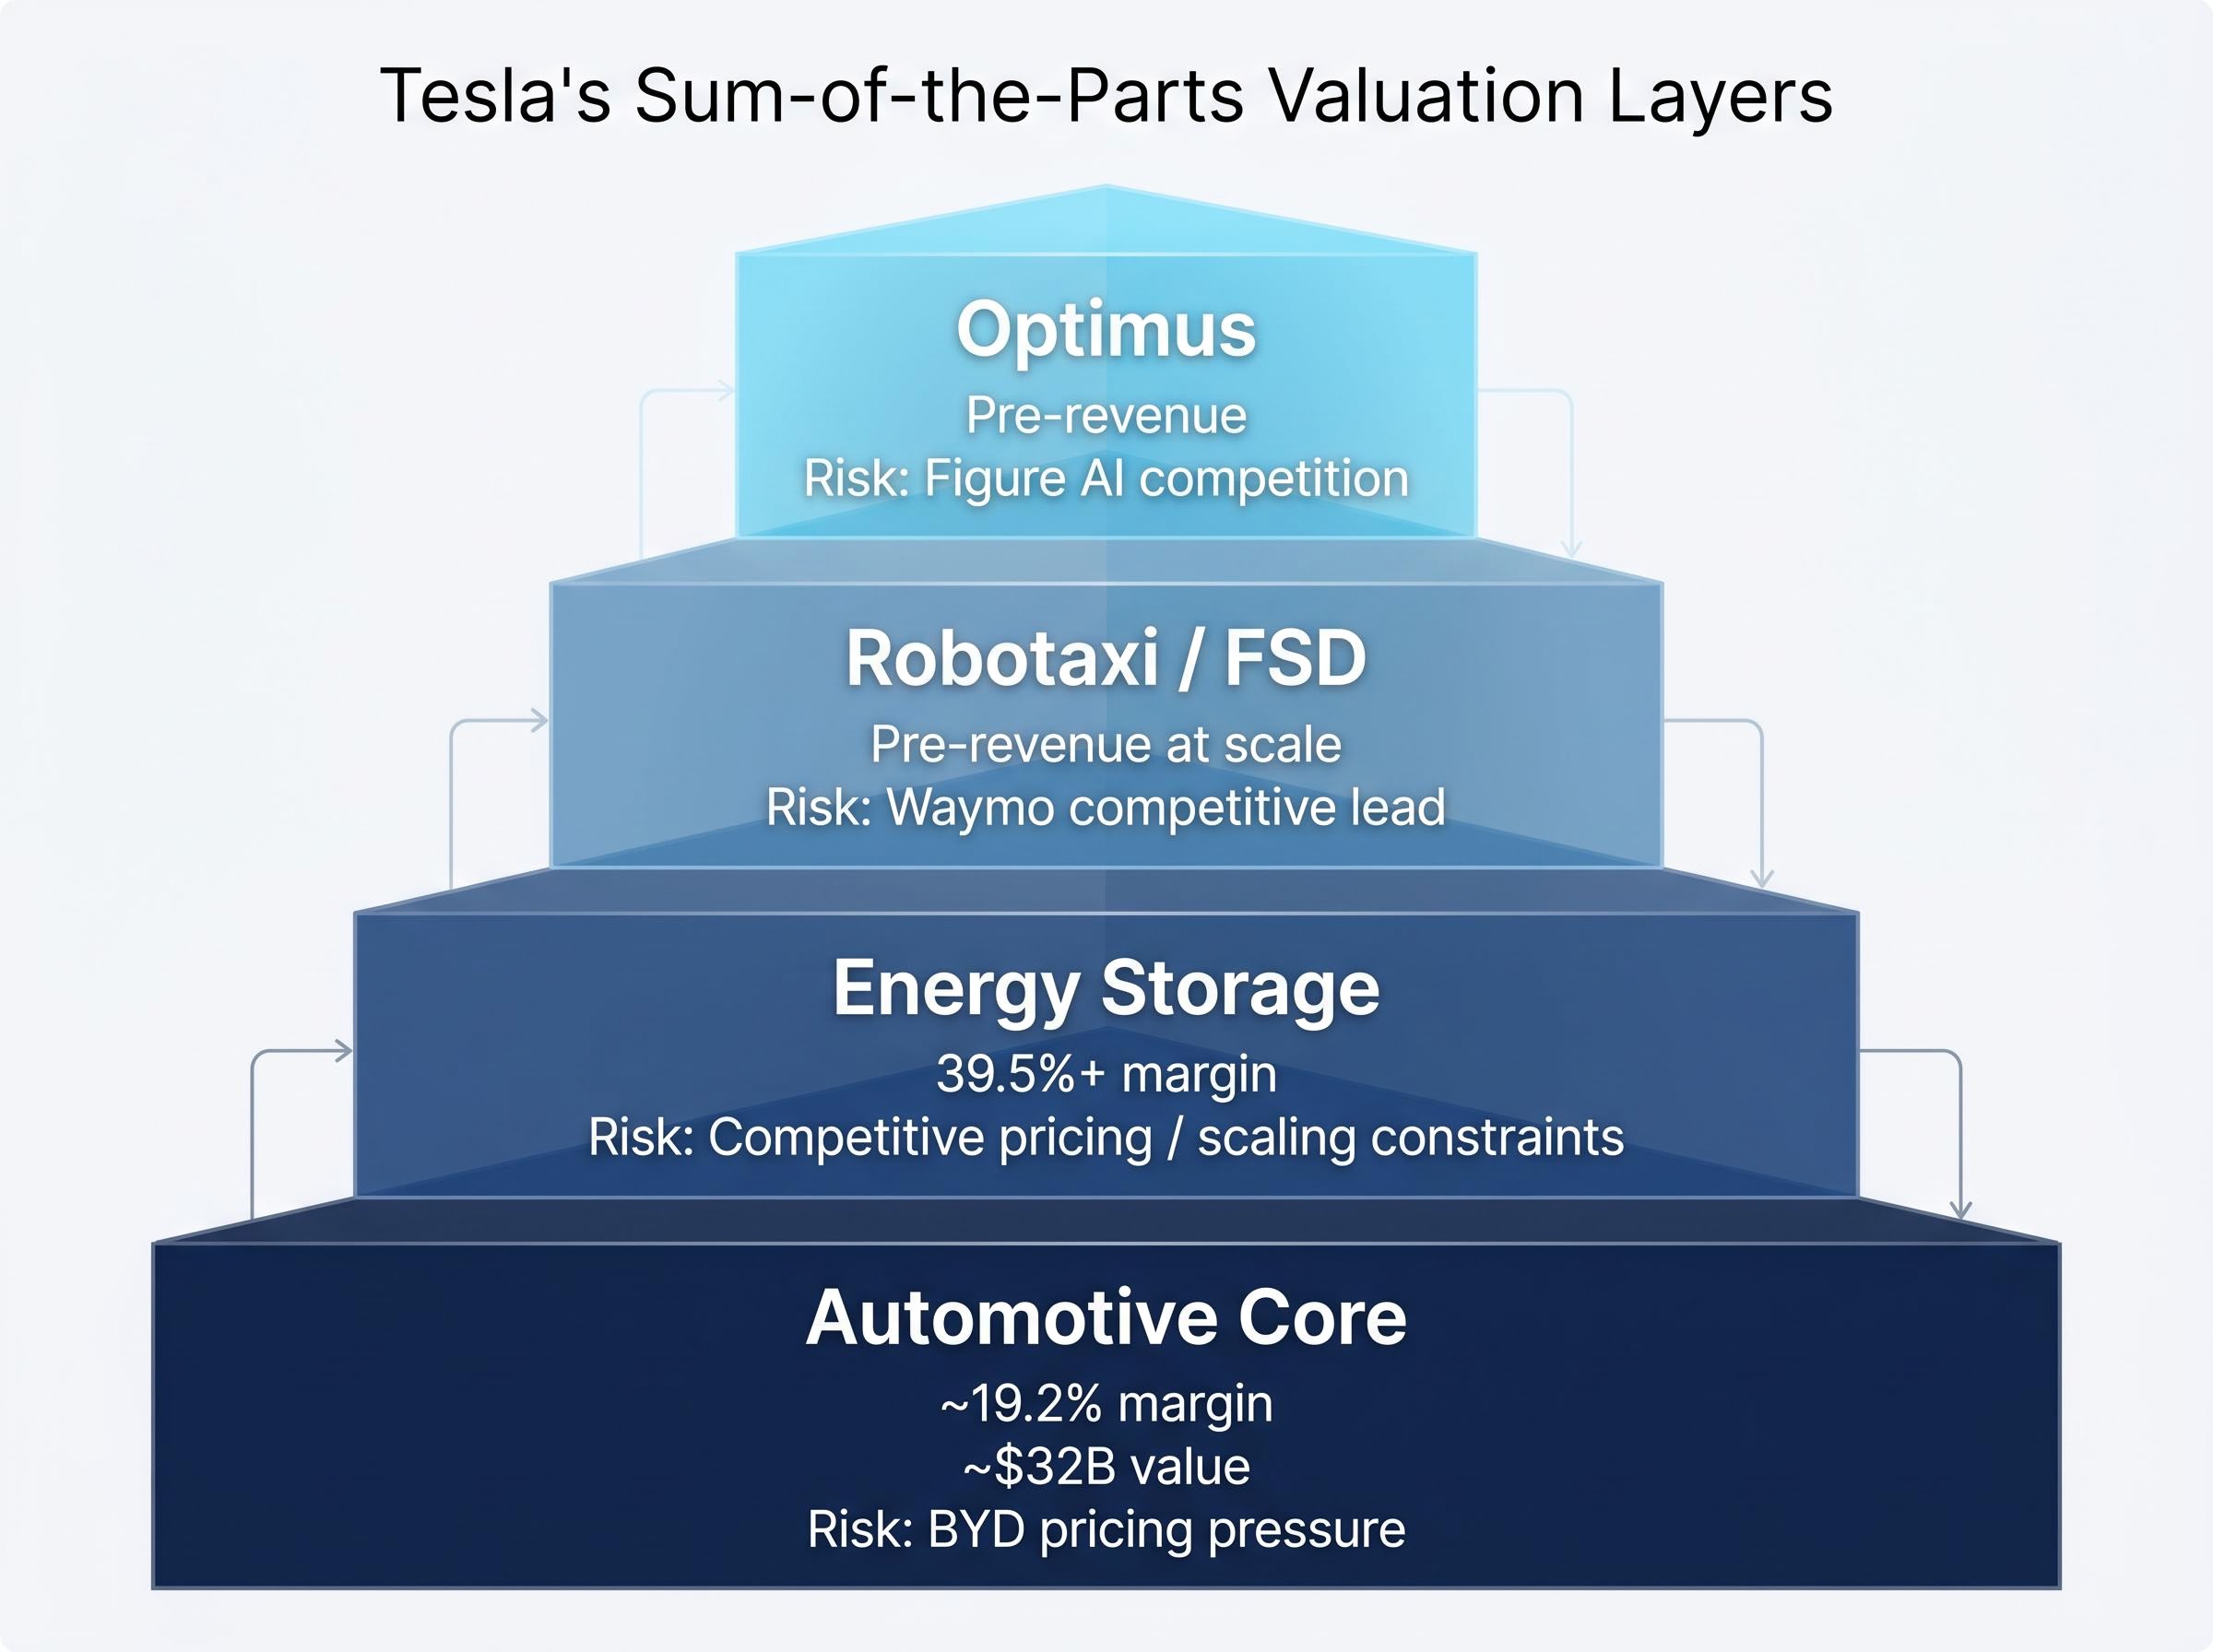
For Tesla, the decomposition produces three distinct layers. The automotive core generates measurable profits and can be valued on observable multiples. The energy storage segment, with gross margins above 39.5% (the highest-margin current business within Tesla), provides a second layer of tangible value. The third layer, the probability-weighted optionality of Robotaxi, Full Self-Driving (FSD), and Optimus, is where the analytical complexity lives, and where most of the market capitalisation resides.
| Segment | Current Gross Margin | Basis for Valuation | Key Risk |
|---|---|---|---|
| Automotive Core | ~19.2% (ex-credits) | 15x P/E on ~$2.13B annual core profits (~$32B) | BYD pricing pressure; margin compression |
| Energy Storage | 39.5%+ | Revenue growth trajectory and margin sustainability | Competitive pricing; scaling constraints |
| Robotaxi / FSD Optionality | Pre-revenue at scale | Probability-weighted DCF of autonomous ride-hailing cash flows | Regulatory delays; Waymo competitive lead |
| Optimus Optionality | Pre-revenue | Probability-weighted DCF of humanoid robotics commercialisation | Technical feasibility; Figure AI competition |
The first two rows are measurable. The last two are estimates, and their treatment separates disciplined analysis from speculation.
Option value is not a vague premium. It is a structured estimate: probability of success multiplied by the present value of cash flows if that success occurs. Assigning even a rough probability to a binary outcome (say, 5-10% for full bull-case materialisation) combined with an estimated payoff value produces a far more disciplined entry price assessment than ignoring the optionality entirely.
The discipline cuts both ways. Under the bear case, if Robotaxi and Optimus fail to materialise, all projected return outcomes were negative at approximately $375 per share. That is what zero probability assignment implies: the tangible business alone does not support the current price. Investors who skip the probability question are implicitly assigning it a value. The sum-of-the-parts framework makes that assignment explicit.
Probability calibration is the most consequential and most frequently skipped step in transformation-stock analysis: shifting a robotaxi scenario from 30% to 10% probability moves the weighted average intrinsic value by a wider margin than adjusting any revenue growth assumption within that scenario.
The bull case for Tesla is genuinely compelling when laid out in full. Revenue growth at a compound annual growth rate (CAGR) of 20-35% (midpoint approximately 27%), with net profit margins expanding from the current 7-10% core range toward 20-30%, produces a company generating earnings several multiples larger than today’s figures. Robotaxi operations, with permits already approved in Texas (Austin, Dallas, Houston) as of April 2026 and California CPUC full approval pending, provide a near-term commercial catalyst. Optimus V3 production is targeted to commence between late July and early August 2025, with external commercial availability projected for 2027.
The operational evidence is not entirely absent. Autonomous vehicle miles driven nearly doubled in Q1 2026 compared to the prior period. The FSD paid customer base has reached approximately 1.3 million globally. Energy storage margins above 39.5% demonstrate that Tesla can build high-margin businesses outside its automotive core.
Under the full bull case, estimated annualised returns range from approximately 11% to 35% over ten years. At 25x-35x earnings multiples on expanded margins, the DCF models that produce targets near $1,746 become arithmetically coherent.
The dependency structure, however, is where scrutiny belongs. For the bull case to deliver those returns, the following conditions must hold simultaneously:
A multi-year delay in Robotaxi profitability alone collapses DCF valuations by 70%+ in bull-case models, illustrating extreme sensitivity to timing assumptions.
Each assumption is individually plausible. The analytical question is whether all five hold simultaneously across a multi-year horizon. That is the dependency structure, and it is the difference between a reasoned bet and wishful thinking.
The bear case does not require Tesla to fail. It requires only that the transformation arrives later, or at smaller scale, than the current stock price demands.
Under this scenario, Tesla remains a high-quality electric vehicle manufacturer with above-average margins relative to traditional automakers, but Robotaxi deployment is delayed beyond 2028 and Optimus fails to achieve meaningful commercial scale within the investment horizon. Revenue compounds at 6-12% annually (midpoint 9%), net profit margins settle in the 8-14% range, and the market re-rates Tesla at 18x-22x earnings, a premium to legacy automakers but well below current levels.
At approximately $375 per share, all projected return outcomes under this scenario were negative. At the current price of roughly $428, the arithmetic is worse.
| Assumption Category | Bull Case Input | Bear Case Input |
|---|---|---|
| Revenue CAGR | 20-35% (midpoint ~27%) | 6-12% (midpoint ~9%) |
| Net Profit Margin | 20-30% | 8-14% |
| Valuation Multiple | 25x-35x earnings | 18x-22x earnings |
| 10-Year Annualised Return Estimate | ~11-35% | Negative at current price |
The competitive dynamics reinforce the bear case from multiple directions:
The uncomfortable realisation the bear case delivers is straightforward. The question is never whether a company is good. The question is whether the current price already assumes everything goes right, leaving no margin for error.
Tesla shares were available at approximately $100 per share in the prior few years. On 8 May 2026, the price was approximately $428.35. The company is the same in both scenarios. The investor’s outcome is not.
An investor who bought at $100 and holds through a partial-success base case (Robotaxi launches but margin contribution below bull-case expectations, Optimus in industrial deployment rather than mass market) captures estimated 10-15% annualised compounding through 2028. The same base case delivers far less to the investor who entered at $428, because substantially more of the future value is already reflected in the purchase price.
At $100, the bull case produces exceptional returns and the base case produces strong returns. At $430, the bull case produces moderate returns and the base case produces mediocre ones. Same company. Same future. Different entry price.
Tesla peaked near $450 per share; investors who bought near that level may still be sitting on losses depending on exact timing. Forward analyst EPS estimates project earnings growing more than 5x from current levels, but that growth expectation is already embedded in today’s price. Meanwhile, analyst EPS estimates declined more than 90% from peak before recovering, illustrating the earnings volatility that accompanies elevated entry prices.
At roughly $428 in May 2026, the price already reflects substantial probability of Robotaxi and Optimus success. The upside asymmetry is weaker than at lower entry points because the market has already priced in a significant portion of the optionality.
The framework generalises beyond Tesla. Before buying any company whose price embeds a transformation bet, calculate the implied probability of success already baked into the current price. Then ask: is the remaining expected return adequate compensation for bearing the execution risk?
The base case serves as the most useful anchor. Partial execution (commercial launch with below-target margins, niche rather than mass-market deployment) produces the return ceiling that most investors should model unless they hold a specific, informed view on the binary outcomes. For Tesla, that base case currently points to approximately 10-15% annualised compounding through 2028, which is reasonable but far from the headline returns that bull-case targets imply.
Entry price is entirely within an investor’s control in a way that a company’s future execution is not. That asymmetry makes it the most actionable output of scenario analysis.
Tesla’s price target dispersion, from $119 at the bear end through hold ratings clustered around $389-$400 to a bull-case DCF target of $1,746, is not noise. It is diagnostic information. It signals a company whose value is driven by binary-outcome scenarios where small assumption changes produce enormous valuation swings.
Analyst price target dispersion of this magnitude is diagnostic rather than confusing: each target is internally consistent with a specific set of assumptions about which company is being modelled, and the spread itself maps the range of scenarios an investor must choose between.
Reading that dispersion as a map of scenario disagreement, rather than as conflicting opinions, is a durable analytical skill. The framework that produces this reading has three steps:
The full bull case for Tesla is estimated at roughly 5-10% probability of complete materialisation. That probability, applied to the bull-case payoff, produces a far more conservative expected value than the $1,746 headline target implies on its own.
No framework eliminates the fundamental uncertainty. Tesla may deliver on Robotaxi and Optimus, or it may not, and no model resolves that question in advance. The goal is narrower and more useful: to know precisely what the uncertainty consists of and to ensure the entry price provides adequate compensation for bearing it.
For investors who want to work backwards from the current share price to understand what growth rate the market is already assuming, our full explainer on reverse DCF methodology walks through the calculation step by step using Tesla’s Q1 2026 figures, and examines historical cases where optically extreme multiples were eventually justified by earnings growth, alongside the severe drawdowns that preceded those outcomes.
This article is for informational purposes only and should not be considered financial advice. Investors should conduct their own research and consult with financial professionals before making investment decisions. Past performance does not guarantee future results. Financial projections are subject to market conditions and various risk factors.
No one buys Tesla at $428. They buy one of several Teslas, depending on which scenario materialises. The automotive core justifies a fraction of the price. The energy storage business adds meaningful value. The Robotaxi and Optimus optionality, priced at varying probabilities by every analyst who covers the stock, accounts for the rest.
Three questions clarify the bet before entering any transformation-stage investment:
These questions do not produce a buy or sell answer. They produce clarity about what the investor is actually betting on and at what odds. That clarity, applied consistently, is worth more than any single price target.
Consider applying the bull, bear, and base case framework to one company currently on a watchlist or in a portfolio before the next earnings cycle. Start with the sum-of-the-parts decomposition. Make the assumptions explicit. The methodology, not the conclusion, is the durable asset.
Scenario-based stock valuation analysis treats revenue growth, net profit margin, and exit multiple as adjustable inputs rather than fixed figures, producing a range of return outcomes that single-point estimates conceal, making it especially useful for transformation-stage companies.
Forward P/E fails as a standalone tool when a company generates negative free cash flow, faces binary outcome risks, or derives most of its market cap from future optionality rather than current earnings power, all conditions Tesla currently meets.
Entry price directly shapes investor outcomes because a higher purchase price means more of the future transformation is already reflected in the cost basis, compressing upside even if the company executes perfectly, as illustrated by Tesla at $100 versus $428 producing very different return profiles under the same base case.
Sum-of-the-parts valuation separates a company's tangible business value from its speculative option value; for Tesla, this means distinguishing the automotive core (estimated at roughly $32 billion) and energy storage segment from the probability-weighted optionality of Robotaxi and Optimus.
Wide price target dispersion, such as Tesla's range from $119 to $1,746, reflects structurally different assumptions about which business model the company operates under in five years, not disagreement about current quality, making the spread a map of distinct scenario bets rather than conflicting opinions.