
What Tesla’s Valuation Teaches About Buying High-Multiple Stocks
5 mins ago

At roughly $428 per share and a forward price-to-earnings ratio of approximately 189x, Tesla is priced as though its most ambitious projects have already succeeded. That single observation captures the tension at the heart of every high-multiple stock: the price reflects a bet on what the company might become, not what it earns today. For investors trying to make sense of a $1.37 trillion market capitalisation on a company whose core automotive business faces margin pressure and intensifying competition, the challenge is not just “what is Tesla worth” but “how do you even approach the question?”
Tesla’s Q1 2026 earnings report reignited the debate with unusual intensity. Revenue rose 15.8% year-over-year to $22.4 billion. Adjusted earnings per share climbed 51.9% to $0.41. Yet free cash flow turned negative as the company simultaneously builds out robot manufacturing, AI chip infrastructure, and a driverless ride-hailing network.
This guide uses Tesla’s current valuation as a concrete, numbers-rich case study to teach a transferable methodology: how to construct and stress-test bull and bear scenarios for any company in strategic transition, how different valuation frameworks interact, and why the price paid at entry may be the single most consequential variable in the entire analysis.
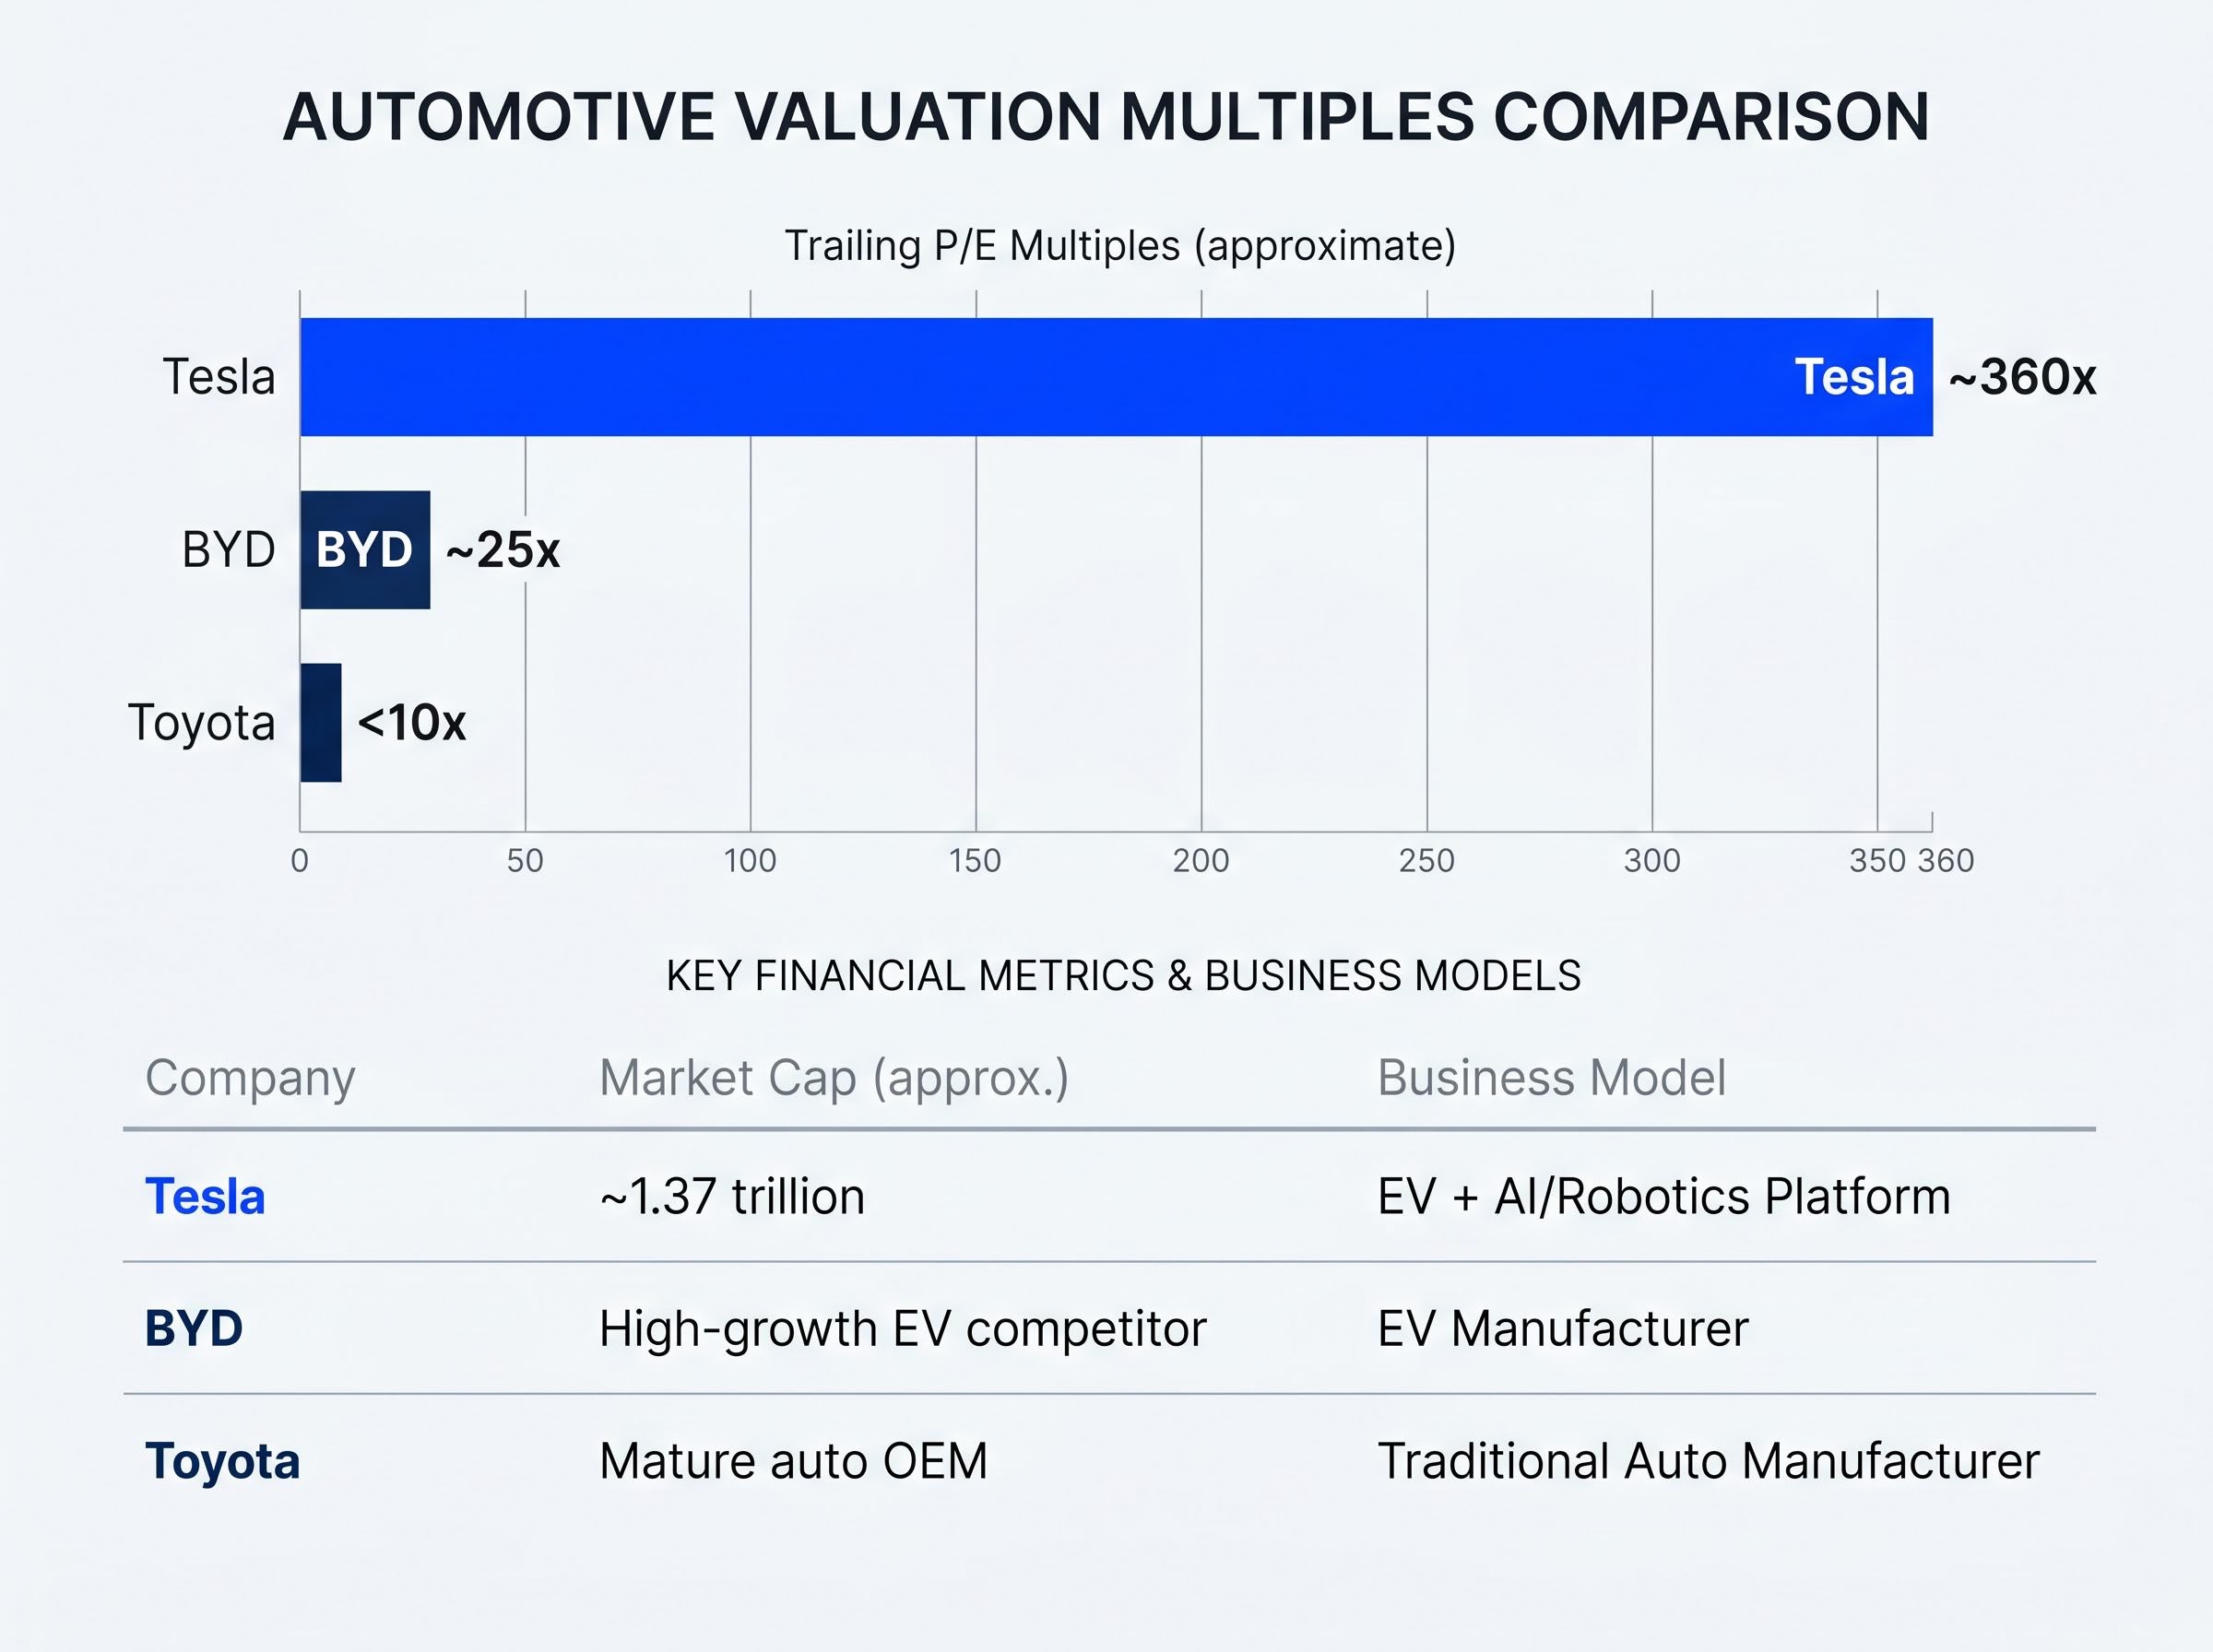
A trailing price-to-earnings ratio of 360x looks absurd. Toyota trades below 10x. BYD sits at roughly 25x. Placed side by side, the comparison suggests Tesla is wildly overvalued.
| Company | Trailing P/E | Market Cap | Business Model |
|---|---|---|---|
| Tesla | ~360x | ~$1.37 trillion | EV + AI/Robotics Platform |
| Toyota | <10x | Mature auto OEM | Traditional Auto Manufacturer |
| BYD | ~25x | High-growth EV competitor | EV Manufacturer |
That comparison is both correct and incomplete. It is correct because, measured on current earnings, Tesla trades at a staggering premium to every automotive peer. It is incomplete because the market is not pricing Tesla as an automotive peer. The $1.37 trillion market cap embeds what might be called a “narrative premium,” a probability-weighted value assigned not to what the company earns today but to what it could become if autonomous driving, robotaxi networks, and humanoid robotics scale as bulls expect.
A stock price is not a verdict on current earnings. It is a probability-weighted bet on multiple possible futures. When a company is mid-transformation between two fundamentally different business models, single-metric comparisons produce conclusions that are technically accurate and practically misleading.
This is why a P/E ratio, price-to-earnings, or an enterprise-value-to-EBITDA multiple alone fails for transitional companies. These metrics assume the current earnings profile is representative of the company’s long-term economics. For Tesla, whose Q1 adjusted EPS of $0.41 reflects an automotive business undergoing simultaneous capital-intensive expansion into robotics and AI, no single ratio captures both the present reality and the range of possible futures. Investors need more sophisticated tools.
Sophisticated analysts do not pick one valuation method and defend it. They use multiple frameworks, each with a different aperture, and triangulate the results. Three frameworks are particularly relevant for companies in Tesla’s position.
The DCF is one of several discounted cash flow methods whose outputs are only as reliable as their inputs: a WACC shifted by a single percentage point can move Tesla’s implied intrinsic value by tens of billions of dollars, illustrating why assumption discipline matters more than the mechanical precision of the formula itself.
The TAM approach is legitimate when optionality genuinely dominates near-term earnings and the investor has a multi-year time horizon. One bull case frames Tesla’s combined addressable market across AI, robotics, energy, and autonomy at $25 trillion if all verticals succeed. At the other extreme, the bear case values Tesla as an auto-only manufacturer, implying roughly $50-$80 per share at peer multiples.
Market-based benchmarks for standalone humanoid robotics provide useful context. Figure AI raised over $1 billion in its September 2025 Series C at a post-money valuation of $39 billion. Boston Dynamics is valued at approximately $22 billion as of March 2026. Tesla’s Optimus programme is embedded inside a $1.37 trillion company, making direct comparison complex but not impossible.
Goldman Sachs humanoid robotics TAM projections estimate the market reaching $38 billion by 2035, driven by advances in AI capability and declining hardware costs, a benchmark that contextualises both the scale of Tesla’s Optimus ambitions and the gap between current robotics valuations and the long-run market opportunity bulls are pricing in.
The danger arrives when TAM frameworks become rationalisation tools, used to dismiss near-term execution problems by pointing to a sufficiently large addressable market. If a company’s nearest milestones are slipping, the TAM number does not change the fact that the pathway to capturing it has become less certain.
The bull case is not a feeling. It is a set of numerical assumptions that can be written down, tested, and debated. Working through each input transforms the narrative into a series of testable claims.
Revenue growth in the bull scenario requires a compound annual growth rate in the range of 20-35%, with a midpoint of approximately 27%. Net profit margins need to expand from the current 7-10% range to 20-30%, a level that implies Tesla’s software and autonomy revenues become a meaningful share of the mix. The market would then need to assign a valuation multiple of 25-35x earnings to that future earnings stream.
Those assumptions produce projected annualised returns of approximately 11-35% over a 10-year horizon, depending on where within each range the actual outcome falls. The mid-case 2030 projection from one bull model reaches $2,684 per share, while the highest current analyst price target sits at $600.
The operational milestones that underpin these assumptions are specific and near-term enough to be tracked:
Every purchase at a given price implicitly assigns a probability to each scenario. At $428, an investor is paying a price that requires a high probability of the transformation succeeding.
Research from the analysed valuation models estimates the full bull case at roughly 5-10% probability of complete materialisation. That does not mean it cannot happen. It means investors entering at this price are accepting a position where the most optimistic outcome must occur for the investment to deliver strong returns. That probability assessment should directly inform position sizing and the level of conviction required before committing capital.
Probability calibration, the act of assigning explicit numeric weights to each scenario rather than leaving them implicit, is the step most commonly skipped in retail investor analysis; research on the Tesla model shows that shifting the robotaxi scenario from a 30% to a 10% probability weight moves the blended fair value estimate by more than adjusting the revenue growth assumption within that scenario.
The bear case is not a prediction of disaster. It is the outcome if Tesla simply fails to execute the transformation while the core automotive business continues performing reasonably well.
Revenue growth in this scenario runs at 6-12%, with a midpoint of approximately 9%, reflecting a strong but maturing EV manufacturer. Net profit margins settle in the 8-14% range. The market assigns a 18-22x earnings multiple, consistent with what a well-run automotive company might command.
| Variable | Bull Case | Bear Case |
|---|---|---|
| Revenue Growth (CAGR) | 20-35% | 6-12% |
| Net Profit Margin | 20-30% | 8-14% |
| Valuation Multiple (P/E) | 25-35x | 18-22x |
| Implied 10-Year Annualised Return | ~11-35% | Negative |
At an entry price of approximately $375-$428 per share, all projected bear case return outcomes were negative. The maths is straightforward: if Tesla grows as a good EV company but the AI and robotics story does not materialise, the current price already exceeds what those fundamentals support. Free cash flow turned negative in Q1 2026, and 2026 capital expenditure is expected to exceed $25 billion, reinforcing the scale of the bet the company is making on its transformation.
Every dollar paid above what the bear case supports is a bet that the transformation succeeds.
This is the stress test every investor should run before buying any high-multiple stock. If the downside scenario still produces a positive return, conviction is easier to hold through volatility. If the downside scenario implies significant loss, honesty about the probability assigned to the bull case becomes the most consequential part of the analysis.
The same company, the same future outcomes, and the same scenario probabilities produce dramatically different investment returns depending solely on what was paid at entry.
Tesla shares were available at approximately $100 per share a few years prior to this analysis. The stock has since traded as high as nearly $450. An investor who bought near $100 and an investor considering entry at $428 today may hold identical views about Tesla’s future. Their risk positions are fundamentally different. The first investor has a 4x cushion before reaching breakeven. The second investor needs the bull case to materialise simply to justify the purchase price.
At $428, with the average analyst consensus target at $410.21, the stock offers no margin of safety by sell-side consensus. Margin of safety, the gap between the price paid and the estimated fair value, is the buffer that protects against analytical error. When the current price exceeds the consensus target, an investor is paying for a scenario that has not yet materialised.
At $428, every dollar paid above the bear case fair value is a premium that must be justified by the probability assigned to the bull case succeeding.
Forward EPS estimates project earnings growing more than 5x from current levels, but those projections likely already incorporate autonomy and AI contributions. The historical P/E range of 143-401x illustrates how sentiment-driven multiple volatility amplifies entry price risk: buying at the top of a multiple expansion cycle compounds the downside if sentiment reverses.
Before paying a premium for any transitional company, three questions deserve explicit answers:
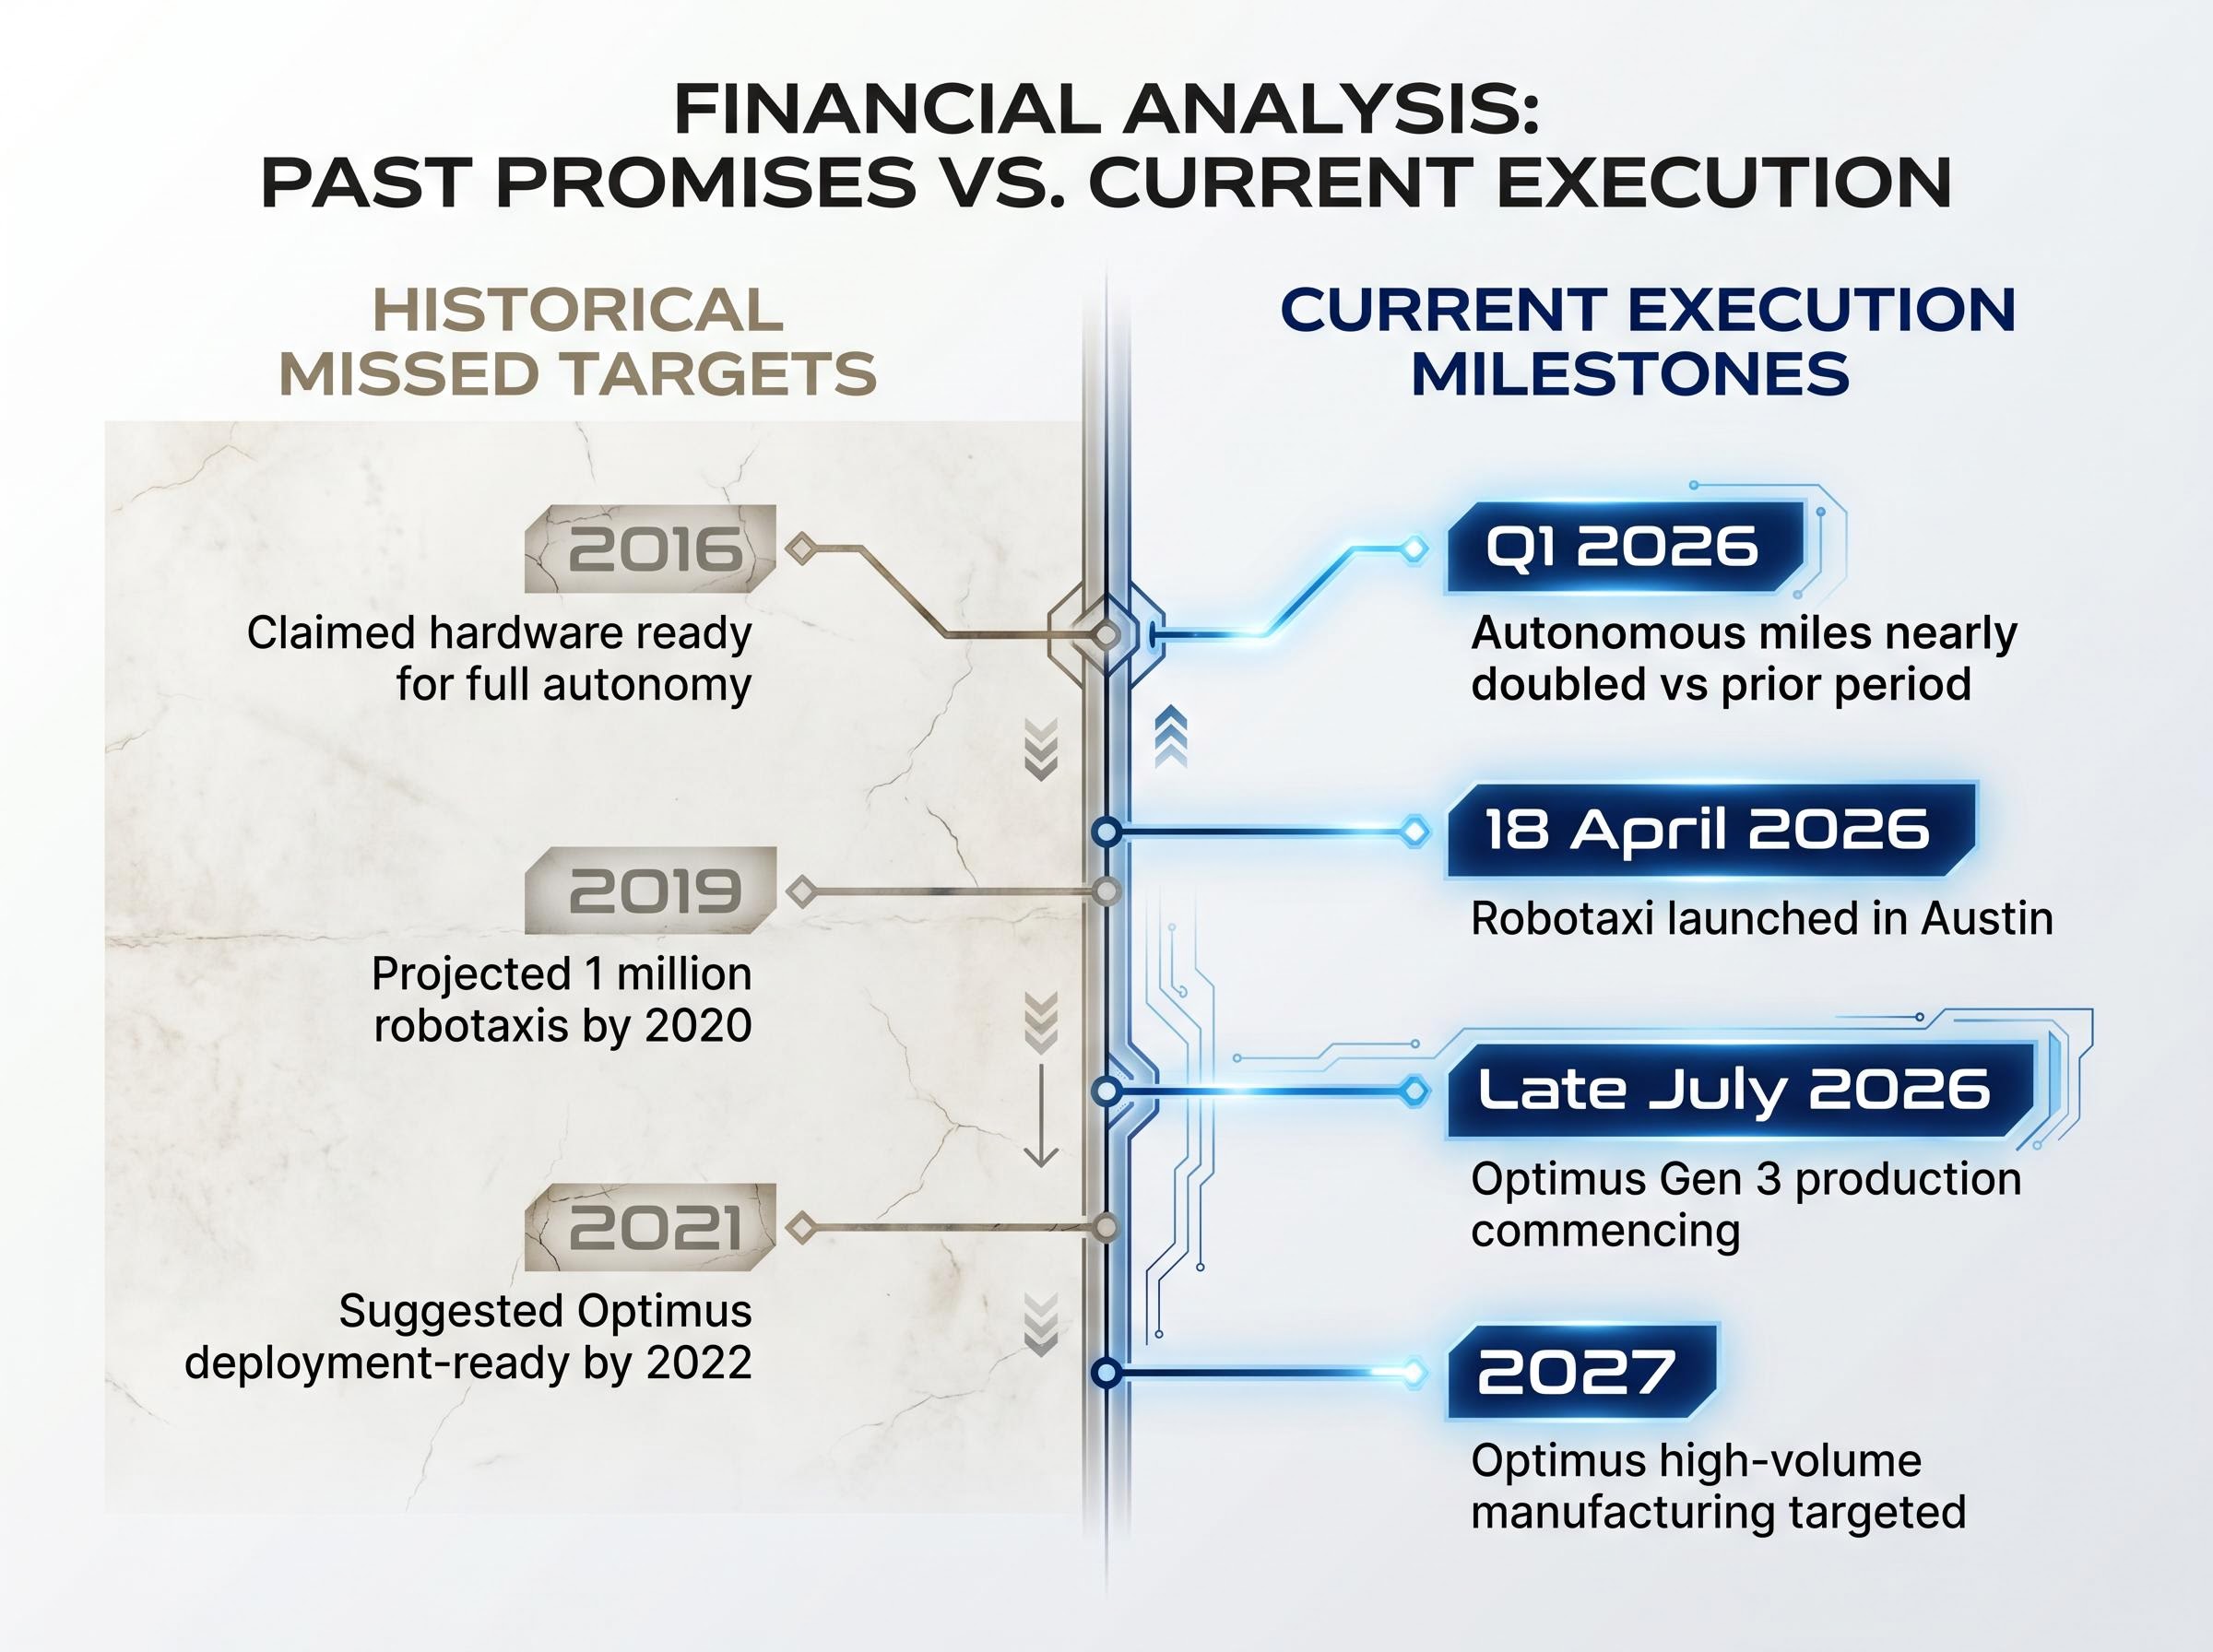
Tesla’s valuation is contested because reasonable people disagree about which future is most likely. Analyst EPS estimates declined more than 90% from their peak before recovering, a reminder of how quickly fundamental assumptions can shift even on high-conviction names. Elon Musk’s own timeline track record adds another layer: the 2016 claim that hardware was ready for full autonomy, the 2019 projection of one million robotaxis by 2020, and the 2021 suggestion that Optimus would be deployment-ready by 2022. None of those timelines were met. All of those programmes are, years later, progressing.
The most probable outcome, according to the research, is partial execution: neither the full bull case nor the full bear case, but something in between. That middle scenario is the hardest to model and the most important to think through, because it is where most transitional companies actually land.
Regulatory and execution risk factors, including autonomous vehicle permitting timelines, capital programme delays, and management timeline slippage, are observable and trackable without inside information; monitoring these variables as leading indicators rather than waiting for quarterly earnings revisions gives investors earlier signals that the probability distribution between bull and bear is shifting.
The methodology built through this case study reduces to three steps applicable to any high-multiple stock:
The quality of an investment decision is not determined by whether the bull case eventually materialises. It is determined by whether the price paid was appropriate given the probability assigned to each scenario at the time of purchase.
Tesla’s bull-versus-bear debate is unresolvable in the present because it hinges on future execution. What is resolvable is whether today’s entry price offers a reasonable probability-weighted return. The analyst community itself is nearly evenly split: 13 buys, 11 holds, 6 sells. The stock’s historical P/E range of 143-401x reflects genuine disagreement about which valuation framework applies.
Analyst price target divergence of this magnitude, with the current Tesla range spanning from $85 to $600 among tracked estimates, reflects structurally different companies being modelled rather than disagreement about the same set of facts; analysts in the bear camp are pricing an auto manufacturer while bulls are pricing a robotics and AI platform.
The next 18 months will deliver the most informative execution data investors have had in years. Optimus Gen 3 production begins in Summer 2026. Robotaxi is live in Texas and expanding. Free cash flow is negative as capital is deployed at unprecedented scale. Each milestone met or missed will shift the probability distribution between bull and bear.
The methodology described in this guide, constructing explicit scenarios, triangulating frameworks, and stress-testing entry price, equips readers to make that call based on their own probability assessments and return requirements. The market will eventually resolve the debate. The price paid before that resolution is the one variable entirely within each investor’s control.
This article is for informational purposes only and should not be considered financial advice. Investors should conduct their own research and consult with financial professionals before making investment decisions. Past performance does not guarantee future results. Financial projections discussed in this article are subject to market conditions and various risk factors.
Stock valuation analysis is the process of estimating a company's fair value by examining financial metrics, growth assumptions, and risk factors across multiple frameworks such as discounted cash flow, earnings multiples, and total addressable market models. It matters because the price paid at entry is the single most controllable variable in determining whether an investment delivers adequate returns.
For transitional companies, single metrics like P/E ratios are incomplete because they only reflect current earnings rather than future potential. Analysts use multiple frameworks simultaneously, including DCF analysis, multiple expansion modelling, and TAM-based optionality frameworks, then triangulate results to build explicit bull and bear scenarios with specific numerical inputs for revenue growth, margins, and valuation multiples.
The same future outcomes and scenario probabilities produce dramatically different returns depending solely on the price paid at entry. At Tesla's current price of around $428, the bear case produces negative returns, meaning every dollar paid above that level is a bet that the transformation into an AI and robotics platform succeeds.
A discounted cash flow model estimates intrinsic value by projecting future cash flows and discounting them back to the present using a weighted average cost of capital. Its main limitation for transitional companies is sensitivity: shifting the WACC by just one percentage point can move Tesla's implied intrinsic value by tens of billions of dollars, meaning small assumption changes produce enormous output swings.
Analysts define explicit numerical assumptions for revenue growth, profit margins, and valuation multiples under each scenario, then assign a probability to each outcome and calculate a probability-weighted blended fair value. For Tesla, the full bull case is estimated at roughly 5-10% probability of complete materialisation, which directly informs how much capital an investor should commit at the current price.


