
What Tesla’s Valuation Teaches About Buying High-Multiple Stocks
2 mins ago

At roughly $428 per share in May 2026, Tesla’s stock embeds a specific and consequential bet: that a company currently earning margins closer to a mid-tier automaker will transform into an AI and robotics platform generating software-like profitability. Whether that bet pays off depends almost entirely on which scenario materialises, and how much the buyer paid to make it.
Tesla’s Q1 2026 earnings, reported on 22 April 2026, crystallised a valuation challenge that is not unique to one company. When a business is in genuine transition, standard valuation tools struggle because the company an investor owns today is not the company the stock price is pricing in for tomorrow. Wall Street price targets for Tesla range from $131 to $826, a dispersion that has nothing to do with disagreement about Q1 results and everything to do with disagreement about which future business model will exist in 2030.
This guide uses Tesla’s bull and bear case numbers as a concrete teaching tool. Readers will learn how to construct scenario-based valuation frameworks, understand why entry price is one of the most consequential variables in any investment, and walk away with a repeatable methodology for evaluating any transition-stage company.
No single valuation framework can capture what Tesla is. The company simultaneously operates as three distinct businesses, each of which warrants a completely different analytical treatment:
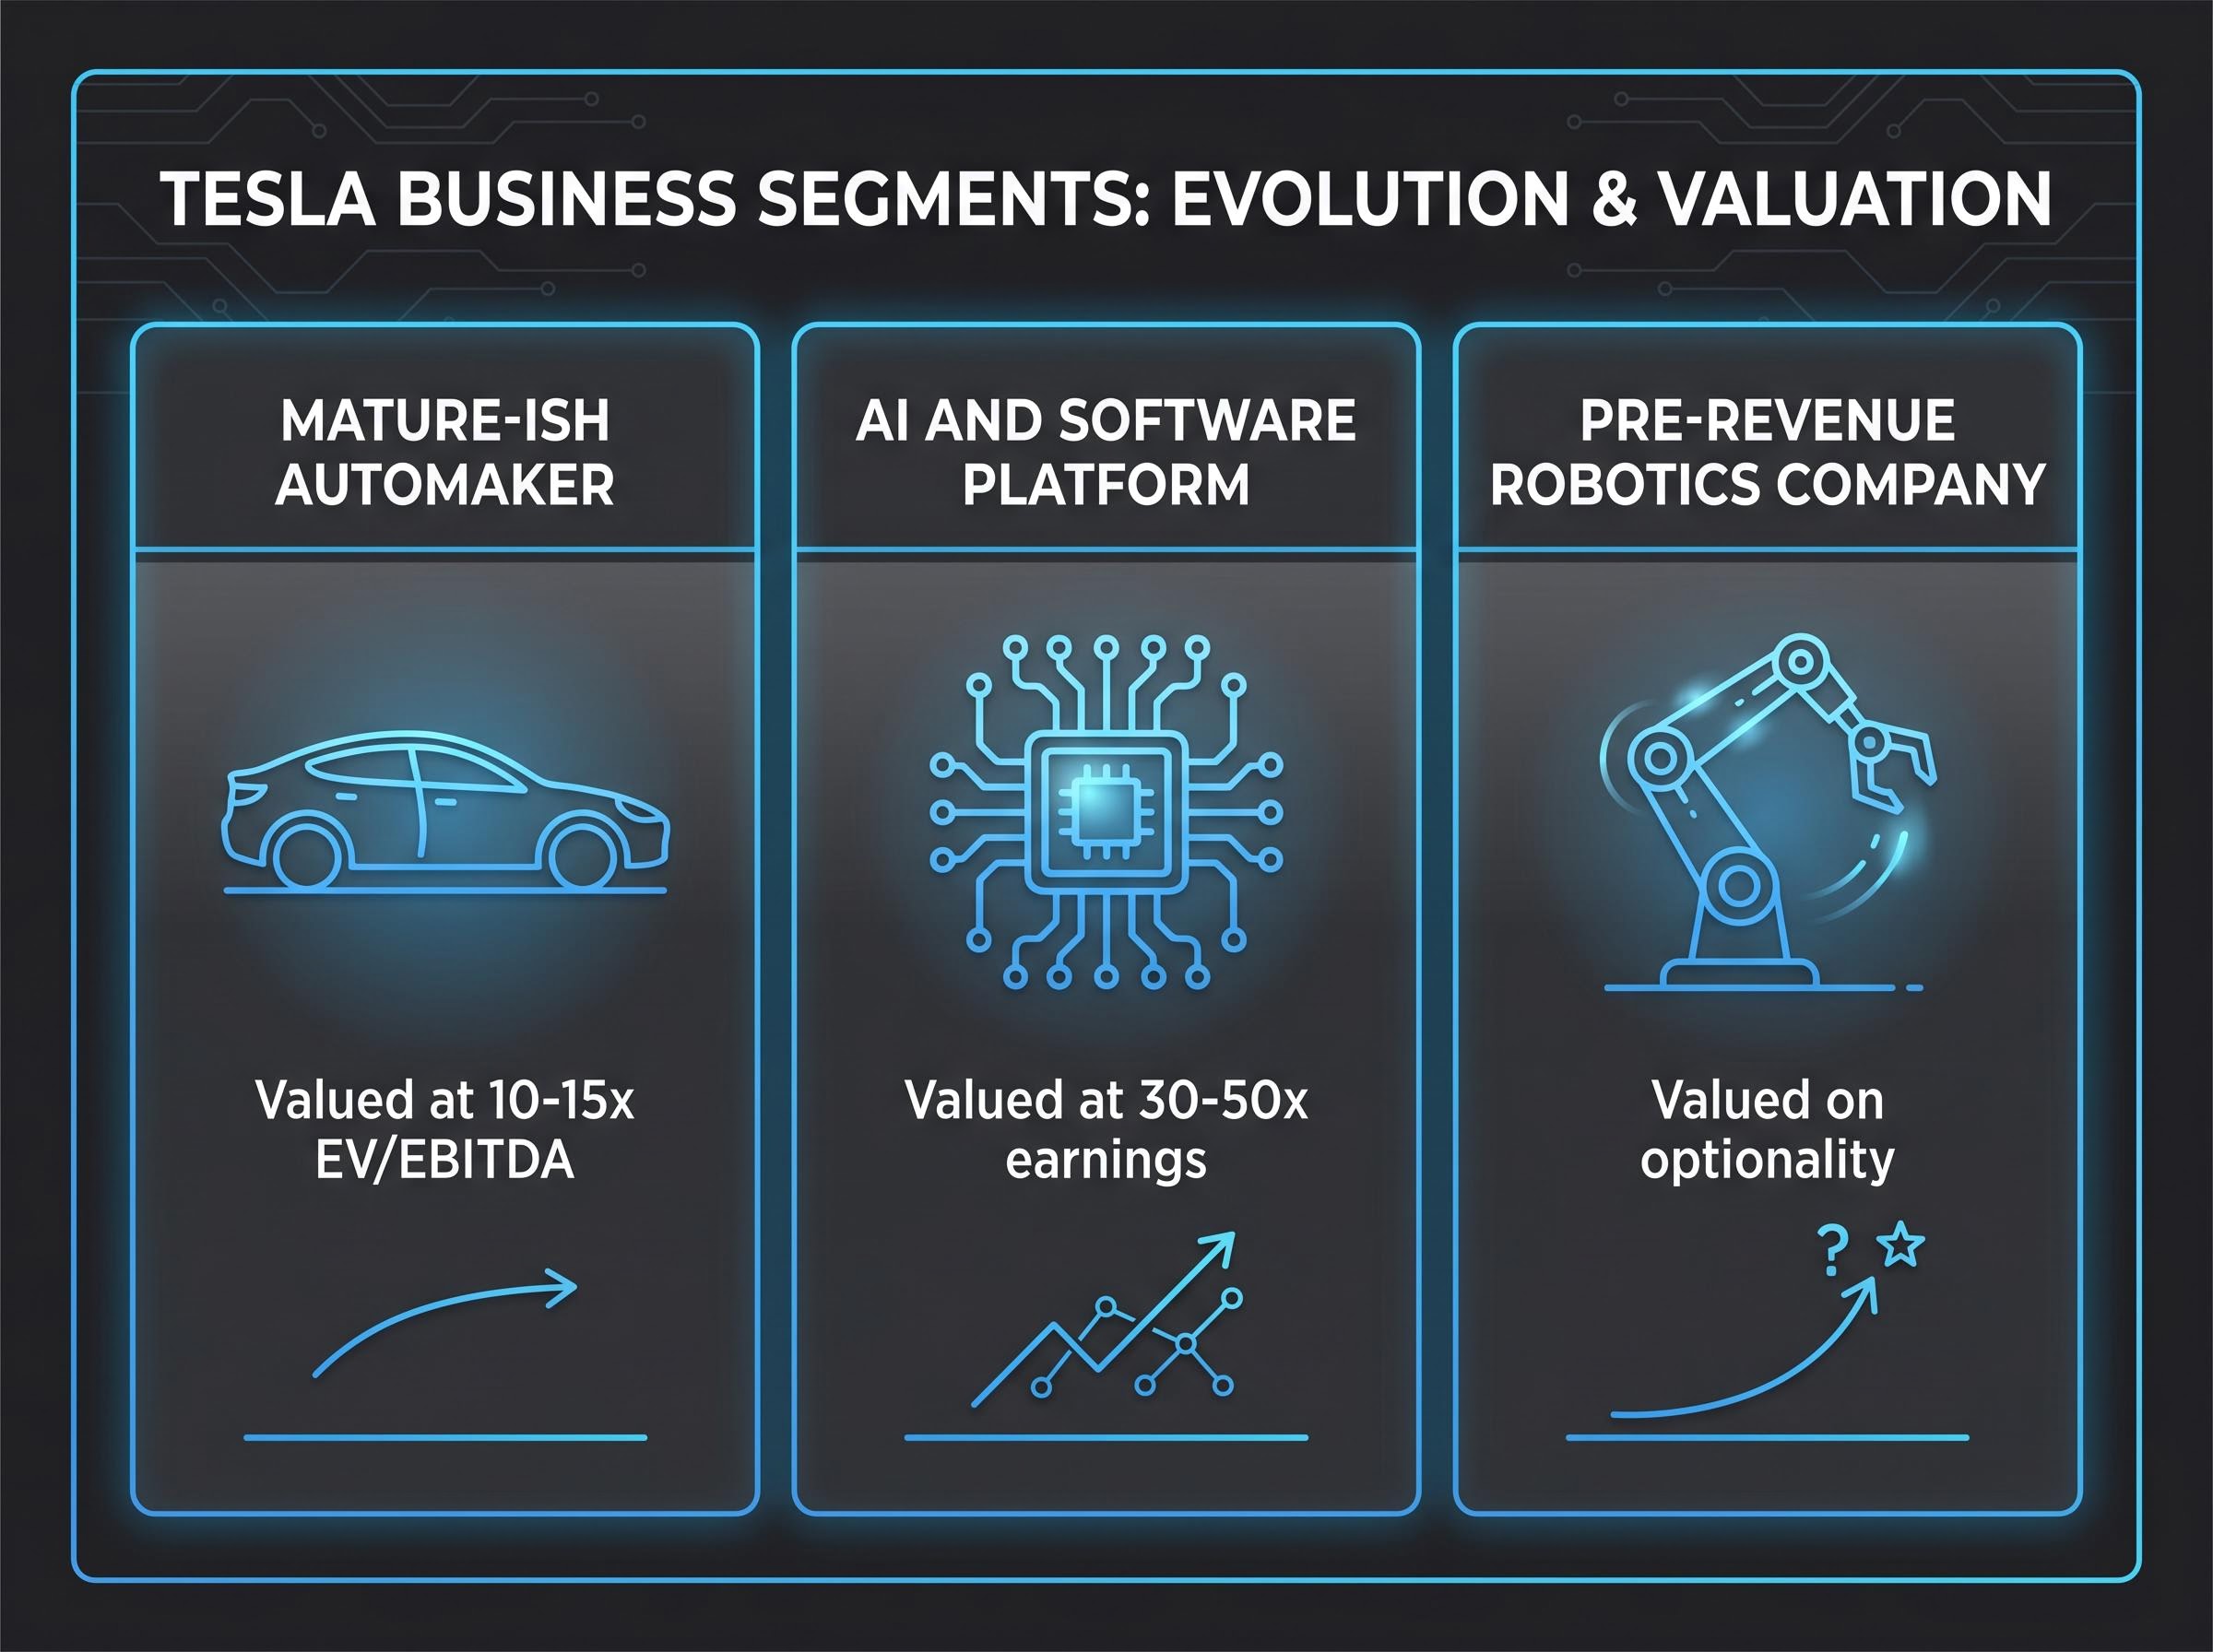
The weighting an analyst assigns across those three lines determines almost the entire valuation outcome. No consensus weighting exists. Adam Jonas at Morgan Stanley illustrates this perfectly: his bull case prices Tesla at $826, his bear case at $131, and his base target sits at $415. The same analyst, the same financial statements, and yet a spread of nearly $700 per share.
The $131 to $826 price target range is not a failure of research. It is an accurate reflection of scenario-weighted uncertainty, and it maps directly onto real ambiguity in the business.
Q1 2026 added texture to both sides of this debate. Gross margin came in at approximately 18.5%, compressed from prior levels of 23-25% and remaining below the peak range. That compression supports the bear case. Yet Tesla’s $25 billion-plus planned 2026 capital expenditure commitment generates near-term negative free cash flow regardless of scenario, a fact that bears cite as dilutive to earnings per share. The valuation challenge is structural, not a gap in available data.
A discounted cash flow model converts a company’s expected future earnings into a present value. For a transition-stage company, this process has four steps:
Sum-of-the-parts analysis complements the probability-weighted DCF by assigning each business line its own peer-appropriate multiple before blending them into a consolidated value, a method that makes the difference between an automotive multiple and a software multiple visible as a dollar figure rather than an abstract assumption.
CFA Institute cost of capital guidance establishes that WACC for high-growth disruptors typically carries a risk premium above investment-grade benchmarks, reflecting elevated share price volatility and the structural uncertainty that defines transition-stage businesses, which is precisely why a three-percentage-point shift in the discount rate can move implied value by more than $100 per share at current growth assumptions.
| Scenario | Revenue Growth | Net Margin | Multiple | Probability Weight |
|---|---|---|---|---|
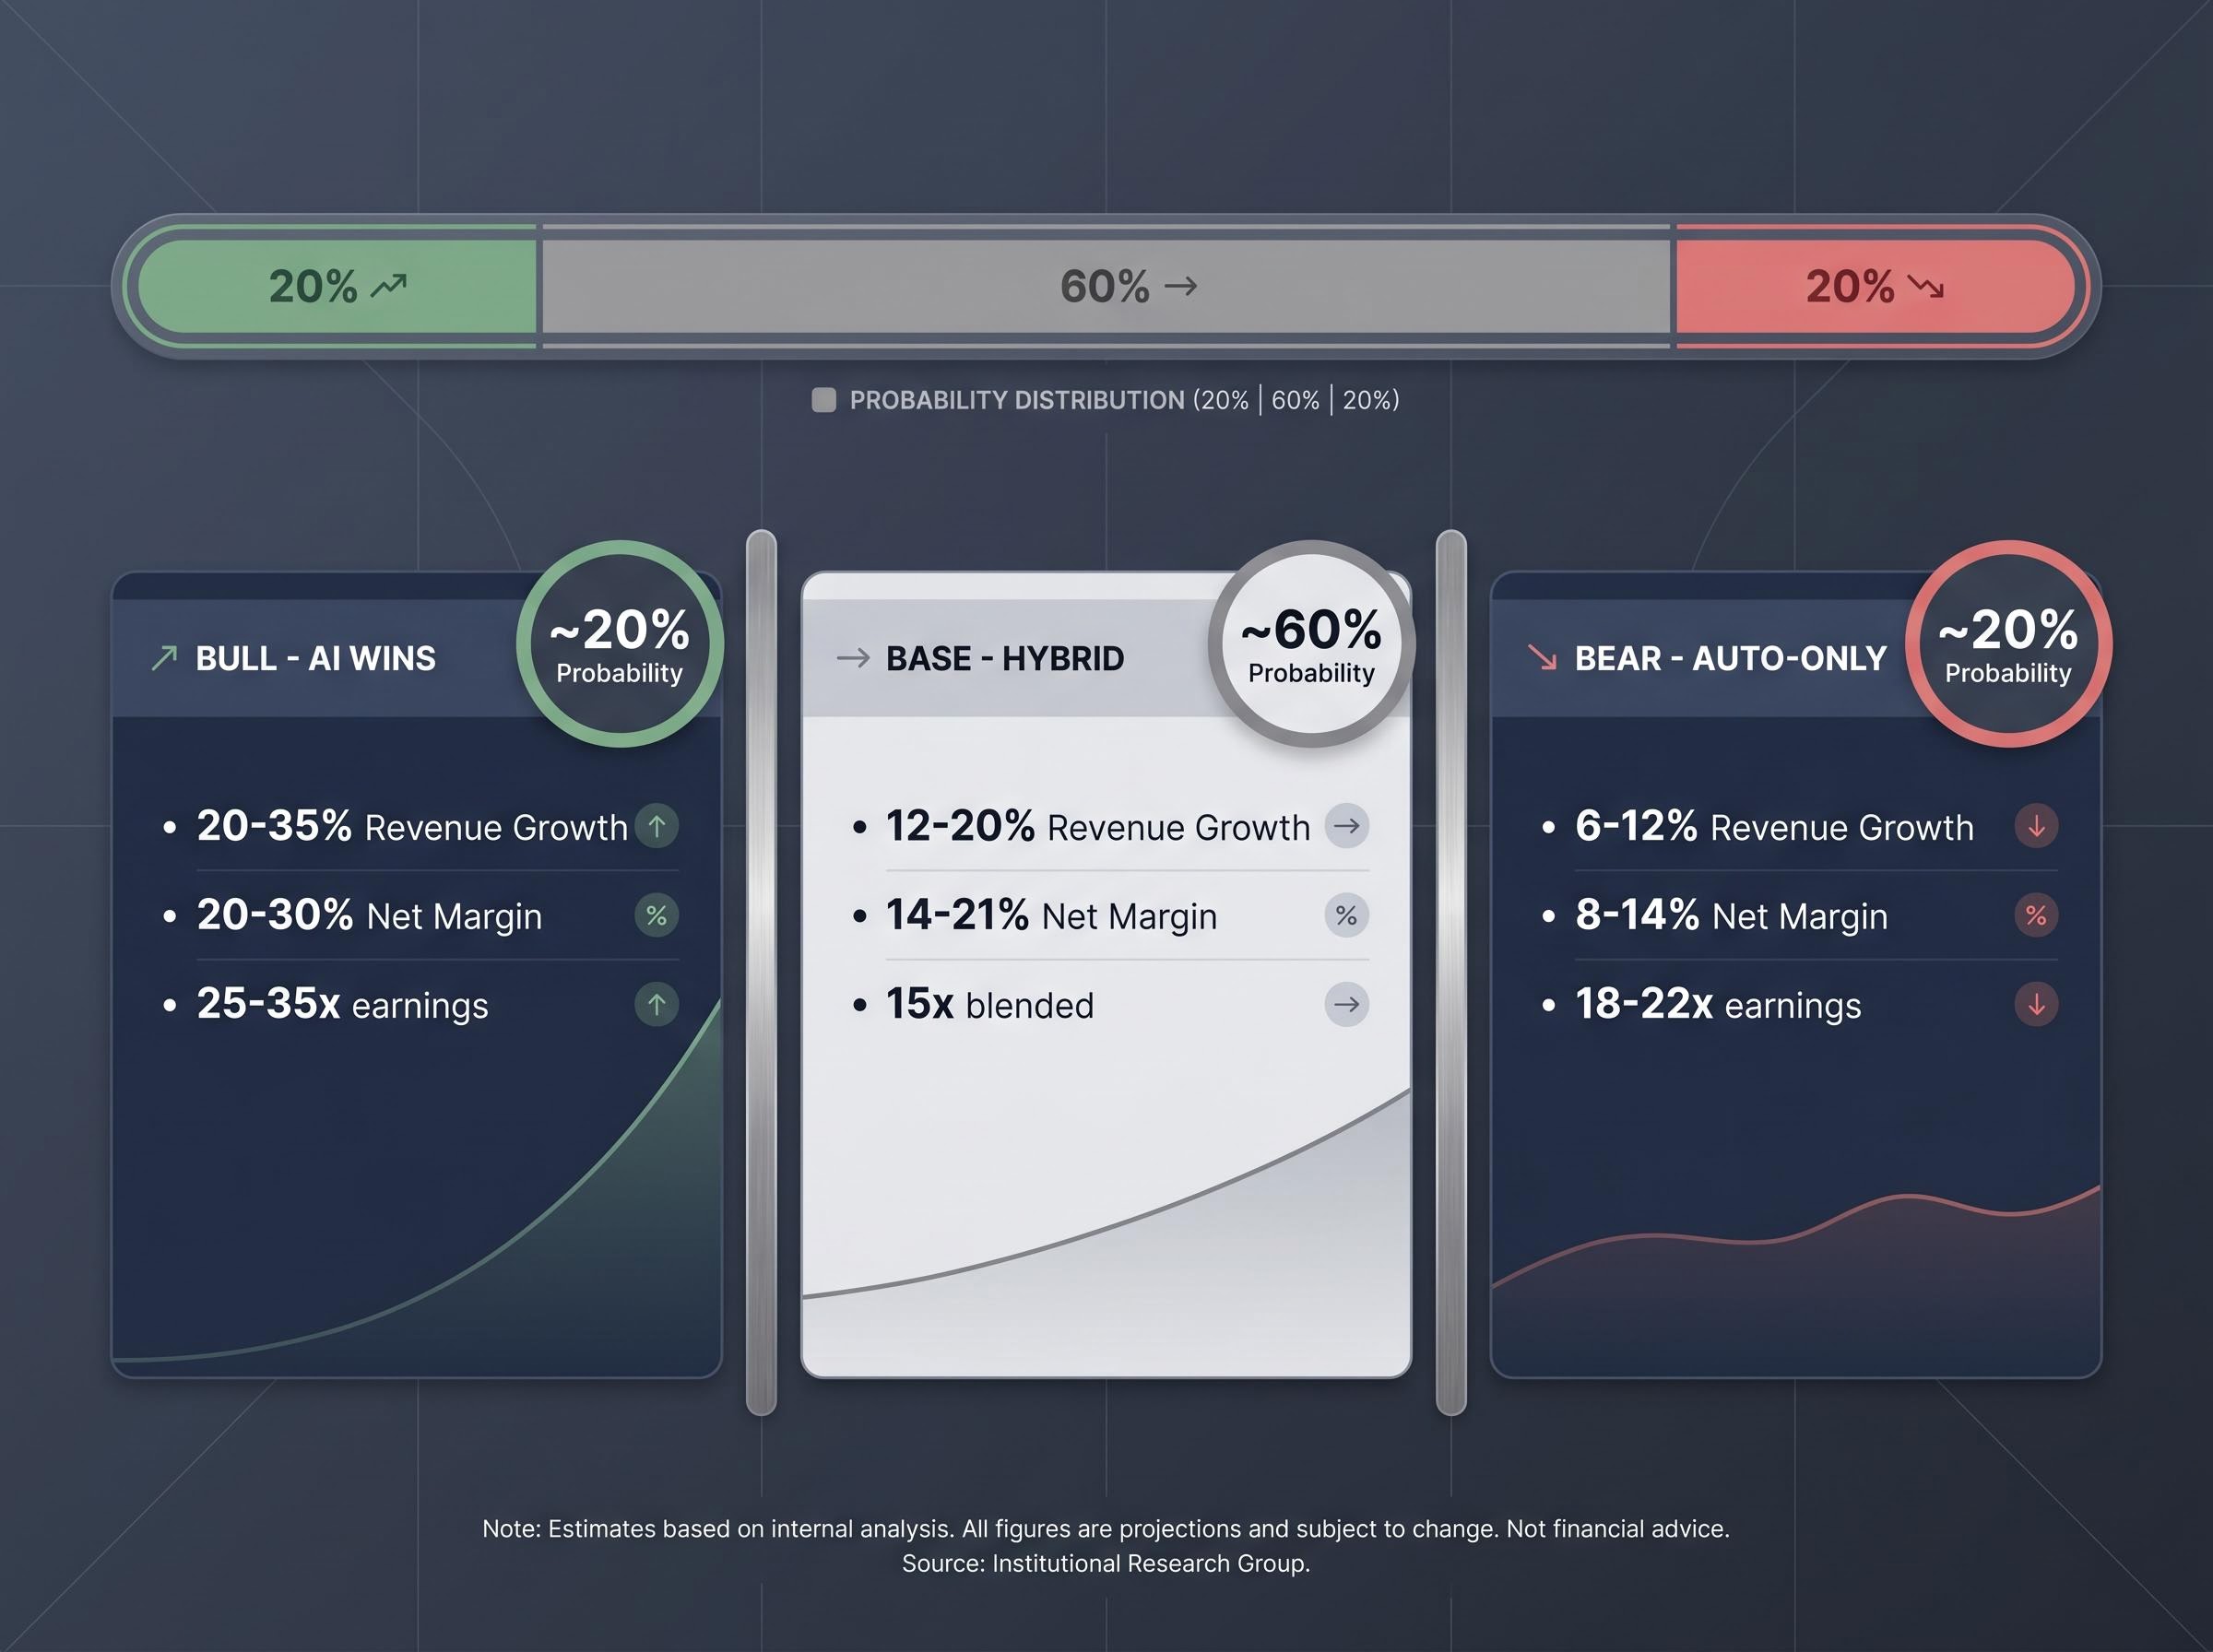
| Bull (AI wins) | 20-35% annually | 20-30% | 25-35x earnings | ~20% |
| Base (hybrid) | 12-20% annually | 14-21% | 15x blended | ~60% |
| Bear (auto-only) | 6-12% annually | 8-14% | 18-22x earnings | ~20% |
Probability-weighting is more honest than a point estimate for companies with bifurcated futures. Two analysts looking at identical financial statements can arrive at valuations hundreds of dollars apart because they weight the AI scenario at 20% versus 50%. The framework makes that disagreement visible rather than hiding it behind a single target price.
A reverse DCF methodology inverts the standard approach by starting with the current share price and solving for the implied growth rate the market is already pricing in, revealing whether those embedded assumptions are realistic or demand near-perfect execution to justify.
The bull case is not a prediction. It is a conditional logic chain, and each link must hold for the full valuation to materialise. The specific conditions required:
Under these conditions, bull case revenue growth ranges from 20% to 35% annually (midpoint approximately 27%), net profit margins expand to 20-30% (versus current 7-10%), and the appropriate valuation multiple shifts to 25-35x earnings, reflecting an AI and software framework rather than an automotive one. Estimated annualised returns under full bull materialisation: approximately 11-35% over 10 years.
At full bull materialisation, estimated annualised returns range from 11% to 35% over a decade. That is the reward side of the equation.
One variable deserves particular attention: Elon Musk’s historical relationship with timelines. The core innovations have tended to materialise, but consistently later and at lesser initial scale than originally announced. In 2016, Musk claimed full-autonomy hardware was ready. In 2019, he projected one million robo taxis by end of 2020. In 2021, he projected Optimus deployment readiness in 2022. Each timeline slipped significantly. A bull case buyer is making a bet not just on whether these conditions are met, but on when.
The bear case defines Tesla as a strong electric vehicle company with above-average automotive margins but without meaningful AI or robotics revenue contribution by 2030. The company continues to sell vehicles, maintains market share, and operates profitably, but the transformation that the stock price currently embeds does not arrive at scale.
Bear case assumptions: revenue growth of 6-12% annually (midpoint approximately 9%), net margins of 8-14%, and valuation multiples of 18-22x earnings, an auto-adjacent framework rather than a technology one. The competitive dynamics underpinning this scenario are structural, not speculative:
The regulatory permit gap between Waymo and Tesla is concrete and current: Waymo completed over 250,000 weekly rides on a commercial driverless authorisation while Tesla held no equivalent permit in California as of the reporting period, a measurable competitive asymmetry that directly weights the near-term probability of autonomous revenue materialising.
| Variable | Bull Case | Bear Case |
|---|---|---|
| Revenue Growth (Annual) | 20-35% | 6-12% |
| Net Margin | 20-30% | 8-14% |
| Valuation Multiple | 25-35x earnings | 18-22x earnings |
| Implied 10-Year Return | ~11-35% annualised | Negative at current price |
| Probability Weight | ~20% | ~20% |
Under bear case assumptions, every projected 10-year return outcome is negative at the $375-$428 per share price range. The stock’s current price already embeds the AI and robotics transformation as a near-certainty.
This is the bear case’s most important lesson, and it applies far beyond Tesla: a good company and a good investment are not the same thing. The current price of a stock reflects what the market expects, not just what the company is doing today.
A few years ago, Tesla traded near $100 per share. In May 2026, the stock sits near $428, having approached $450 at its peak. The company is the same. The return profiles for a buyer at those two price points are not.
At $100, the bear case still produced acceptable returns because the stock embedded minimal transformation premium. At $428, the bear case produces negative returns because the price already prices in AI and robotics success. The margin of safety has compressed almost entirely. Forward analyst earnings per share estimates project growth of more than 5x from current levels (incorporating expected autonomy contributions), but those estimates declined more than 90% from their peak before recovering in forward projections, illustrating how much uncertainty sits beneath the consensus.
Institutional positioning reflects this tension. Vanguard increased its Tesla position to approximately 210.8 million shares (5.61% of shares outstanding) as of Q1 2026, signalling continued conviction at current levels among the largest passive holders. Yet the Seeking Alpha consensus leans toward “Hold” at current prices given the risk-to-reward balance following the post-earnings run-up.
A price of $428 with negative bear case returns and 11-35% bull case returns mathematically implies the market is assigning the bull or near-bull case a high probability weight. The base case alone, at 15x blended multiples, does not support this price level without incorporating meaningful autonomy or robotics revenue.
Before buying at this level, any investor should answer one question: do they agree with that implied probability assignment? If the answer is yes, the position may be warranted. If the answer is uncertain, the entry price framework suggests waiting for a lower price that offers a wider margin of safety, or sizing the position to reflect the uncertainty.
Entry price discipline is the single most controllable variable in any investment. Even if Tesla’s AI transition succeeds, a buyer at $428 earns structurally lower returns than a buyer at $100. This principle applies to every transition-stage company an investor will ever evaluate.
The Tesla case study illustrates a methodology that transfers directly to any company whose stock price embeds a future business model that does not yet exist. Three principles emerge:
Aswath Damodaran’s “narratives plus numbers” approach connects these steps. The narrative identifies which conditions need to be true. The numbers quantify what those conditions are worth. The scenario weighting produces a probability-adjusted value to compare against the current price. His reference framework (base case at approximately 15x blended multiple, bull at 40x AI multiples, bear at 8x EV/Sales) provides a starting point that investors can then adjust based on their own assessment of condition probabilities.
Damodaran’s narratives and numbers framework formalises the principle that a coherent investment thesis must pair a conditional story about what a company will become with quantified estimates of what each condition is worth, ensuring that the valuation output is only as credible as the specific assumptions that drive it.
Scenario analysis does not eliminate uncertainty. It structures it. That is a fundamentally different and more useful relationship with risk than either confident prediction or paralysis.
Two caveats apply. Tesla’s $25 billion-plus capex creates near-term free cash flow compression across all scenarios, meaning even the bull case does not resolve quickly. And the regulatory gap (no California commercial autonomous vehicle permits filed as of the reporting period) illustrates the distance between narrative and execution that scenario analysis is specifically designed to capture.
This article is for informational purposes only and should not be considered financial advice. Investors should conduct their own research and consult with financial professionals before making investment decisions. Past performance does not guarantee future results. Financial projections are subject to market conditions and various risk factors. Forward-looking statements regarding Tesla’s potential revenue, margins, and business model outcomes are speculative and subject to change based on market developments and company performance.
Scenario-based DCF valuation projects free cash flows under multiple outcomes (bull, base, and bear), discounts them to present value using a weighted average cost of capital, and then assigns a probability to each scenario to produce a single expected value, making uncertainty visible rather than hiding it behind one point estimate.
Entry price is one of the most consequential variables in any investment because a higher purchase price compresses future returns across every scenario; for example, a Tesla buyer at $100 per share faced acceptable bear case returns, while a buyer at $428 faces negative returns under the same bear case assumptions because the higher price already embeds AI and robotics success.
The bull case requires Full Self-Driving to achieve regulatory approval at commercial scale, Optimus to generate meaningful commercial revenue by 2029, gross margins to recover to 25% or higher, and Cyber Cab production to proceed on schedule, with each condition representing a distinct link in the valuation logic chain.
A reverse DCF starts with the current share price and works backward to determine the implied growth rate the market is already pricing in, helping investors assess whether embedded assumptions are realistic or require near-perfect execution to justify.
Probability weighting assigns a likelihood to each scenario (for example, approximately 20% bull, 60% base, and 20% bear as used by NYU Stern's Aswath Damodaran) and blends the resulting valuations into a single expected value, making disagreements about scenario probabilities visible as a dollar figure rather than an abstract assumption.


