
How to Value a Stock When Its Future Looks Nothing Like Today
27 mins ago

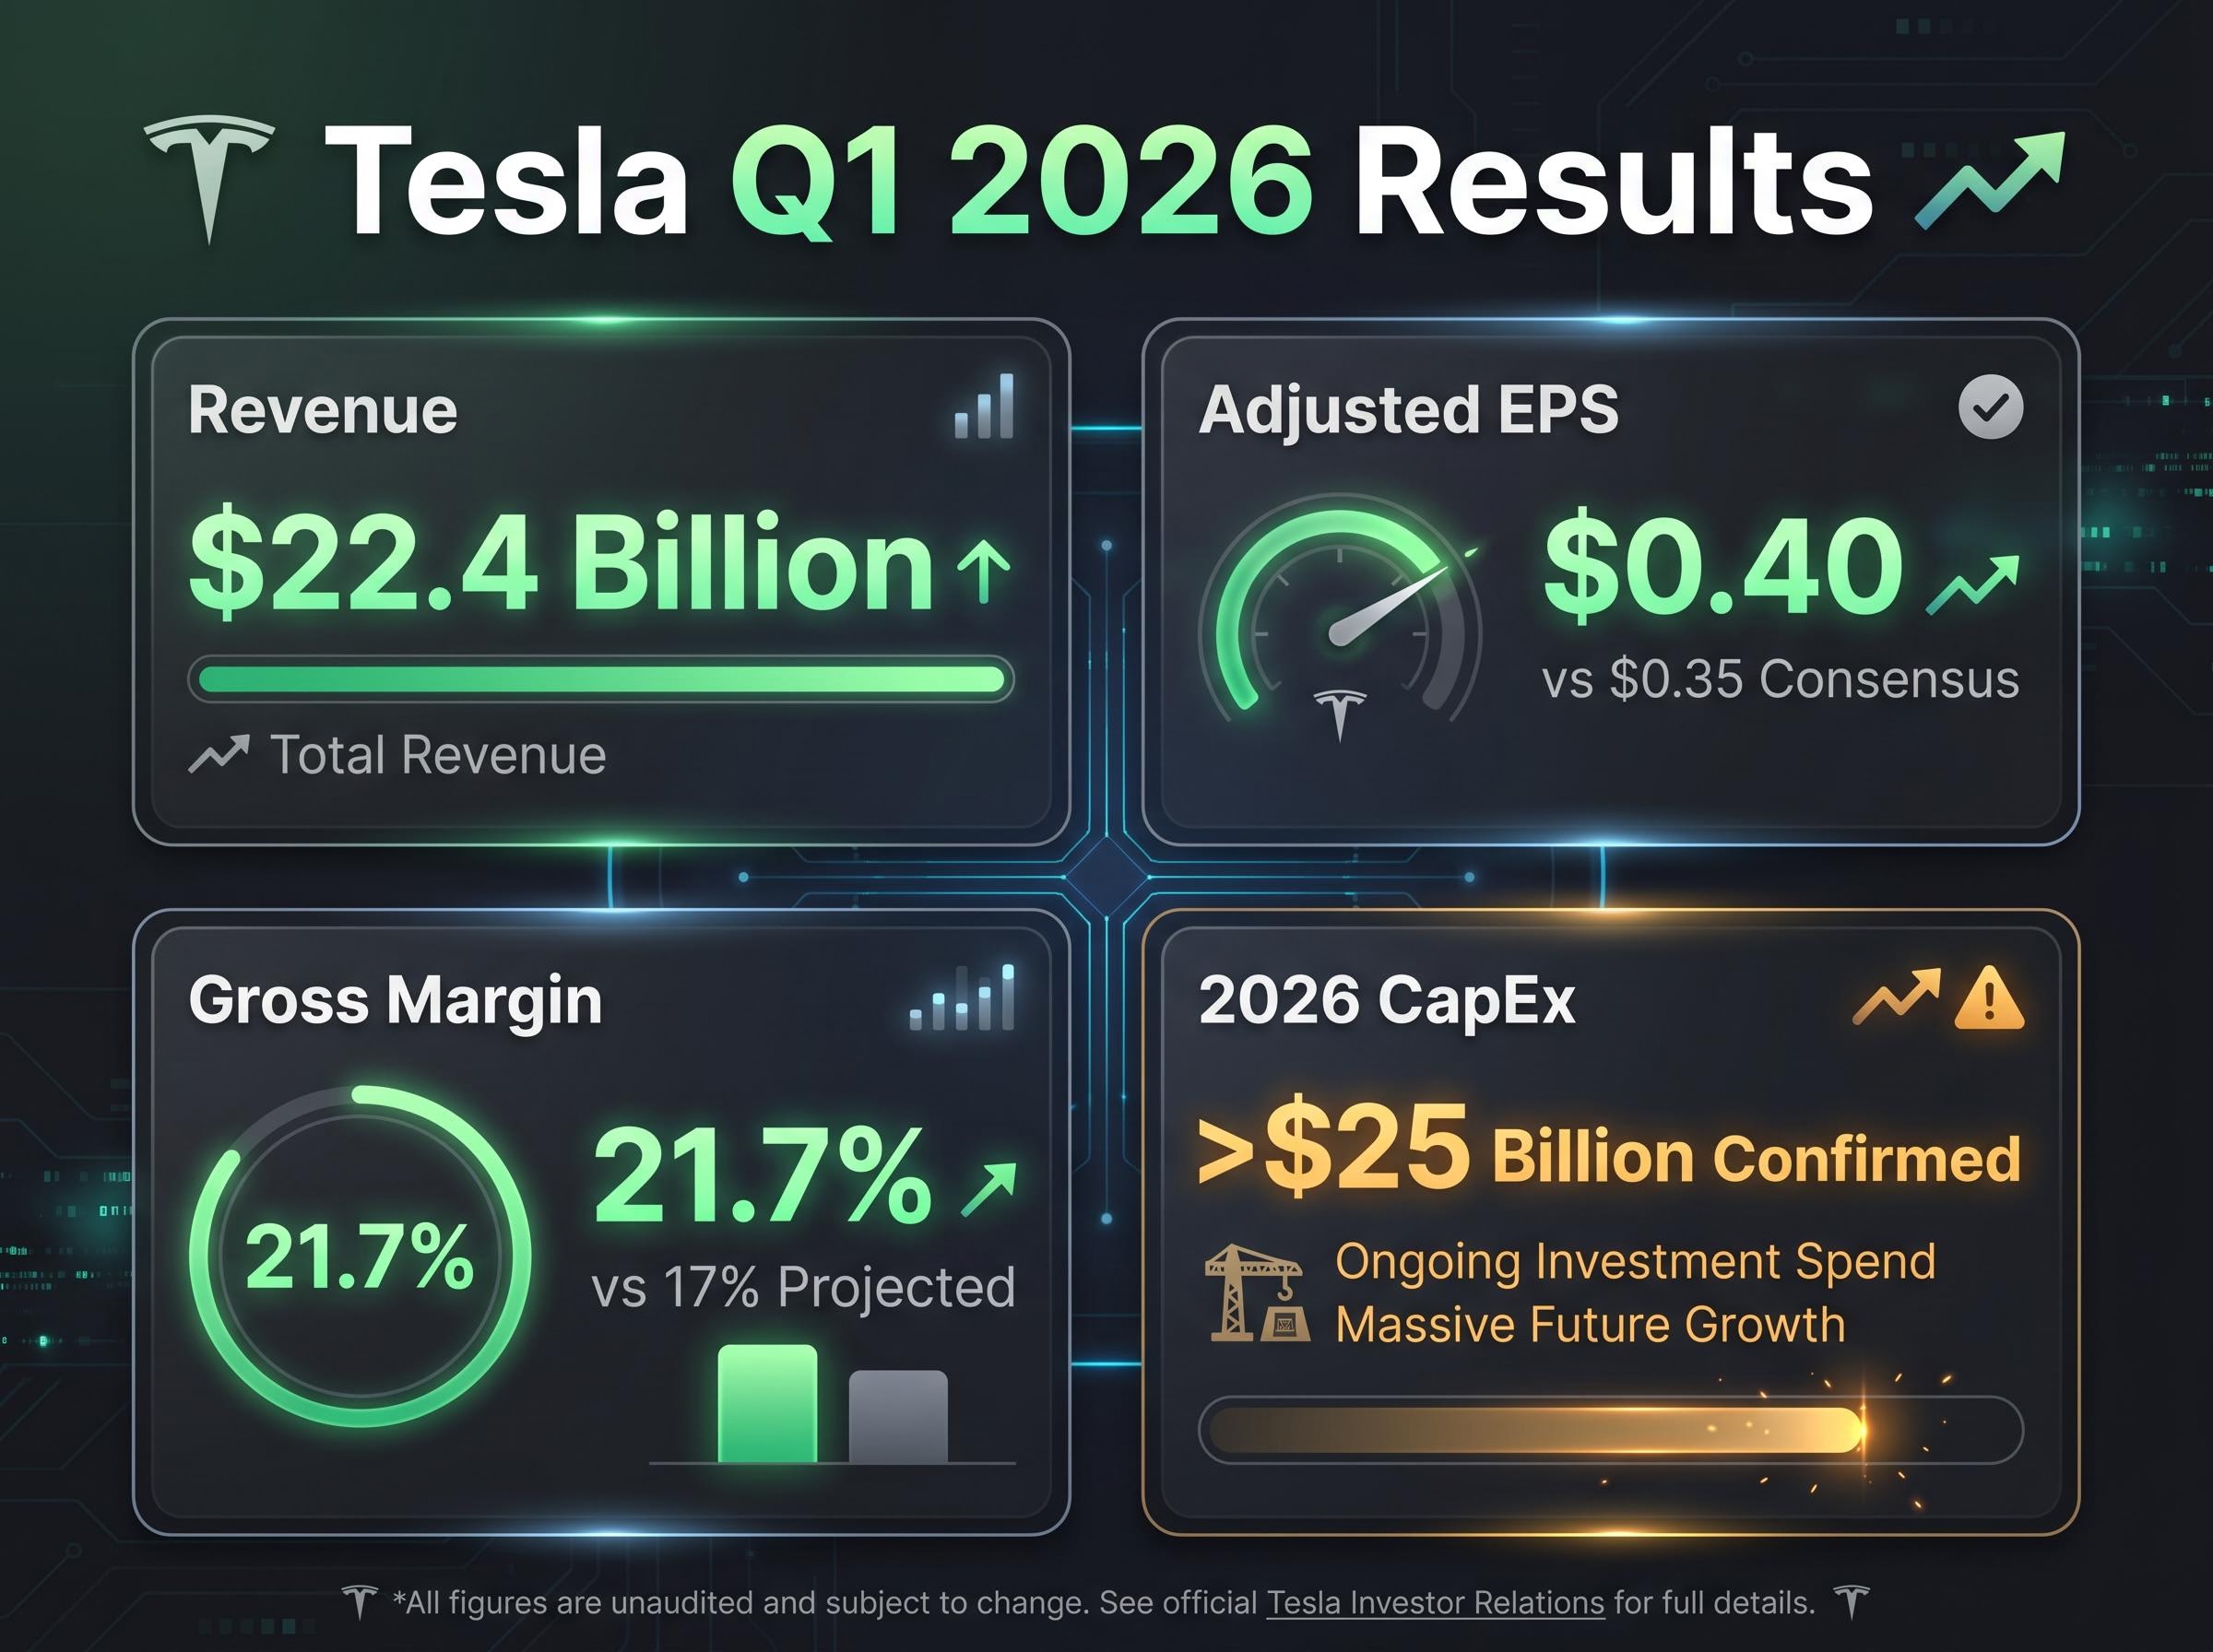
Two equally rigorous analysts can examine Tesla’s publicly reported financials and arrive at fair value estimates separated by hundreds of dollars per share. The gap is not a failure of stock valuation analysis; it is the analysis. When Tesla reported Q1 2026 earnings on 22 April 2026, the numbers crystallised this tension. Revenue of $22.4 billion and a 21.7% gross margin beat consensus estimates, temporarily lifting optimism. Then the countervailing signal arrived: CFO confirmation of more than $25 billion in 2026 capital expenditure, a reminder that the company is spending aggressively toward a future that has not yet materialised. This article uses Tesla’s reported figures and analyst scenario models as a live classroom. By the end, readers will understand how to structure bull and bear case scenarios, identify the variables driving the widest return divergence, and recognise why the price paid at entry is one of the most consequential decisions in any investment thesis.
A single-point discounted cash flow model or a price-to-earnings multiple borrowed from comparable companies works well for businesses with a stable identity. For a company mid-transition between a known core and an unproven future, these tools can produce a precise answer to the wrong question.
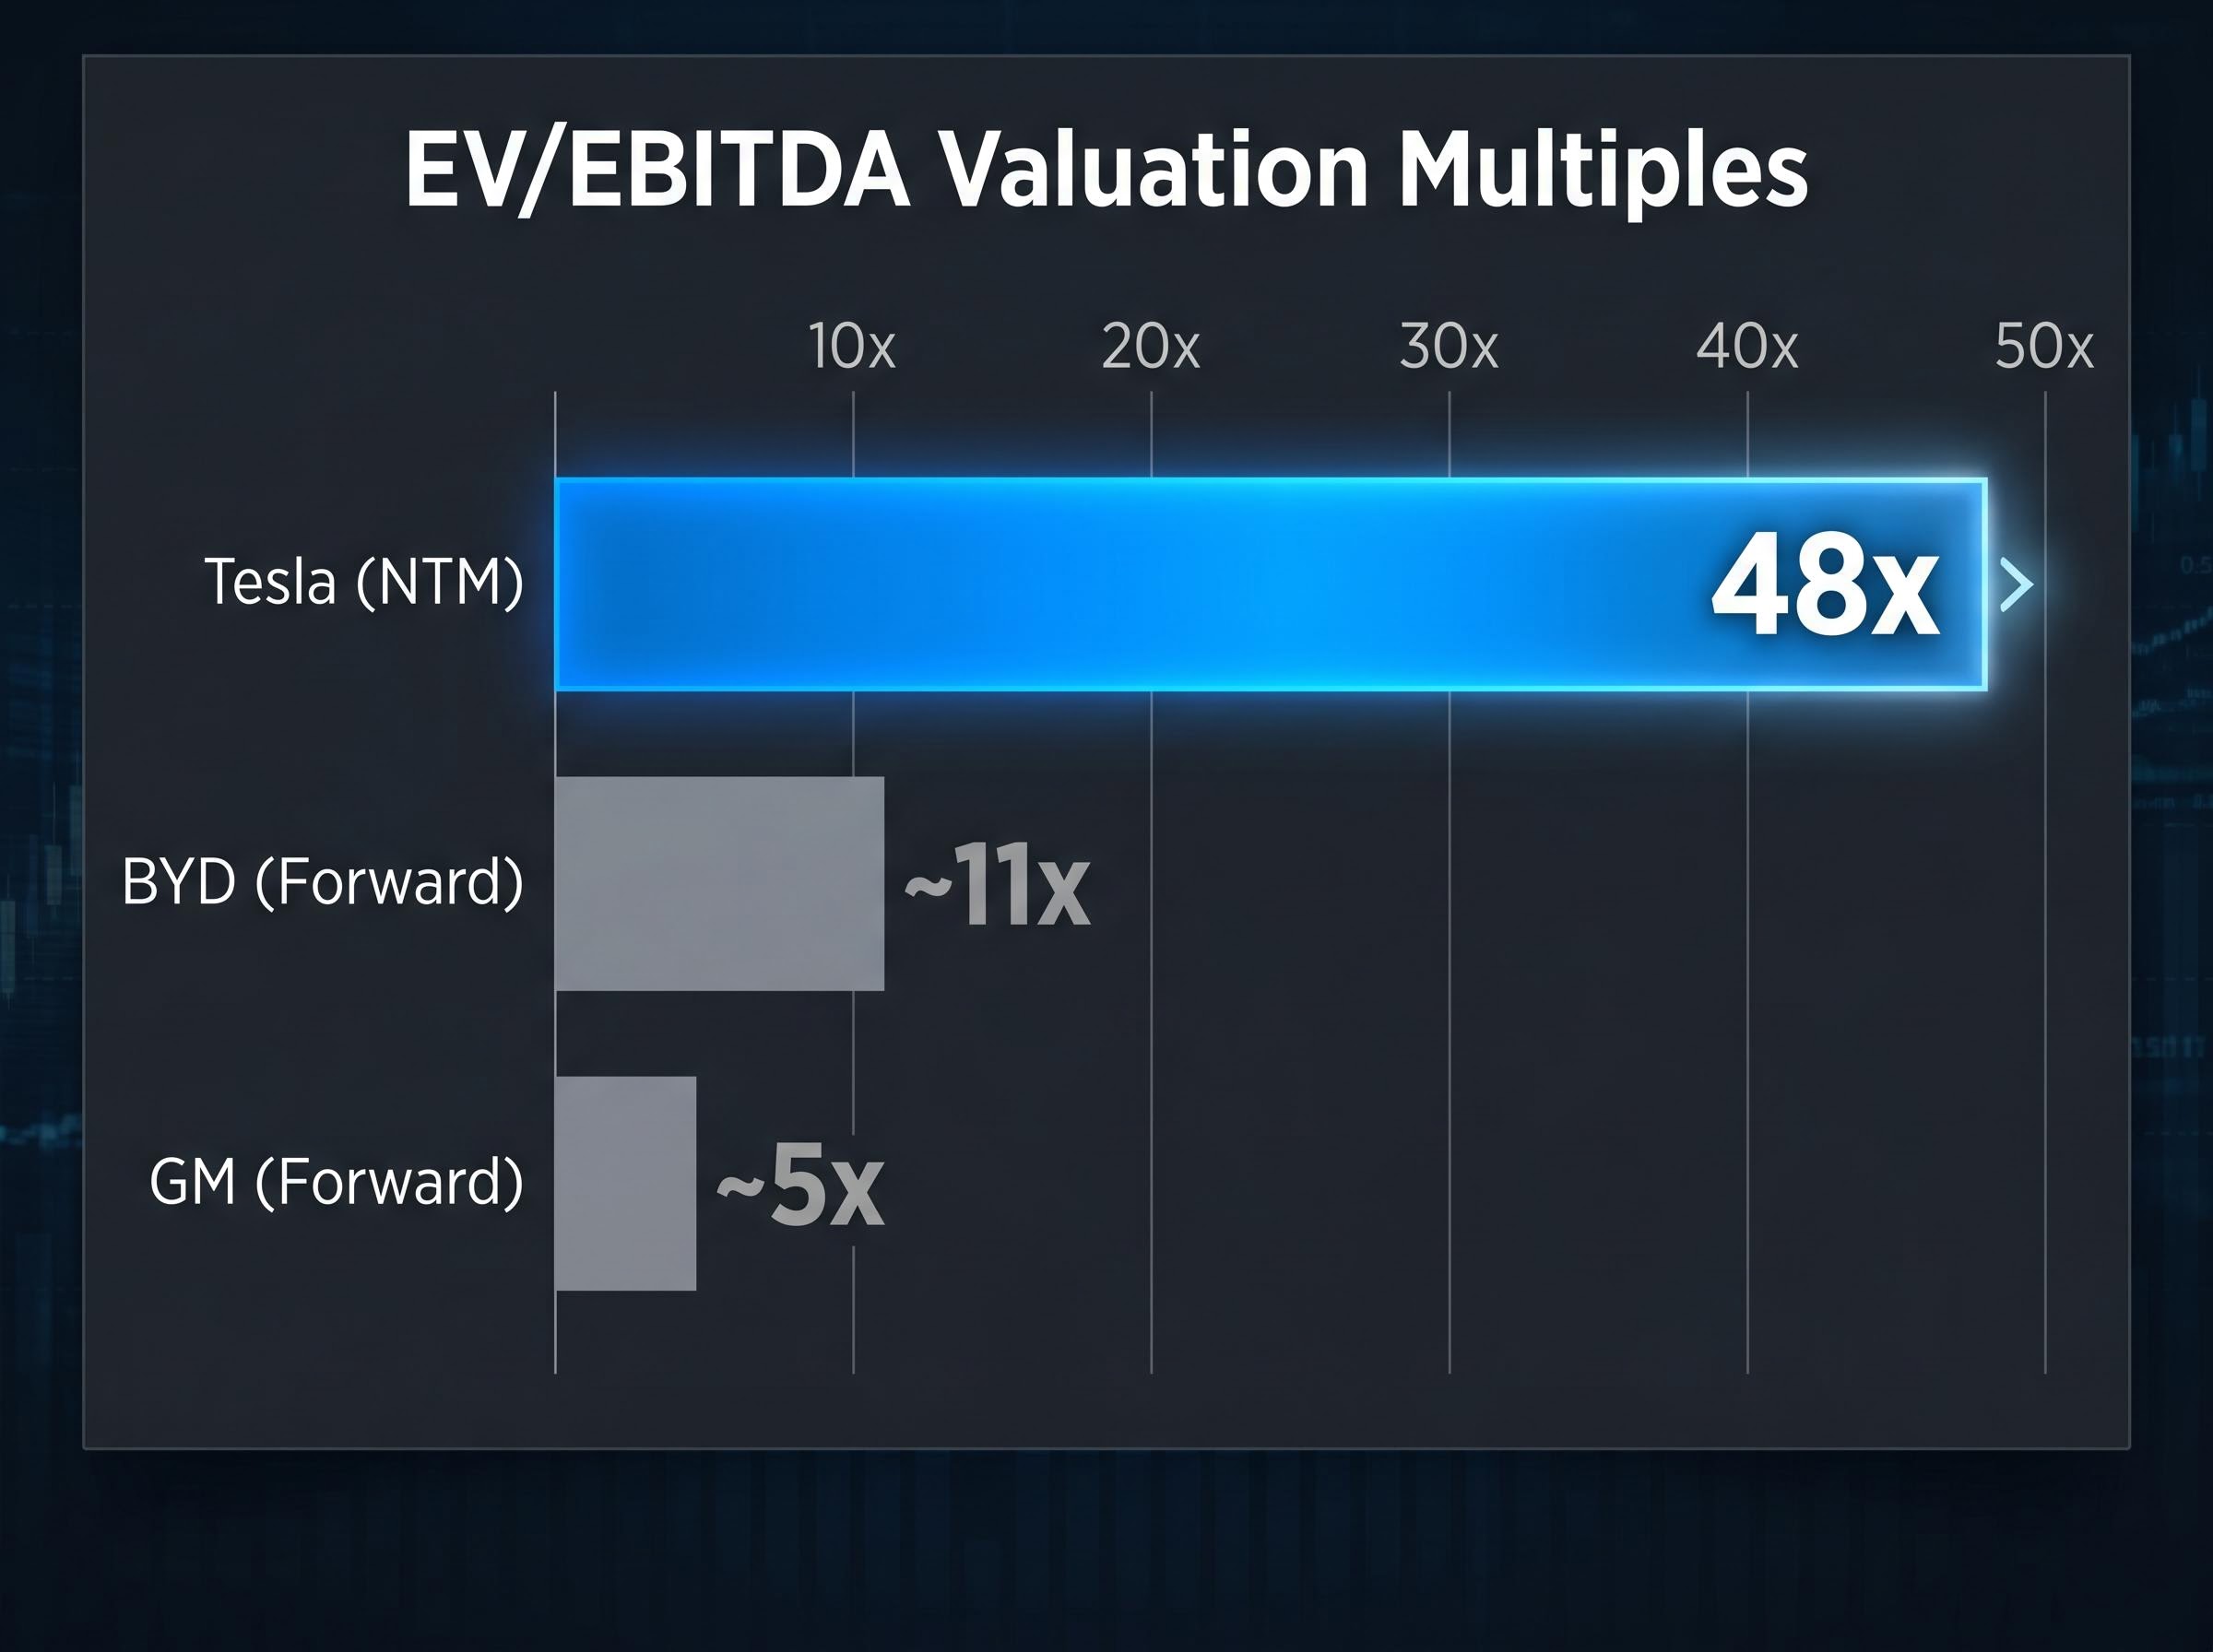
The problem is concrete. Applying traditional auto sector multiples to Tesla (where BYD trades at approximately 11x forward EV/EBITDA and GM at approximately 5x) produces a radically different valuation than applying software or platform multiples. Tesla’s next-twelve-month (NTM) EV/EBITDA sits at approximately 48x. Neither approach is obviously wrong because the answer depends on which company the analyst believes they are valuing.
The challenge of growth stock valuation is most visible when a company’s forward earnings multiple sits more than twelve times above the sector average, as Tesla’s does, because the multiple is no longer describing the existing business but pricing a future one that has not yet appeared in any financial statement.
Standard comparable analysis breaks down under three specific conditions:
Damodaran’s valuation framework for growth companies establishes that standard DCF techniques routinely produce unrealistic outputs when applied to businesses with limited operating history and earnings that do not yet reflect long-term margin potential, precisely the conditions that define transitional companies like Tesla.
Consider how quickly the underlying data can shift. Analysts had projected Tesla’s gross margin at 17% for Q1 2026. The reported figure was 21.7%, a gap wide enough to rewrite the output of any model built on the prior assumption. The CFO’s confirmation of more than $25 billion in 2026 CapEx compounds the uncertainty: the scale of transition investment makes the eventual margin structure genuinely unknowable from current data alone.
“Which company are you valuing: the one that exists today, the one management says will exist in five years, or some probability-weighted version of both?”
That question must come before the model. The tool selection itself is a judgement call, and investors who skip the framing question risk producing spreadsheet precision built on an unexamined premise.
Scenario-based valuation is not a black box reserved for institutional desks. It is a structured reasoning process that can begin on a legal pad before a spreadsheet opens. The following six steps apply to any company where the range of plausible outcomes is too wide for a single estimate to be meaningful.
A brief note on multiples: NTM (next twelve months) multiples use forward earnings estimates and are more relevant for high-growth companies because they capture expected trajectory. LTM (last twelve months) multiples use trailing actuals and are more reliable but backward-looking. For transitional companies, NTM is the more common reference point, though it introduces an additional layer of uncertainty because the forward estimates themselves are assumption-dependent. Small changes in the terminal growth rate or discount rate within a DCF can produce dramatically different outputs, which is precisely why scenario ranges matter more than point estimates.
Most investors skip this step. Leaving probabilities implicit feels easier because it avoids the discomfort of committing to a number. But implicit probabilities do not disappear; they simply allow confirmation bias to fill the gap silently.
When an analyst assigns a 60% probability to a base case, a 30% probability to a bear case, and a 10% probability to a bull case, the assumptions become visible and debatable. Consensus mean price targets reflect implicit probability weighting across a population of analyst views. The discipline is making personal weighting explicit before consulting the consensus, not after.
Defining monitoring triggers before purchase, such as auto gross margin thresholds, robotaxi regulatory filings, and capital expenditure efficiency ratios, converts a static scenario model into a living investment thesis where each quarterly report either confirms or degrades the assigned probabilities.
The bull case for Tesla is not a sentiment exercise. It is a structured set of interlocking assumptions, and each one must prove true for the optimistic outcome to materialise.
At the centre sits the revenue growth assumption: 20% to 35% annually, with a midpoint of approximately 27%. This is paired with net margin expansion from the current 7% to 10% range toward 20% to 30%, a trajectory that assumes high-margin software and services revenue (autonomous ride-hailing, FSD licensing) will increasingly dominate the revenue mix. The retained valuation multiple under this scenario ranges from 25x to 35x earnings, reflecting a market that continues to price Tesla as a technology platform rather than an automaker.
| Variable | Low End Assumption | High End Assumption | Current Actual |
|---|---|---|---|
| Revenue Growth Rate | 20% | 35% | 16% (Q1 2026 YoY) |
| Net Profit Margin | 20% | 30% | ~7-10% |
| Valuation Multiple (P/E) | 25x | 35x | ~73x NTM |
| Implied Annualised Return | ~11% | ~35% | Over 10-year horizon |
The operational milestones anchoring this case are specific: commercial Cybercab production, unsupervised Full Self-Driving (FSD) at scale, Optimus humanoid robot generating third-party revenue by 2027, and the AI5 chip delivering cost and capability advantages over current hardware. Autonomous vehicle miles driven nearly doubled in Q1 2026, and robocab expansion to Dallas and Houston (in addition to Austin) provides incremental deployment evidence.
The estimated probability of the full bull case materialising is approximately 5% to 10%. The magnitude of the upside, however, is what attracts serious capital despite low probability. A 35% annualised return over a decade, even at single-digit odds, represents a risk-reward profile that certain portfolio strategies are explicitly designed to capture.
Readers who encounter a bull case price target without unpacking its component assumptions cannot evaluate whether it is credible. The anatomy matters more than the number.
The bear case is not a prediction of failure. It is a scenario where Tesla remains a strong electric vehicle company with above-average margins relative to Ford or GM, but without meaningful AI or robotics revenue contribution. Under this framework, the company executes well on its existing business. The transformation premium simply does not arrive.
The numbers tell the story. Revenue growth moderates to 6% to 12% annually (midpoint approximately 9%), net margins settle between 8% and 14%, and the valuation multiple compresses to 18x to 22x earnings, closer to a blended auto-technology range. At a share price of approximately $375, every projected return outcome under these assumptions was negative.
| Variable | Low End Assumption | High End Assumption | Current Actual |
|---|---|---|---|
| Revenue Growth Rate | 6% | 12% | 16% (Q1 2026 YoY) |
| Net Profit Margin | 8% | 14% | ~7-10% |
| Valuation Multiple (P/E) | 18x | 22x | ~73x NTM |
| Implied Annualised Return | Negative at ~$375 entry | Over 10-year horizon | |
The specific execution risks embedded in the bear case are not abstract:
California DMV autonomous vehicle permit records published in March 2026 confirm that both Waymo LLC and Tesla Robotaxi LLC hold active testing authorisations in the state, making the absence of a Tesla commercial deployment permit a specific regulatory gap rather than a general competitive disadvantage.
Elon Musk stated in 2019 that one million robotaxis would be operating by the end of 2020. He announced in 2021 that Optimus would be deployment-ready by 2022. In 2016, Tesla claimed all vehicles shipped contained hardware sufficient for full autonomy. Each milestone eventually saw progress, but on timelines far longer than initially communicated.
This observation is not an argument that Tesla will fail to deliver. It is an argument for probability-weighting execution timelines conservatively. When a bull case depends on Cybercab commercialisation by a specific date or Optimus third-party revenue by 2027, the historical pattern of arrival-but-later is directly relevant to the discount rate applied to those milestones. Understanding the bear case is ultimately about quantifying the minimum execution required before the current price is justified.
The preceding sections dissected which future Tesla might become. This section addresses a different question: which future are investors paying for at their specific entry price?
The same company with the same trajectory can deliver dramatically different returns depending on when capital is committed. Tesla shares traded near $100 a few years before the analysis date. At the time of the Q1 2026 report, the price sat at approximately $375 to $380. The prior peak reached near $450. A bull case that generates 35% annualised returns from a $100 entry may generate single-digit returns from $375, and negative returns from $450.
Two distinct forces drive stock returns: earnings growth and multiple expansion. Earnings growth reflects the company generating more profit. Multiple expansion (a higher P/E or EV/EBITDA ratio) reflects other investors being willing to pay more per dollar of profit. Of the two, multiple expansion is the less reliable source of return because it requires future buyers to be more optimistic than today’s buyers. Forward analyst EPS estimates for Tesla project more than 5x growth from current levels (incorporating AI and autonomy assumptions), but those same estimates declined more than 90% from their prior peak before recovering, illustrating how dramatically sentiment-driven estimate cycles can swing.
Multiple compression among growth stocks reached levels seen less than 5% of the time since 2011, a macro backdrop that matters directly to any Tesla scenario model because the terminal multiple assumption in the bear case becomes more plausible when the broader growth category is already repricing toward fair value.
Before acting on any scenario model, three questions deserve explicit answers:
The price paid at entry is one of the most consequential variables in any investment. No scenario model is complete until it is anchored to the specific price the investor is considering.
The Tesla case study does not resolve into a buy or sell verdict. It resolves into a transferable set of analytical habits.
When a company’s current price embeds a transformation that has not yet occurred, the valuation work is not about finding the right number. It is about structuring the right questions, assigning honest probabilities, and identifying which milestone will resolve the uncertainty first. Tesla’s Q1 2026 results ($22.4 billion in revenue, $0.40 adjusted EPS versus $0.35 consensus, 21.7% gross margin versus the 17% projected) did not settle the bull versus bear debate. The more than $25 billion in confirmed 2026 CapEx ensured the debate continues. One data point was updated in an ongoing execution story, which is precisely how transitional company analysis works.
Analyst price target dispersion is not noise to be averaged away. It is a signal to decompose. The consensus mean obscures the scenario logic underneath it, and two analysts arriving at the same target through different assumptions are not in agreement; they are coincidentally overlapping.
For investors wanting to understand the mechanics behind the $575 spread between the most optimistic and most pessimistic Tesla price targets, our full explainer on analyst price target dispersion walks through how the three core scenario levers interact, why internally inconsistent assumptions produce structurally broken outputs, and what a blended probability-weighted value looks like in practice.
Three analytical habits transfer from this case study to any company trading on a story rather than a spreadsheet:
This article is for informational purposes only and should not be considered financial advice. Investors should conduct their own research and consult with financial professionals before making investment decisions. Past performance does not guarantee future results. Financial projections are subject to market conditions and various risk factors.
—
Scenario-based valuation is a structured process where analysts define bull, base, and bear assumptions for key variables like revenue growth and profit margins, assign explicit probabilities to each outcome, and calculate a probability-weighted intrinsic value rather than relying on a single point estimate.
Tesla analyst price targets can differ by hundreds of dollars per share because analysts disagree on whether the company should be valued as an automaker, a technology platform, or something in between, with each framing producing radically different multiples and forward earnings assumptions.
The same company with the same growth trajectory can deliver dramatically different returns depending on the entry price; for example, a bull case generating 35% annualised returns from a $100 entry may produce only single-digit or negative returns when entered at $375 or higher.
Tesla reported Q1 2026 revenue of $22.4 billion and a 21.7% gross margin, both beating consensus estimates, but the CFO also confirmed more than $25 billion in 2026 capital expenditure, keeping the bull versus bear valuation debate firmly unresolved.
Investors should make probability assignments explicit before consulting consensus estimates, for example allocating 60% to a base case and 30% to a bear case, so that assumptions become visible and debatable rather than silently filled by confirmation bias.


