The five largest U.S. companies now account for roughly 30% of the entire equity market, a concentration level that has surpassed every prior historical benchmark, including the 1960s. Against that backdrop, every geopolitical headline gets filtered through a single question: does this break the AI trade’s grip on the market, or reinforce it?
U.S.-Iran nuclear talks remain in a fragile framework stage as of 8 May 2026, following an April 8 ceasefire that briefly lifted global equities. Prediction markets now price a diplomatic meeting by 30 June at just 26.5%, down from 33% the prior day, after fresh doubts surfaced from Trump comments. Oil has been whipsawing between $98 and $102 per barrel, and the S&P 500 closed at 7,337.11 on 7 May, approximately 1.5% off its all-time high. What follows maps precisely how a resolution would travel through energy prices and bond yields into equity sectors, what the brief April broadening rally already revealed about the pattern’s limits, and why Wolfe Research analyst Chris Senyek argues AI-linked mega-caps would reassert dominance regardless of the outcome.
The market concentration backdrop that makes this geopolitical question urgent
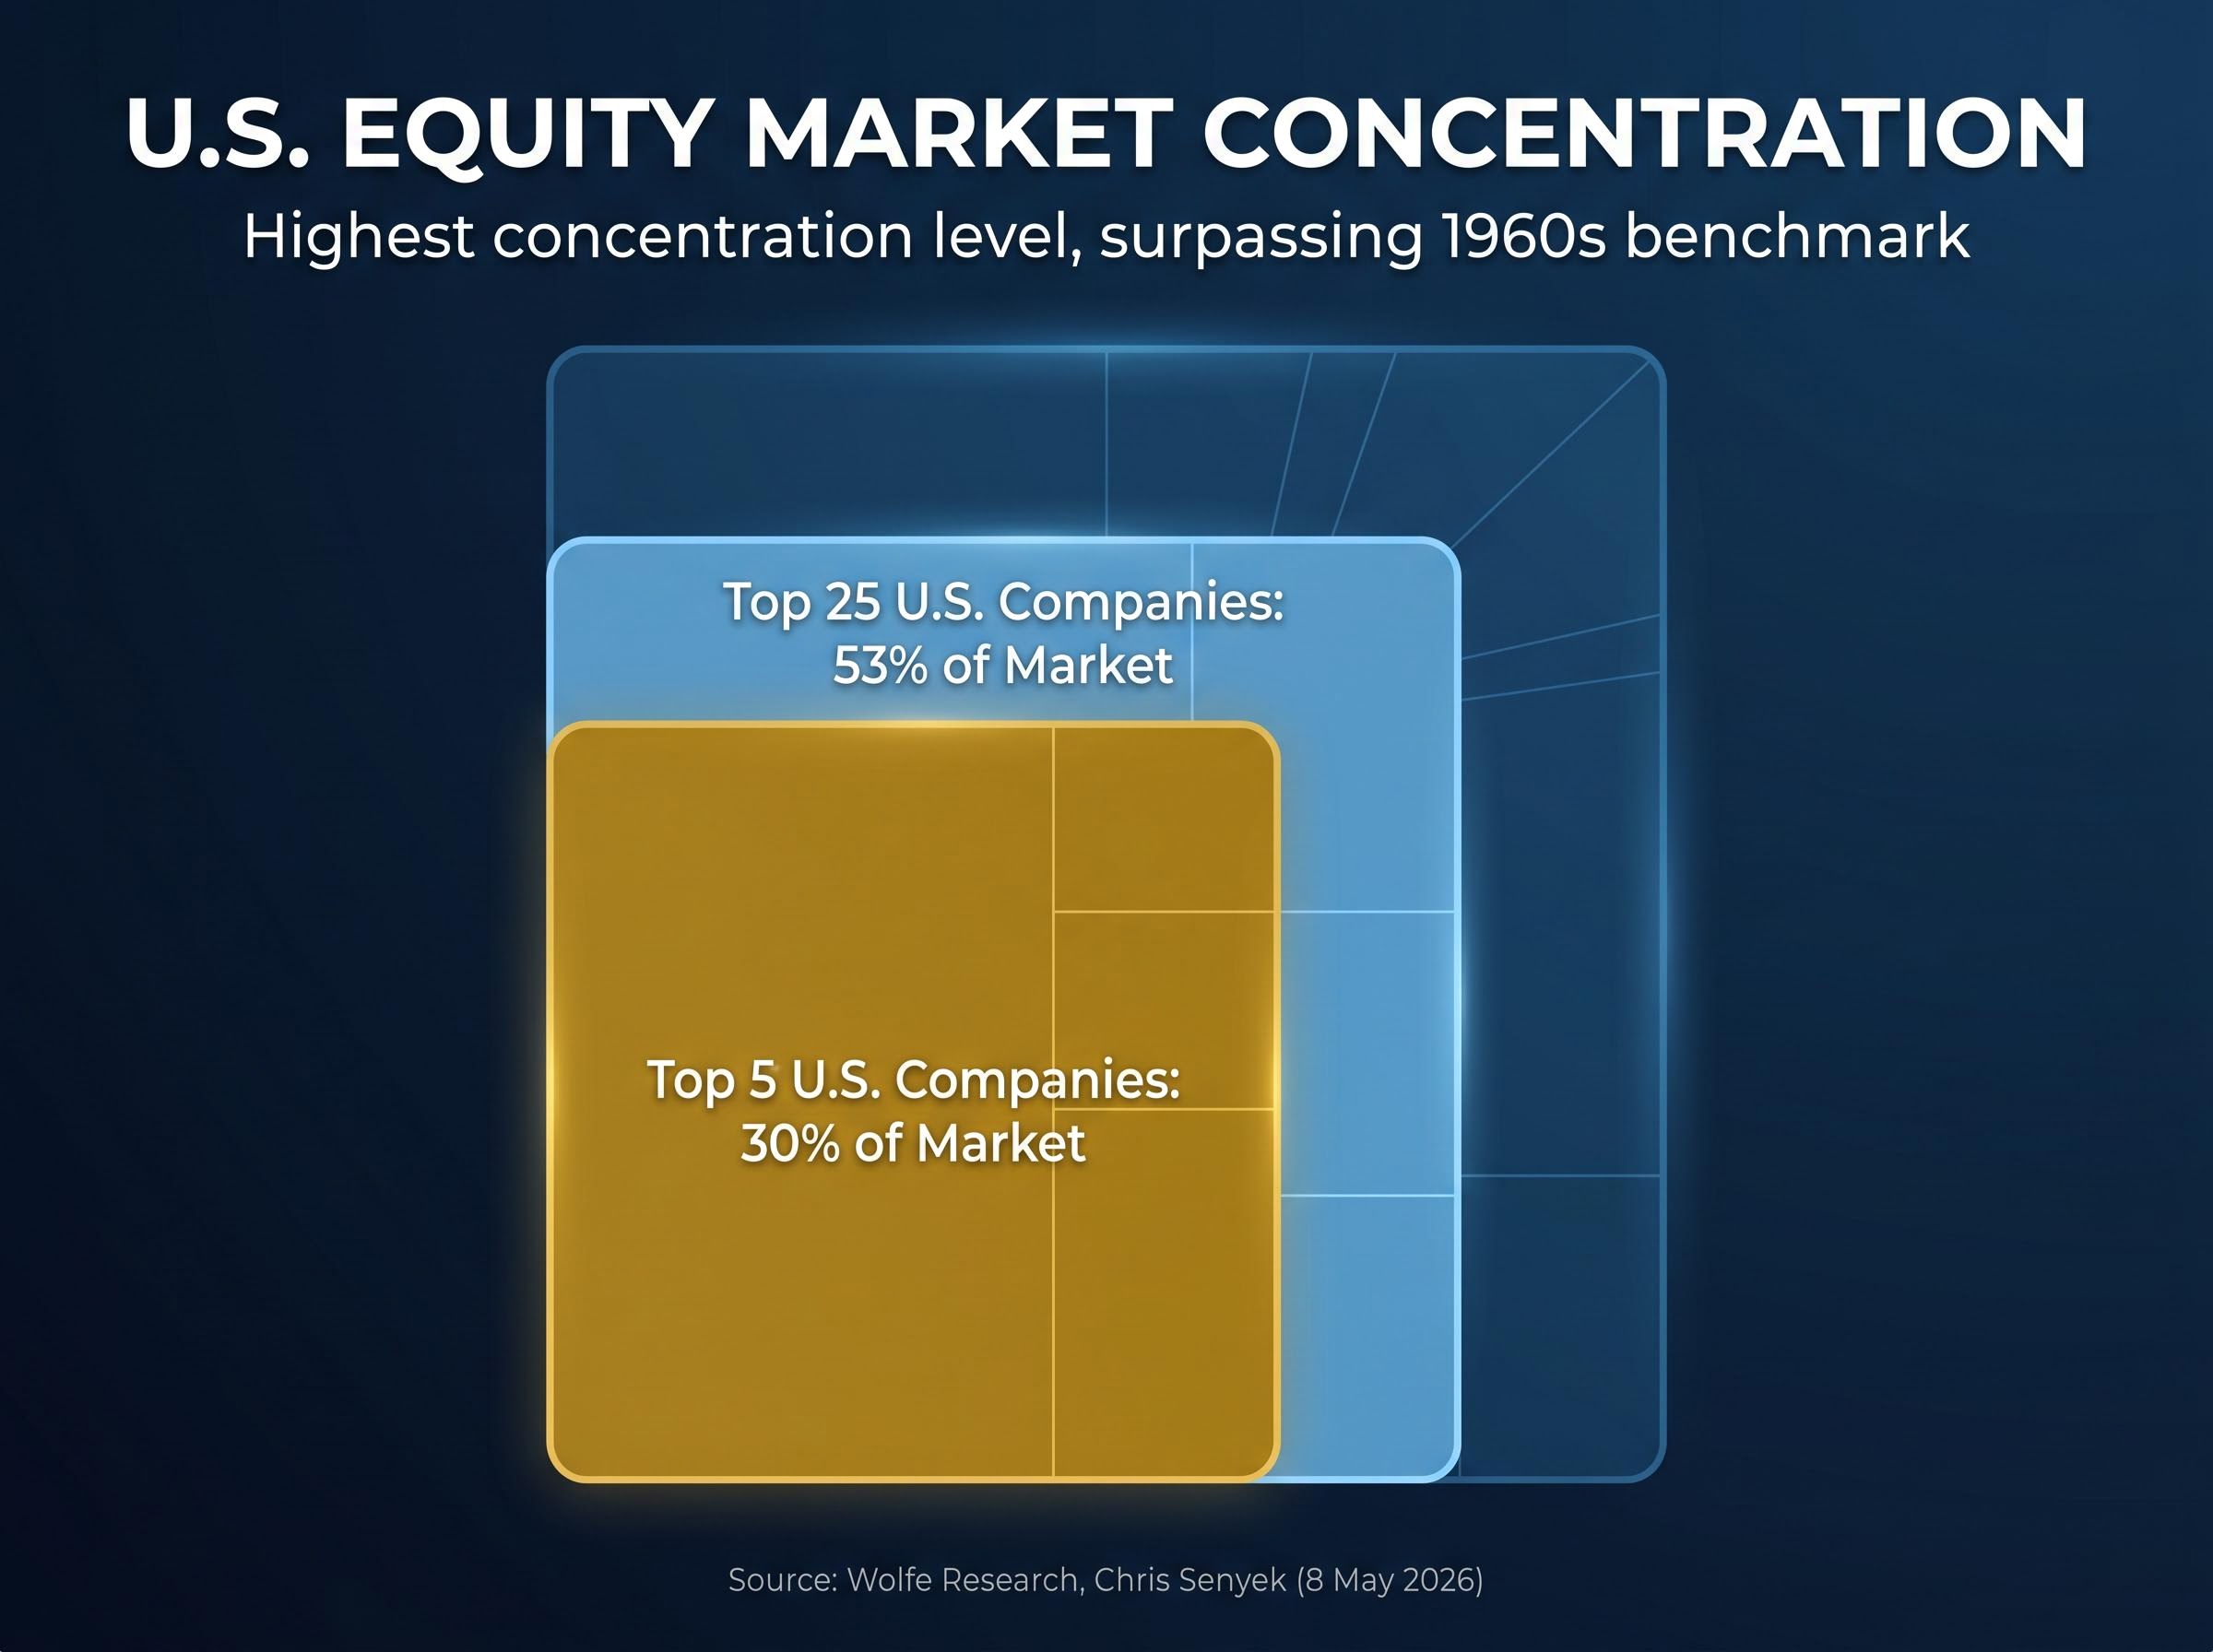
The structural starting point for any rotation debate is the weight sitting at the top of U.S. equities. According to Wolfe Research’s 8 May 2026 client note authored by Chris Senyek, the concentration is historically unprecedented:
- The five largest U.S. companies represent roughly 30% of the total equity market.
- The top 25 U.S. companies account for approximately 53% of the overall market.
- Both figures exceed even the 1960s readings, the prior historical benchmark for market concentration.
US index fund concentration has reached a structural inflection point where passive investors holding a broad market fund and an S&P 500 fund simultaneously may be carrying near-identical top-five weightings rather than any genuine diversification, with five names accounting for roughly 23% of the broad market as of mid-April 2026.
The top 25 U.S. companies account for approximately 53% of the overall market. — Wolfe Research, Chris Senyek, client note, 8 May 2026
The S&P 500 recovery from its 30 March low of 6,343 was itself a concentration story. AI-related equities comprised nearly half of the leading rebounding stocks, meaning the recovery that brought the index back within 1.5% of its all-time high was not a broad rebound. It was the same names reasserting themselves.
Any discussion of a “rotation” triggered by a diplomatic breakthrough operates inside this structural reality. A temporary broadening rally can look significant in daily returns while barely shifting the weight distribution that defines the market’s centre of gravity.
When big ASX news breaks, our subscribers know first
Where U.S.-Iran talks actually stand right now
The negotiation timeline stretches back to 12 April 2025, when talks were formally initiated. An 8 April 2026 ceasefire delivered the first concrete de-escalation, but the shift from ceasefire optimism to deal-framework uncertainty has defined the weeks since.
The table below summarises the key terms under discussion and their status:
| Condition | Status as of 8 May 2026 |
|---|---|
| Uranium enrichment capped at 3.67% temporarily | Proposed; Iranian leaders have not confirmed acceptance |
| Permanent halt to high-level enrichment (IAEA inspections) | Subject to IAEA verification; no confirmation of moratorium terms |
| Contingent U.S. sanctions relief | Linked to enrichment compliance; not yet triggered |
| UK, Germany, France forgoing UN snapback sanctions | Part of framework; contingent on broader agreement |
Naval tensions persist near the Strait of Hormuz. Bloomberg reported on 7 May 2026 that Iranian leaders had not confirmed acceptance of the uranium moratorium terms, a sticking point that has dampened the optimism generated by the April ceasefire.
What prediction markets are signalling
Prediction markets currently price the probability of a diplomatic meeting by 30 June 2026 at 26.5%, down from approximately 33% in the prior 24 hours. The decline followed Trump comments that reintroduced doubt about the pace of engagement.
Broader deal probability estimates sit around 31% depending on the platform, meaning the no-deal scenario carries an implied weight of roughly 69-73.5%. For investors tracking this story in real time, these figures function as a sentiment aggregator, compressing diplomatic complexity into a single, continuously updated probability that moves faster than traditional reporting.
The two transmission channels a deal would activate
If a resolution materialises, Wolfe Research identifies two primary channels through which it would lift lagging equity sectors: declining energy prices and falling bond yields. The mechanics form a sequential chain rather than two independent effects.
Wolfe Research’s Chris Senyek identifies declining energy prices and falling bond yields as the primary transmission mechanisms through which a deal would benefit underperforming sectors. — Client note, 8 May 2026
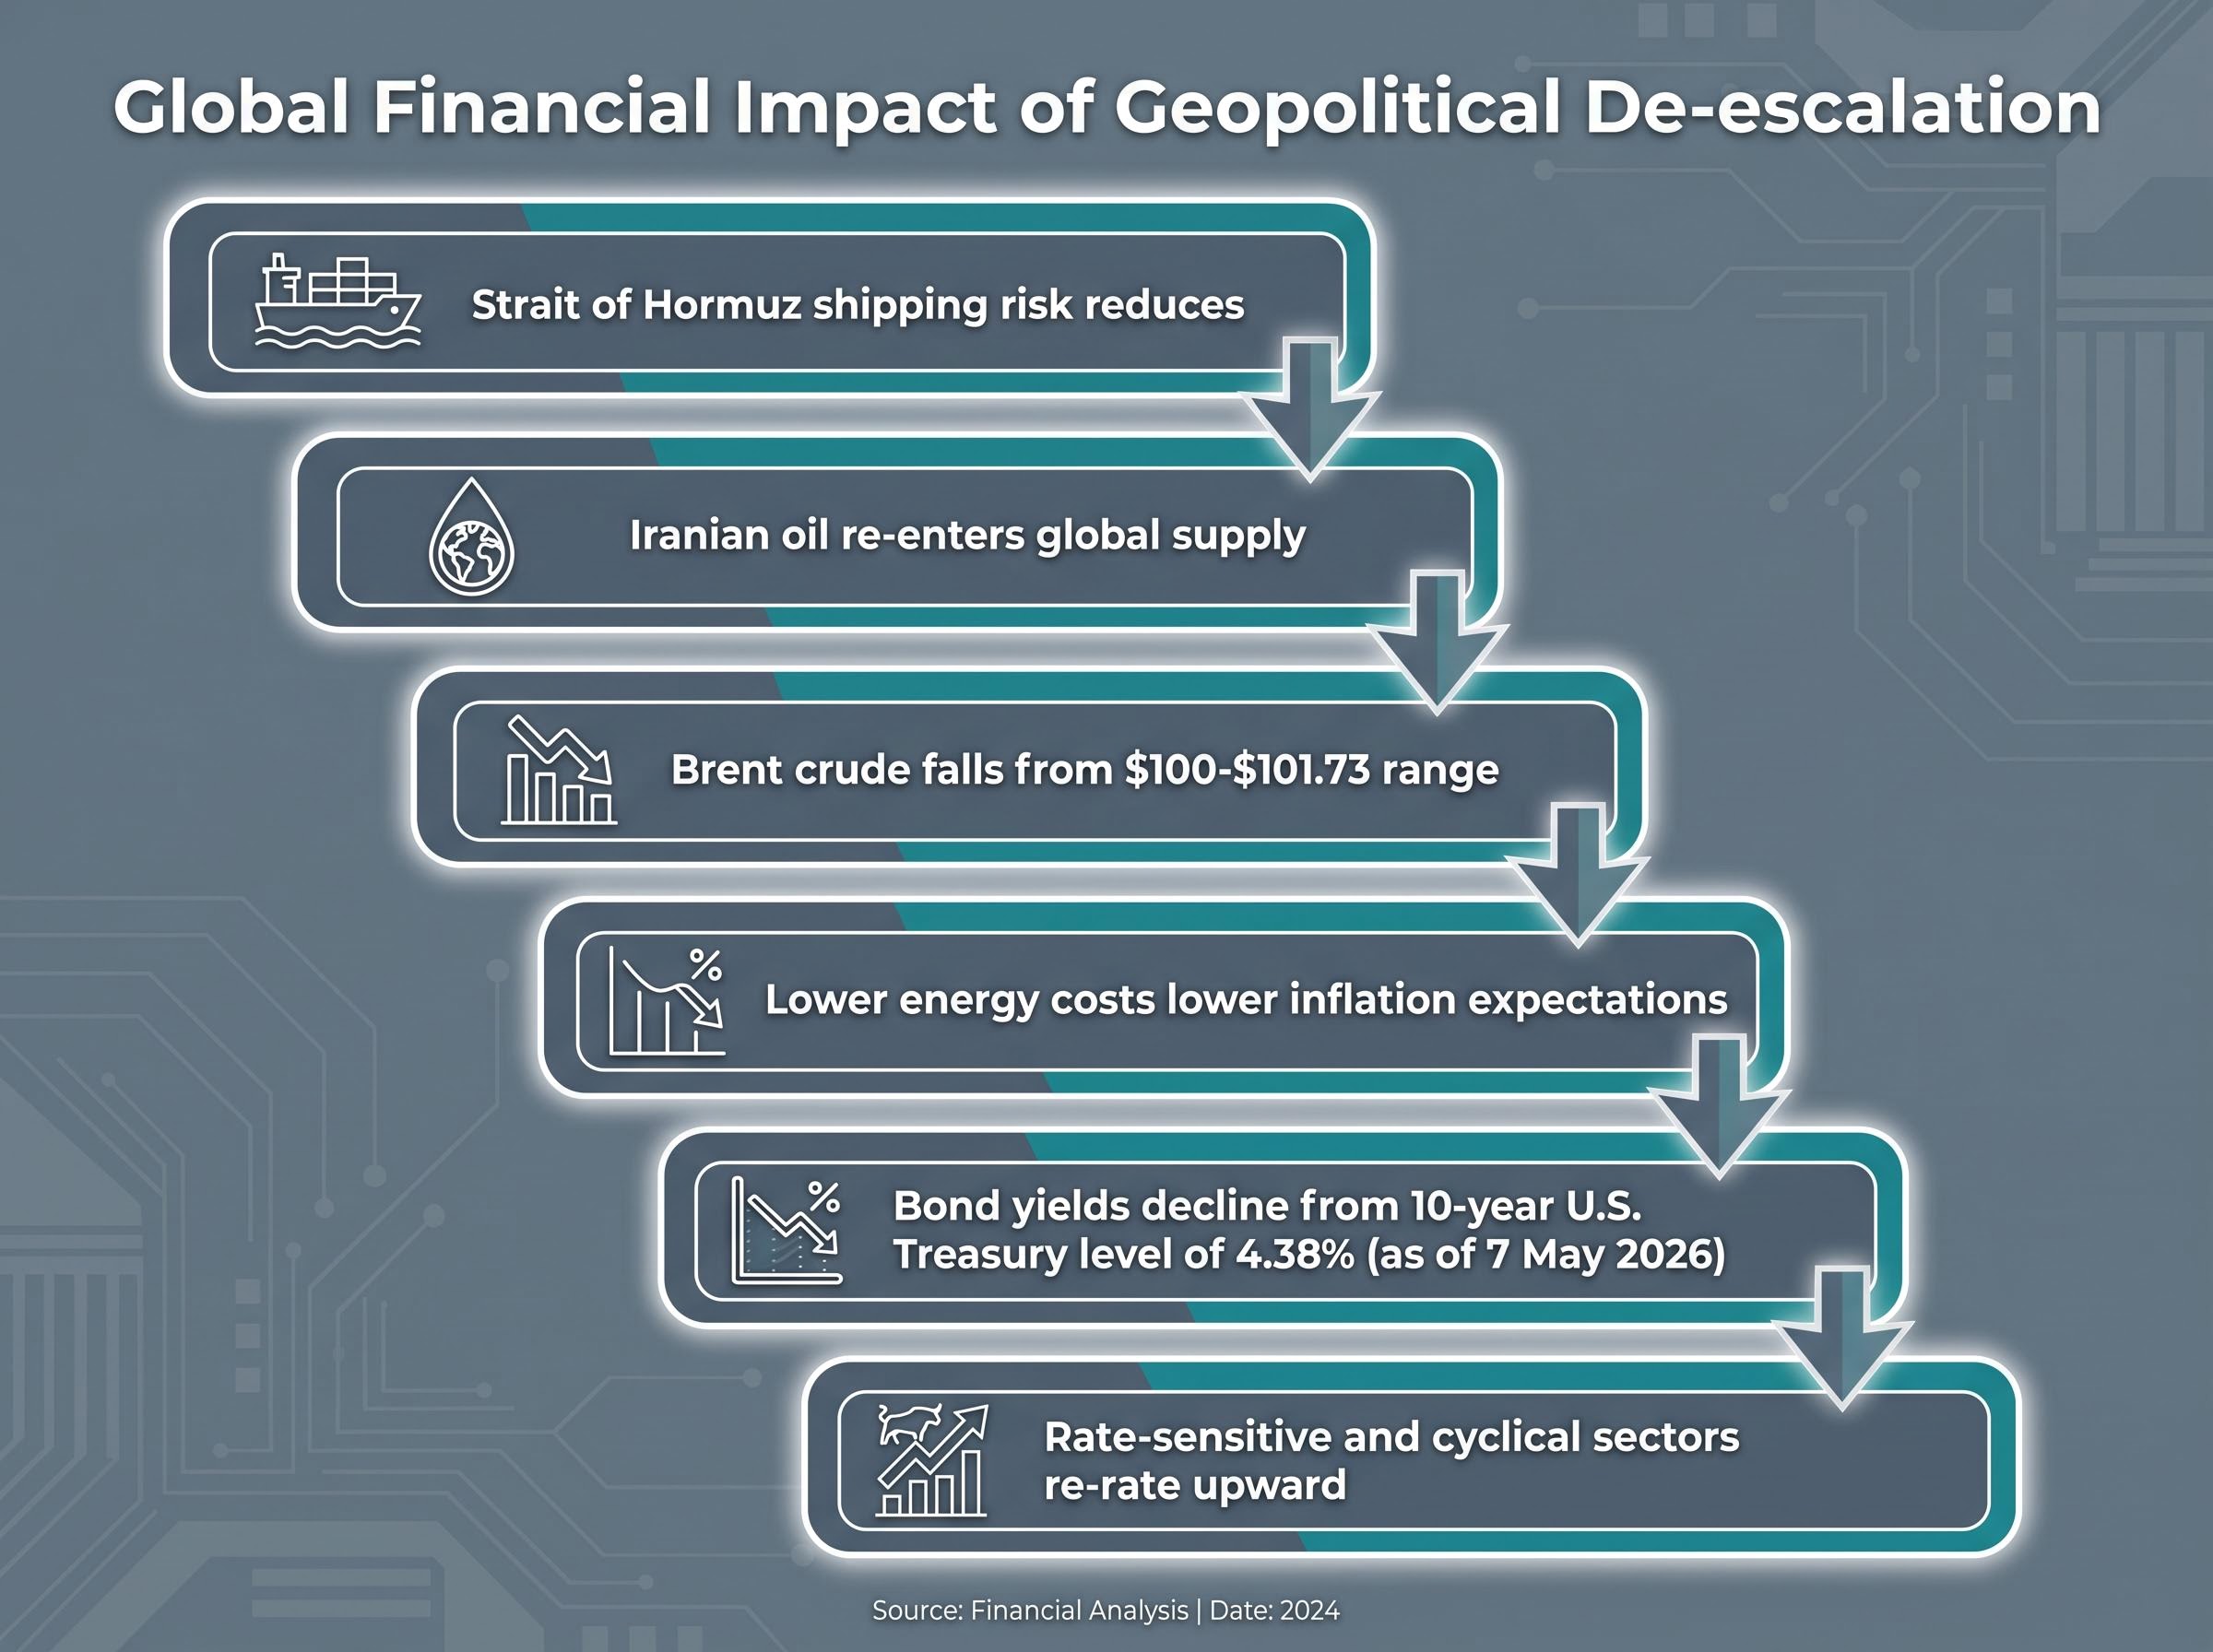
The causal sequence runs as follows:
- A deal reduces Strait of Hormuz shipping risk, the primary supply bottleneck.
- Iranian oil re-enters global supply under sanctions relief.
- Brent crude falls from its current $100-$101.73 range, where it has been whipsawing according to Bloomberg.
- Lower energy costs feed into lower inflation expectations.
- Bond yields decline from the current 10-year U.S. Treasury level of 4.38% (as of 7 May 2026).
- Rate-sensitive and cyclical sectors, which have underperformed during the conflict period, re-rate upward.
The 14 April ceasefire rally offered a miniature version of this channel in action. On that session, the S&P 500 gained 1.02%, the Nasdaq rose approximately 2%, the Dow added 0.63%, the JSE climbed 1.10%, and the Nikkei surged 2%. Brent had eased to $98.56 that day on peace hopes.
Knowing these specific transmission steps helps investors identify which indicators to monitor, rather than reacting after the rotation has already played out. The 10-year yield and Brent price are the leading signals; equity sector rotation is the lagging confirmation.
San Francisco Fed research on oil shocks and interest rates shows that the transmission from crude price declines to Treasury yield compression is neither automatic nor linear, with the Federal Reserve’s inflation-targeting posture determining how much of any energy-driven disinflation actually reaches bond markets.
What the April broadening rally already revealed about the pattern’s limits
The 14 April ceasefire rally serves as a live stress test of the rotation thesis, and the results are mixed. Global participation was real but brief. The performance spread across indices, however, told a more nuanced story.
| Index | 14 April Move | Context |
|---|---|---|
| S&P 500 | +1.02% | Broad relief rally on ceasefire announcement |
| Nasdaq | ~+2% | Tech/growth leadership even within the broadening move |
| Dow | +0.63% | Underperformed growth-heavy indices materially |
| JSE | +1.10% | Brief global participation that did not sustain |
| Nikkei | +2% | Strong single-day gain; faded in subsequent sessions |
| Shanghai | Lagged | Consistent underperformance throughout the conflict period |
The Nasdaq’s approximately +2% gain against the Dow’s +0.63% is the critical detail. Even inside a ceasefire-driven broadening move, AI-linked growth stocks led. The broadening was real in the sense that global indices participated, but the internal composition of the U.S. rally still favoured the same names that had driven the recovery from the 30 March low of 6,343.
Market breadth data from April 2026 makes the ceiling on rotation even more precise: only 23% of S&P 500 constituents outperformed the benchmark during a month that posted a 98th-percentile return, and the 5-percentage-point gap between the cap-weighted and equal-weighted index confirmed that headline gains were driven by the same narrow AI and semiconductor cohort that dominated the recovery from the March low.
How the May pullback confirmed the ceiling
By 7 May, the S&P 500 had retreated to 7,337.11, down 0.38% on the session, with the broadening impulse fading as deal uncertainty returned. Prediction market probability dropped from 33% to 26.5% in the same window.
The pattern mirrors prior intra-crisis cycles: conflict shock, broad selloff, ceasefire-driven broadening, uncertainty return, then tech and growth reassert. AI-exposed companies comprised nearly half of the leading rebounding stocks off the March low, and that leadership had not been disrupted by the ceasefire episode. Shanghai’s persistent underperformance confirmed that the broadening was geographically and sectorally shallow.
Why Wolfe Research expects AI mega-caps to win regardless of the deal outcome
Wolfe Research’s Chris Senyek, in the 8 May 2026 client note, argues that AI-linked names have returned to a position of market dominance, and that investor preference is projected to shift back toward AI equities even after geopolitically driven broadening episodes. The argument rests on valuation and earnings rather than momentum.
Wolfe Research projects that AI-linked equities will reassert market leadership following any geopolitically driven broadening, underpinned by superior earnings growth trajectories and comparatively attractive valuations relative to the broader market. — Chris Senyek, client note, 8 May 2026
The concentration data provides the structural anchor. When the top five companies hold 30% and the top 25 hold 53% of market capitalisation, durable earnings and capital allocation already reside at the top. J.P. Morgan’s analysis from approximately 24 April 2026 cited “durable earnings fundamentals in tech and beyond” as the foundation of the V-shaped recovery, reinforcing the view that the earnings advantage is not a temporary phenomenon.
AI investment concentration in the infrastructure and energy layer, where semiconductors, data centre REITs, and power companies sit, is structurally distinct from concentration in AI application stocks, and the earnings durability argument that underpins Wolfe Research’s base case depends on which layer is actually capturing the rewards of the $600-$805 billion in combined hyperscaler CapEx committed for 2026.
U.S. energy independence further insulates AI-heavy indices from the full force of any oil shock, reducing the competitive pressure on growth stocks relative to cyclicals that face direct energy input cost exposure.
The two scenarios break down as follows:
- Deal materialises: Temporary rotation toward cyclicals and geopolitical laggards; AI reasserts within weeks as the earnings differential reasserts.
- Talks collapse: AI dominance continues uninterrupted; the rotation thesis never activates.
With prediction markets pricing the deal scenario at just 26.5%, the no-deal outcome carries a 73.5% implied weight, making the AI durability thesis the base case by a wide margin.
The AI trade’s structural grip, and what it would actually take to loosen it
A diplomatic announcement alone would not constitute a regime change for U.S. equity leadership. Sustained broadening would require three conditions to materialise simultaneously:
- Sustained lower bond yields: The 10-year U.S. Treasury yield sits at 4.38%. Rate-sensitive sectors would need material compression below this level, maintained over quarters rather than days, to catalyse durable rotation.
- Confirmed Iranian supply increases: Headline ceasefire agreements have not historically translated into immediate supply gains. Verified increases in Iranian oil exports would need to place lasting downward pressure on Brent.
- Earnings broadening outside mega-caps: The most structurally demanding condition. Sectors beyond the top 25 would need to deliver earnings beats sufficient to compete for capital allocation against AI-linked names growing at a faster rate.
The Wolfe Research view functions as a probability-weighted base case rather than a certainty. The 26.5% prediction market figure represents a quantifiable tail risk of a more disruptive diplomatic breakthrough. One data gap deserves acknowledgement: no market impact data from the 2015 JCPOA (Joint Comprehensive Plan of Action, the prior Iran nuclear agreement) is available in current research to size the magnitude of a potential full-deal rotation.
Equity mispricing of geopolitical risk presents the structural counterargument to the AI durability thesis: algorithmic models that treat supply shocks as routine dips may be artificially elevating valuations relative to physical constraints on maritime logistics that automated pricing cannot indefinitely ignore, particularly if Brent sustains above $110 per barrel or military engagement broadens beyond the current ceasefire framework.
What to watch in the weeks ahead
Four concrete signals would update this thesis in real time:
- 10-year yield direction: A sustained move below 4.25% would indicate the bond market is pricing a genuine de-escalation.
- Brent price trajectory: A decline below $95 sustained over multiple sessions would confirm Iranian supply expectations entering the market.
- Prediction market probability: Any shift back above the 33% level that preceded the recent pessimism would signal renewed institutional attention to the deal scenario.
- IAEA confirmation: Any verified acceptance of enrichment moratorium terms by Iran would represent the most material catalyst for repositioning.
A temporary window, not a turning point
Wolfe Research’s thesis synthesises to a single, calibrated takeaway: a U.S.-Iran deal, if it arrives, creates a rotation window measured in weeks rather than quarters. The concentration data, with 30% in the top five and 53% in the top 25, and the AI earnings durability argument are not dependent on the diplomatic outcome.
Investors monitoring this story should distinguish between a tactical broadening opportunity and a structural regime change. The April ceasefire rally already demonstrated both the rotation’s existence and its ceiling. The signals that would challenge this framework are specific and trackable: the 10-year yield, Brent crude, and prediction market probability above 33%.
Until those indicators move in concert and sustain, the Wolfe Research evidence points toward the same conclusion that the market’s own concentration data already implies. The AI trade is not waiting for permission from geopolitics.
This article is for informational purposes only and should not be considered financial advice. Investors should conduct their own research and consult with financial professionals before making investment decisions. Forward-looking statements regarding diplomatic outcomes and market movements are speculative and subject to change based on geopolitical developments and market conditions.