
Stock Valuation When the Price and Financials Tell Different Stories
26 mins ago

At $411.79 per share in May 2026, Tesla sits almost exactly at the analyst consensus price target of $413.19. Yet individual analyst estimates range from $25.28 to $4,600. That gap is not noise. It is a window into one of the most consequential skills in stock valuation analysis: knowing how to price a company whose future has not happened yet.
Tesla’s Q1 2026 earnings beat expectations across revenue, earnings per share, and gross margin. The stock’s path forward, however, depends almost entirely on whether autonomous driving and humanoid robotics generate real revenue at scale. This is the defining challenge of valuing any company in a platform transition: the current price reflects a future that may or may not arrive, and the return earned (or lost) is determined by how much of that future was paid for on entry.
This guide uses Tesla’s bull and bear case valuation scenarios as a live case study to teach a repeatable methodology for evaluating any stock where transformation is already priced in. Readers will finish with a framework for constructing scenario-based valuations, understanding what drives dispersion between outcomes, and assessing whether a given entry price offers an attractive risk-adjusted return.
A company can execute flawlessly and still deliver negative returns to investors who paid too much to own it. Company quality and investment return are not the same thing. The difference between them is entry price.
Tesla’s own history illustrates the point. The stock was available at approximately $100 per share a few years ago. In recent months it has traded between $375 and $450. An investor who bought at $100 and held through identical business outcomes would have earned a return several times larger than one who bought near $400, even though the company underneath was the same.
The Q1 2026 results were strong: revenue of $22.4 billion (up 16% year-over-year), adjusted EPS of $0.40 versus the $0.35 consensus, and gross margin of 21.7% against a 17% consensus estimate. Yet forward returns from here depend on scenario outcomes, not trailing results.
“A great company and a great investment are not the same thing. The price you pay determines which one you end up with.”
The question this guide answers is direct: when a stock is pricing in a transformation that has not yet happened, how do you determine whether that price is justified?
Standard valuation multiples such as price-to-earnings (P/E) and enterprise value-to-EBITDA (EV/EBITDA), which compare a company’s market price to its current financial output, misfire on companies mid-transition. They either ignore nascent high-growth segments entirely or overweight unproven ones, producing a number that misleads in both directions.
The structural problem is specific. The company’s current financials reflect the old business. The stock price reflects the new one. A single comparable-company multiple applied across the blended entity cannot resolve this disconnect. It produces a valuation that is wrong for both businesses simultaneously.
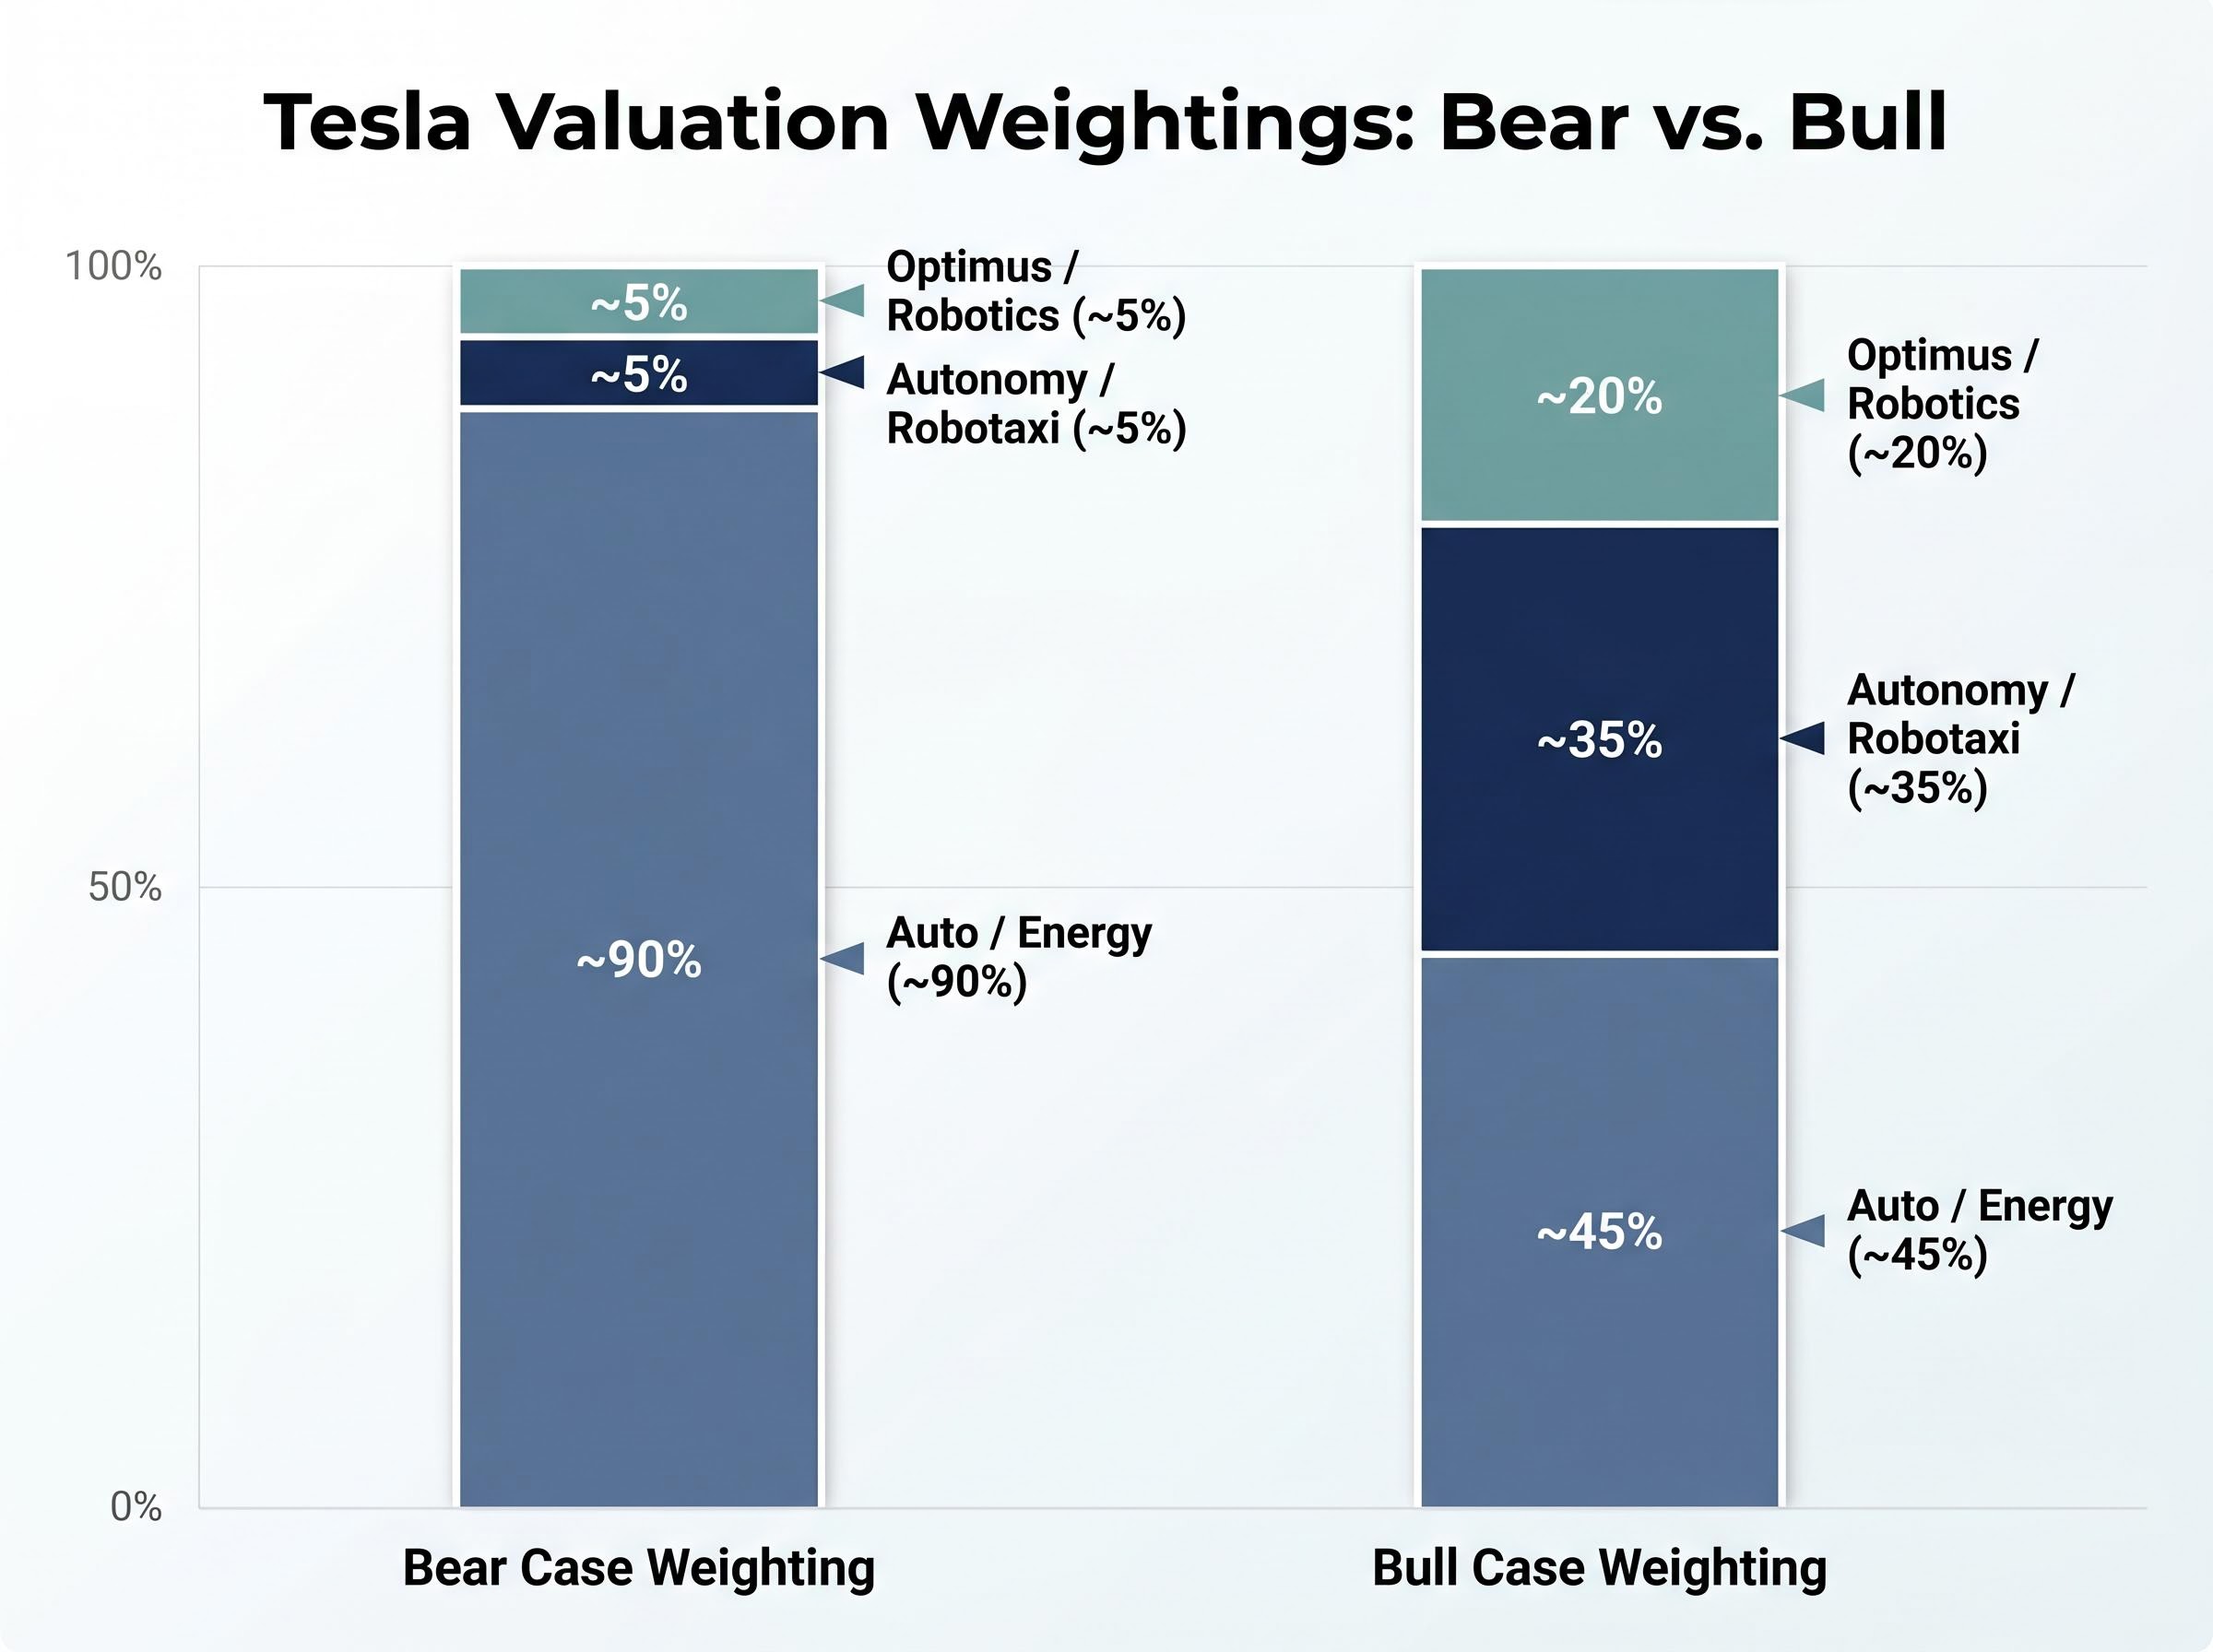
Tesla is perhaps the clearest example in large-cap equities. Analyst segment weightings illustrate the divide: the auto and energy businesses account for approximately 65% of consensus value, autonomy and robotics for roughly 25%, and other segments for the remaining 10%. Bull-case analysts assign more than 50% of total value to robotaxi and Optimus revenue. Bear-case analysts assign approximately 10% to those segments if Full Self-Driving (FSD) attach rates (the percentage of buyers who purchase the software) stay below 20%.
| Segment | Bear Case Weighting | Bull Case Weighting | Valuation Approach | Key Assumption Driver |
|---|---|---|---|---|
| Auto / Energy | ~90% | ~45% | EV/EBITDA comps | Volume growth, margins |
| Autonomy / Robotaxi | ~5% | ~35% | Probabilistic DCF | FSD regulatory approval |
| Optimus / Robotics | ~5% | ~20% | Real options pricing | Unit economics, timeline |
The result is the widest analyst dispersion in large-cap coverage: ARK Invest at $4,600 and GLJ Research at $25.28. That range is not analyst incompetence. It is a direct product of the methodology problem.
Core auto revenues can be valued with reasonable confidence using EV/EBITDA or comparable-company analysis. The autonomous driving and robotics segments require probabilistic treatment as real options, meaning they are valued based on the likelihood that specific future conditions are met rather than on current cash flows.
Rivian offers a cautionary parallel. An elevated valuation narrative built on software and autonomy potential compressed sharply when delivery shortfalls arrived and cash burn accelerated. Applying a single multiple to the blended business, as though every segment carried the same risk profile, masked the vulnerability until it was too late.
The analyst community addresses this problem with a three-tool ensemble: Discounted Cash Flow (DCF), Sum-of-the-Parts (SOTP), and probability-weighted scenario modelling. Each tool solves a specific piece of the puzzle.
DCF projects a company’s future cash flows and discounts them to present value using the Weighted Average Cost of Capital (WACC), a rate that reflects the company’s cost of financing. The output is an estimate of what the business is worth today based on what it will generate tomorrow. For transition companies, analysts build multiple DCF models, one for each plausible scenario, and stress-test the growth rate and margin assumptions within each.
The three scenario-based valuation inputs that drive the widest divergence in outcomes are revenue growth rate, net profit margin, and exit multiple; each must be internally consistent with the others, because a high-margin assumption paired with a low-growth rate produces a structurally incoherent scenario rather than a conservative one.
SOTP applies the appropriate methodology to each business segment separately, then adds them. Rather than forcing one multiple across a hybrid business, it allows the mature auto segment to be valued at 8-12x EV/EBITDA (per McKinsey’s options-adjusted SOTP framework) while treating autonomy and robotics as real options with execution risk adjustments. Amazon offers a precedent: SOTP analysis values e-commerce and AWS separately, with AWS carrying a 20x EV/EBITDA multiple that would be invisible in a blended approach. Apple’s services segment is similarly valued via a separate DCF at approximately 8% growth, distinct from hardware.
The four-step process follows a consistent sequence:
Aswath Damodaran of NYU Stern has warned against “narrative pricing without sensitivity analysis,” noting that transition DCFs should blend base-case cash flows with probabilistic moonshot scenarios weighted at 10-30% for unproven revenue streams such as robotaxi or robotics ramps.
The lever investors most often fail to calibrate is the probability assigned to each scenario, not the revenue growth rate within it.
Shifting a robotaxi scenario from 30% probability to 10% probability moves the weighted average intrinsic value far more than adjusting revenue growth from 25% to 35% within that same scenario. The McKinsey framework implies a 40-60% valuation haircut if Tesla’s robotics deployment is delayed past 2028, driven primarily by the probability weighting collapsing rather than the segment’s projected economics changing.
This is where most retail valuation models go wrong. They debate revenue assumptions endlessly while defaulting to optimistic probabilities on unproven outcomes.
The two scenarios that bookend Tesla’s valuation range differ across every assumption, and the distance between them is wide enough to produce opposite conclusions about the same stock at the same price.
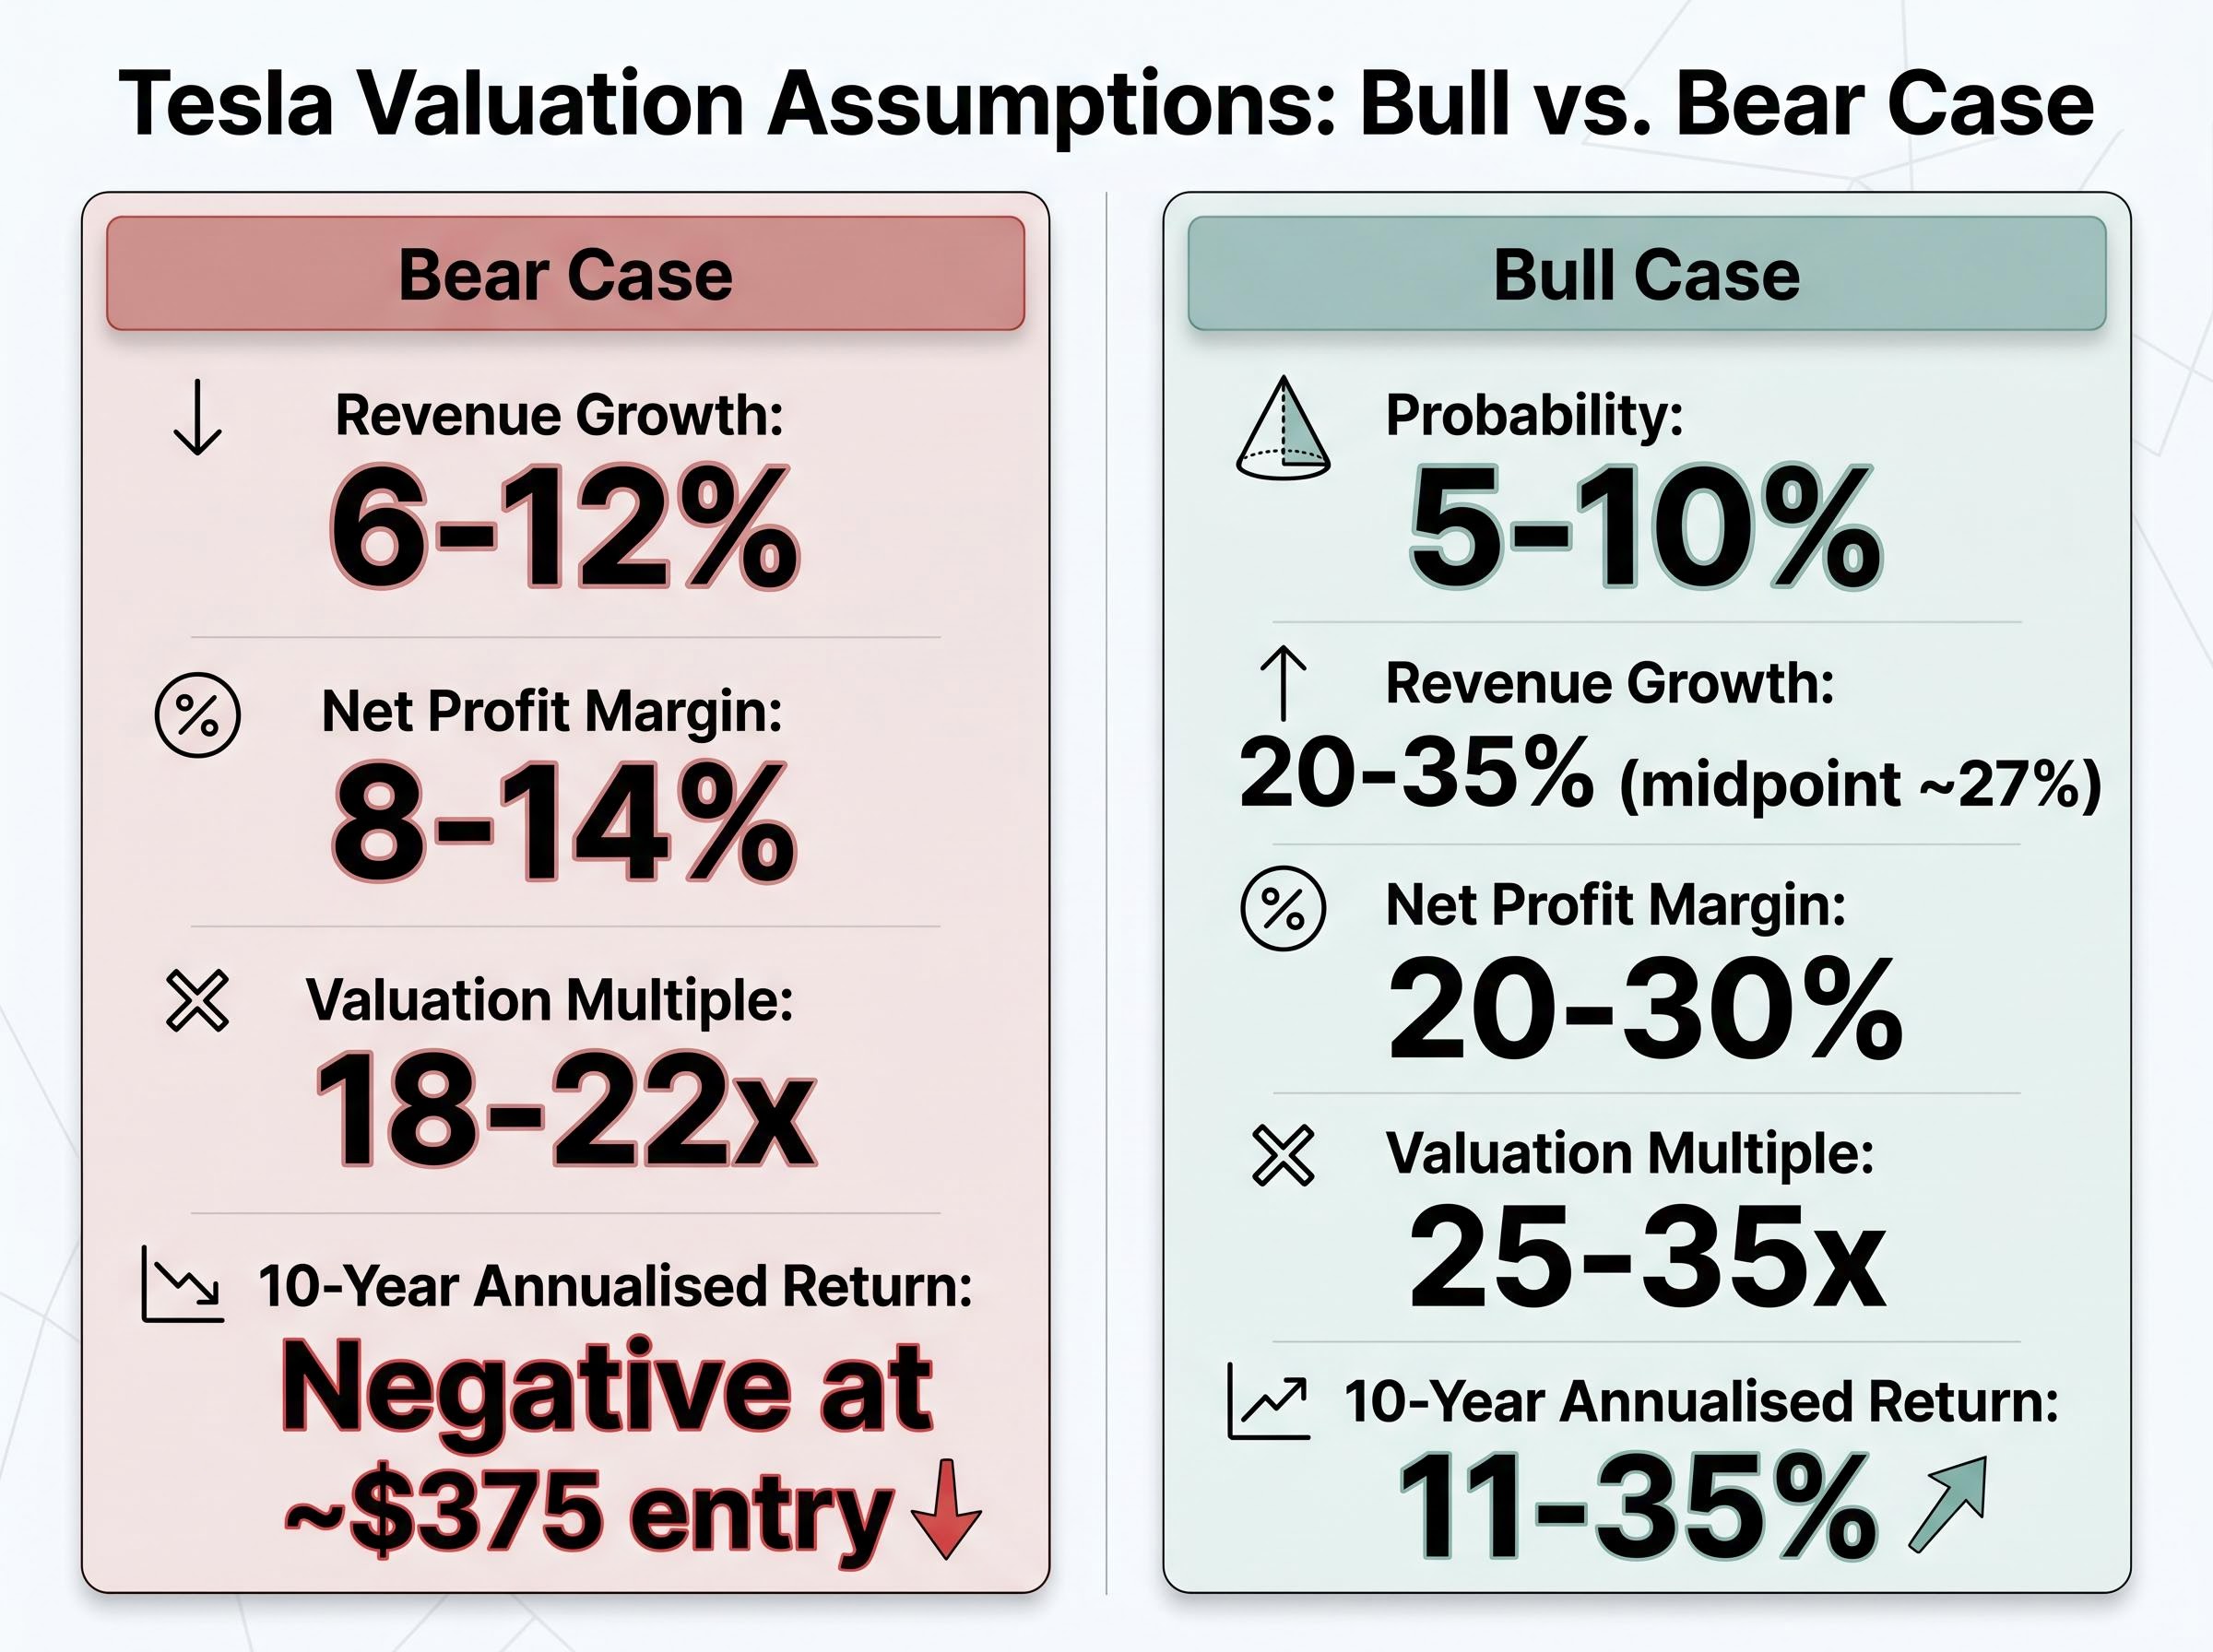
The bull case assumes revenue growth of 20-35% (midpoint approximately 27%), net profit margins of 20-30%, and valuation multiples of 25-35x earnings. Under these conditions, projected annualised returns over ten years range from 11% to 35%. Analysts assigning this outcome estimate its probability at roughly 5-10%. The assumptions require robotaxi and Optimus revenue to materialise on schedule and scale rapidly.
The bear case assumes revenue growth of 6-12% (midpoint 9%), net profit margins of 8-14%, and valuation multiples of 18-22x earnings. Even these bear-case margins remain above traditional automaker levels. Yet at an entry price near $375, every projected return outcome is negative.
| Assumption Category | Bear Case Range | Bull Case Midpoint | Bull Case Range |
|---|---|---|---|
| Revenue Growth | 6-12% | ~27% | 20-35% |
| Net Profit Margin | 8-14% | ~25% | 20-30% |
| Valuation Multiple | 18-22x | ~30x | 25-35x |
| 10-Year Annualised Return | Negative at ~$375 entry | ~23% | 11-35% |
Two additional factors amplify the bear case. Tesla has confirmed more than $25 billion in planned 2026 capital expenditure, generating near-term negative free cash flow pressure. Approximately 51,000 units of vehicle inventory flagged after Q1 2026 suggest softening demand in the core auto business.
At current prices, all bear-case return projections are negative. The entry price at this level embeds a full AI and robotics premium with no margin of safety.
The same stock, the same company, and two sets of assumptions that produce returns ranging from deeply negative to 35% annualised. The difference is not about Tesla. It is about which future the investor is paying for.
Three specific variables will resolve the uncertainty between the bull and bear outcomes: FSD regulatory progress, Optimus commercial revenue, and capital efficiency on the $25 billion+ capex programme.
The regulatory picture is materially more cautious than a simple approval narrative. NHTSA opened an investigation into Tesla FSD for crashes and visibility issues on 18 March 2026. California permitting gaps remain unresolved, and limited Texas rollouts do not yet constitute commercial-scale proof. Autonomous vehicle miles driven nearly doubled in Q1 2026, a genuine data point in Tesla’s favour, but miles driven and regulatory permission to operate commercially are different thresholds.
The NHTSA investigation into Tesla FSD escalated from a preliminary evaluation to a full engineering analysis on 18 March 2026, covering more than 3 million vehicles and focusing specifically on the system’s failure to recognize reduced visibility conditions and provide adequate driver warnings.
Elon Musk’s historical timeline pattern offers a useful calibration tool. A 2016 claim that Tesla hardware was FSD-capable, a 2019 projection for one million robotaxis, and a 2021 Optimus deployment claim all preceded significant delays. This does not mean eventual delivery is impossible, but it does inform the probability weighting an investor should assign to current projections.
The competitive field is active. Waymo operates multi-city commercial deployments with accumulated real-world data. Agility Robotics (an Amazon partner) shipped approximately 150 units in 2025. Figure AI is pursuing humanoid robotics with meaningful funding. McKinsey has noted that data advantages alone do not determine winners in autonomous systems.
Wedbush Securities characterised Tesla’s current setup as “Nvidia-lite” in May 2026, implying that if autonomous and robotics revenue materialises on schedule, the transformation premium could be validated.
The comparison carries a specific execution bar. Nvidia’s transformation premium was sustained by actual datacenter revenue growth of approximately 39% in 2025, with a forward P/E ratio around 41x supported by verified earnings, not projections. For Tesla to follow that pattern, autonomous and robotics revenue must appear in audited financials, not remain in pilot phase. Rivian and UiPath represent the failure pattern where transformation premiums compressed when speculative revenue failed to materialise.
The AI infrastructure transformation premium at Nvidia and Broadcom offers the clearest available comparison point for what a validated transition looks like: Nvidia’s data centre revenue of $193.7 billion in FY2026 and Broadcom’s 106% year-over-year AI chip revenue growth both represent cases where the speculative revenue that once justified elevated multiples has since appeared in audited financials, the threshold Tesla’s autonomy and robotics segments have not yet crossed.
The methodology applied to Tesla throughout this guide is not Tesla-specific. It is a repeatable framework for any company where the stock price has moved ahead of the business.
The five-step process applies to any platform-transition valuation:
A reverse DCF methodology inverts the standard approach: rather than projecting cash flows forward to estimate value, it takes the current share price as given and solves backward for the implied earnings growth rate the market is pricing in, revealing whether the embedded expectation is demanding near-perfect execution or leaves room for setbacks.
Morningstar estimates Tesla’s fair value at $400, implying the stock is approximately fairly valued at $411.79 with no margin of safety. The $25.28-to-$4,600 analyst range, driven entirely by scenario probability assumptions, demonstrates how much the output shifts when probability weights move.
Palantir offers the positive comparator. Its transformation premium held through Q1 2026, with revenue growth of 85% year-over-year and U.S. commercial revenue up 133%. The pattern is consistent: premiums sustain when speculative revenue becomes verified revenue. Forward EPS for Tesla is projected to grow more than 5x from current levels according to analyst consensus, but that estimate incorporates AI and autonomy contributions that have not yet appeared in audited results.
Benjamin Graham’s margin of safety principle holds that buying below intrinsic value provides a buffer for model errors, execution delays, and unforeseen competition. For high-dispersion transition stocks, that buffer is not optional. It is the primary risk management tool.
In a high-dispersion transition stock, the investor’s task is not to predict which scenario is correct. It is to determine what probability distribution the current price implies and whether that distribution is reasonable.
Tesla at approximately $411.79 prices in a substantial AI and robotics premium, offers no margin of safety at fair value estimates near $400, and delivers negative returns under bear-case assumptions. None of those observations constitute a verdict on Tesla as a company. They describe what the current price demands of the future.
The methodology demonstrated here, separating segments, modelling scenarios, weighting probabilities, and requiring a margin of safety, applies to any company where the stock price is ahead of the business. Whether the next transition-phase opportunity appears in autonomous vehicles, AI infrastructure, or a sector that does not yet exist, the framework remains the same.
The entry price is the one variable entirely within the investor’s control. Everything else is forecast. The discipline to distinguish between the two is where returns are made or lost.
For investors wanting to situate Tesla’s entry price discipline within a broader portfolio context, our dedicated guide to market-wide valuation signals examines the Buffett Indicator at 223.6%, the equity earnings yield versus Treasury spread, and Berkshire Hathaway’s $373 billion cash reserve as three converging frameworks that currently suggest margin-of-safety buying opportunities are scarce across US equities, not just in high-dispersion transition stocks.
This article is for informational purposes only and should not be considered financial advice. Investors should conduct their own research and consult with financial professionals before making investment decisions. Past performance does not guarantee future results. Financial projections are subject to market conditions and various risk factors.
Scenario-based stock valuation analysis builds separate financial models for bull, base, and bear outcomes, assigns a probability to each, and computes a weighted average intrinsic value. This approach is more accurate than a single-multiple method when a company is mid-transition, because it captures the full range of plausible futures rather than forcing one assumption set onto a hybrid business.
A Sum-of-the-Parts valuation applies a separate methodology to each business segment and then adds them together, rather than applying one blended multiple to the entire company. Investors use it when a company has segments with very different risk and growth profiles, such as a mature manufacturing division alongside a speculative autonomous driving or robotics unit.
The extreme range reflects fundamentally different probability weights assigned to Tesla's autonomous driving and robotics segments, not differences in analysing the core auto business. Bull-case analysts assign more than 50% of total value to robotaxi and Optimus revenue, while bear-case analysts assign roughly 10% to those segments, and that probability gap alone produces the enormous spread in price targets.
Entry price determines how much of a company's speculative future an investor has already paid for before that future materialises. The article shows that an investor who bought Tesla near $100 would earn roughly 300% if the stock reaches $400, while an investor who buys near $400 earns a flat to negative return at the same future price, even though the underlying business is identical.
A margin of safety means buying a stock below its estimated intrinsic value to create a buffer for model errors, execution delays, and unforeseen competition. For high-dispersion transition stocks like Tesla, where Morningstar estimates fair value near $400 and the current price is approximately $411.79, no margin of safety exists, meaning any valuation error or execution shortfall produces negative returns with no cushion.


