How to Value a Stock Using Tesla as a Live Case Study
18 mins ago

Tesla’s stock trades at roughly 188 to 217 times forward earnings as of May 2026. A Hold consensus from 26 analysts sits alongside a base case price target from ARK Invest of $4,600. Both views are built from the same Q1 2026 financials. That is not a market anomaly. It is a stock valuation analysis problem, and it is the most instructive setup in public markets right now.
Tesla in May 2026 is the canonical example of a company whose reported financials and current stock price tell completely different stories. The $1.31 trillion market capitalisation is not pricing Tesla the automaker. It is pricing a probability-weighted blend of an electric vehicle company, an autonomous vehicle network, and a humanoid robotics manufacturer. Each of those businesses commands a different multiple, and each carries its own execution risk.
This guide uses Tesla’s numbers as a live teaching case to walk through the analytical framework any investor needs when evaluating a stock priced for a transformation that has not yet occurred: how to build a dual-scenario model, why entry price is the single most consequential variable in the analysis, and how to apply that framework to any company in transition, not just Tesla.
A forward P/E ratio of 188 to 217x looks like an error. For an investor running a standard screening tool, that number triggers an automatic flag for overvaluation. The instinct is to discard it or to assume the market has lost its mind.
The confusion is the right starting point.
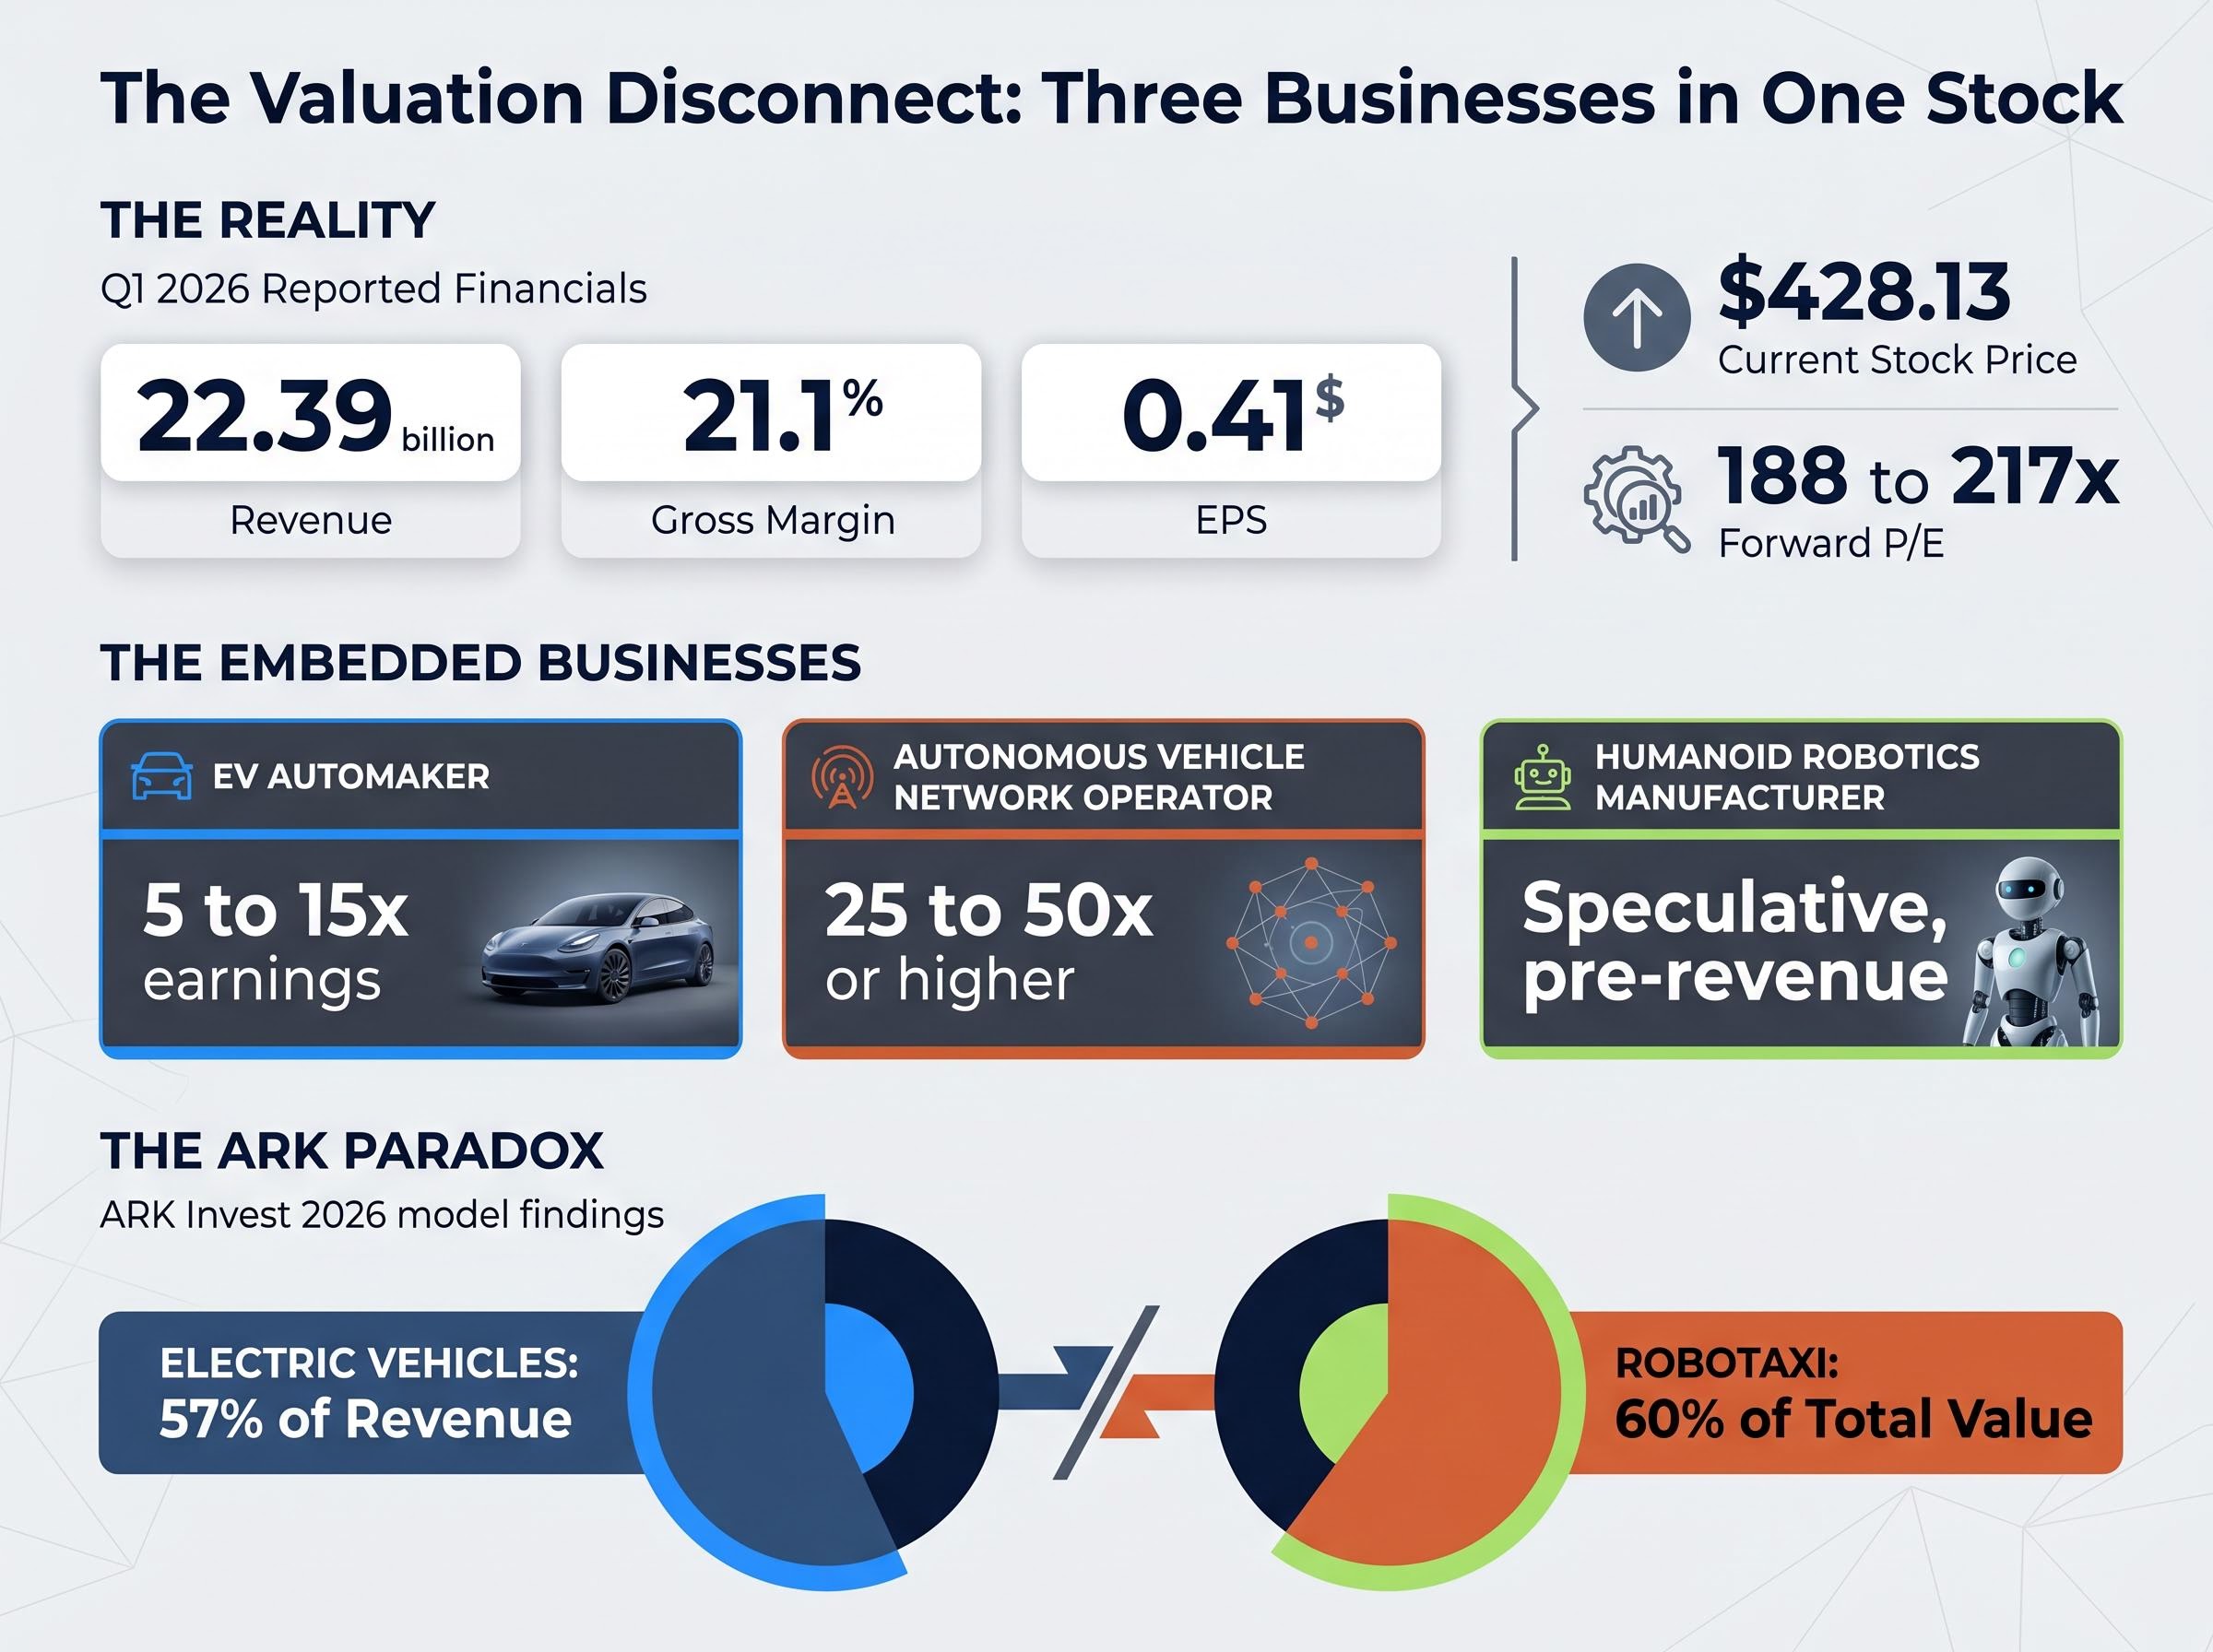
Tesla’s multiple is not a data error. It reflects the market pricing in businesses that do not yet appear in reported earnings. Q1 2026 delivered revenue of $22.39 billion, a gross margin of 21.1%, and earnings per share of $0.41. Those are the numbers of a profitable, large-scale automaker. The stock price of $428.13 is the price of something else entirely.
A single multiple cannot capture what the market is simultaneously valuing inside Tesla. Consider the three distinct business profiles embedded in the current price:
The peer-set selection problem sits underneath every multiple applied in a Tesla scenario: pricing the EV segment against legacy automakers at 5-15x implicitly assumes commoditisation prevails, while pricing it against software platforms at 25-50x assumes network effects dominate, and the Q1 2026 operational signals including a delivery miss, inventory above 50,000 units, and a 15% year-over-year decline in energy storage volume are the reality-checks that discipline which comparables set is defensible.
According to ARK Invest’s 2026 model, the robotaxi business is expected to contribute 60% of Tesla’s total value despite electric vehicles still representing 57% of revenue.
When a company’s current financials represent only one of several potential future business models, standard ratio analysis produces a misleading picture regardless of which direction the investor assumes. Recognising why the metric breaks down is the prerequisite to building a framework that actually works.
The bull case and the bear case for Tesla are not a matter of temperament. Both are internally coherent models built from the same Q1 2026 fundamentals. The disagreement is entirely a function of probability assigned to new business line execution.
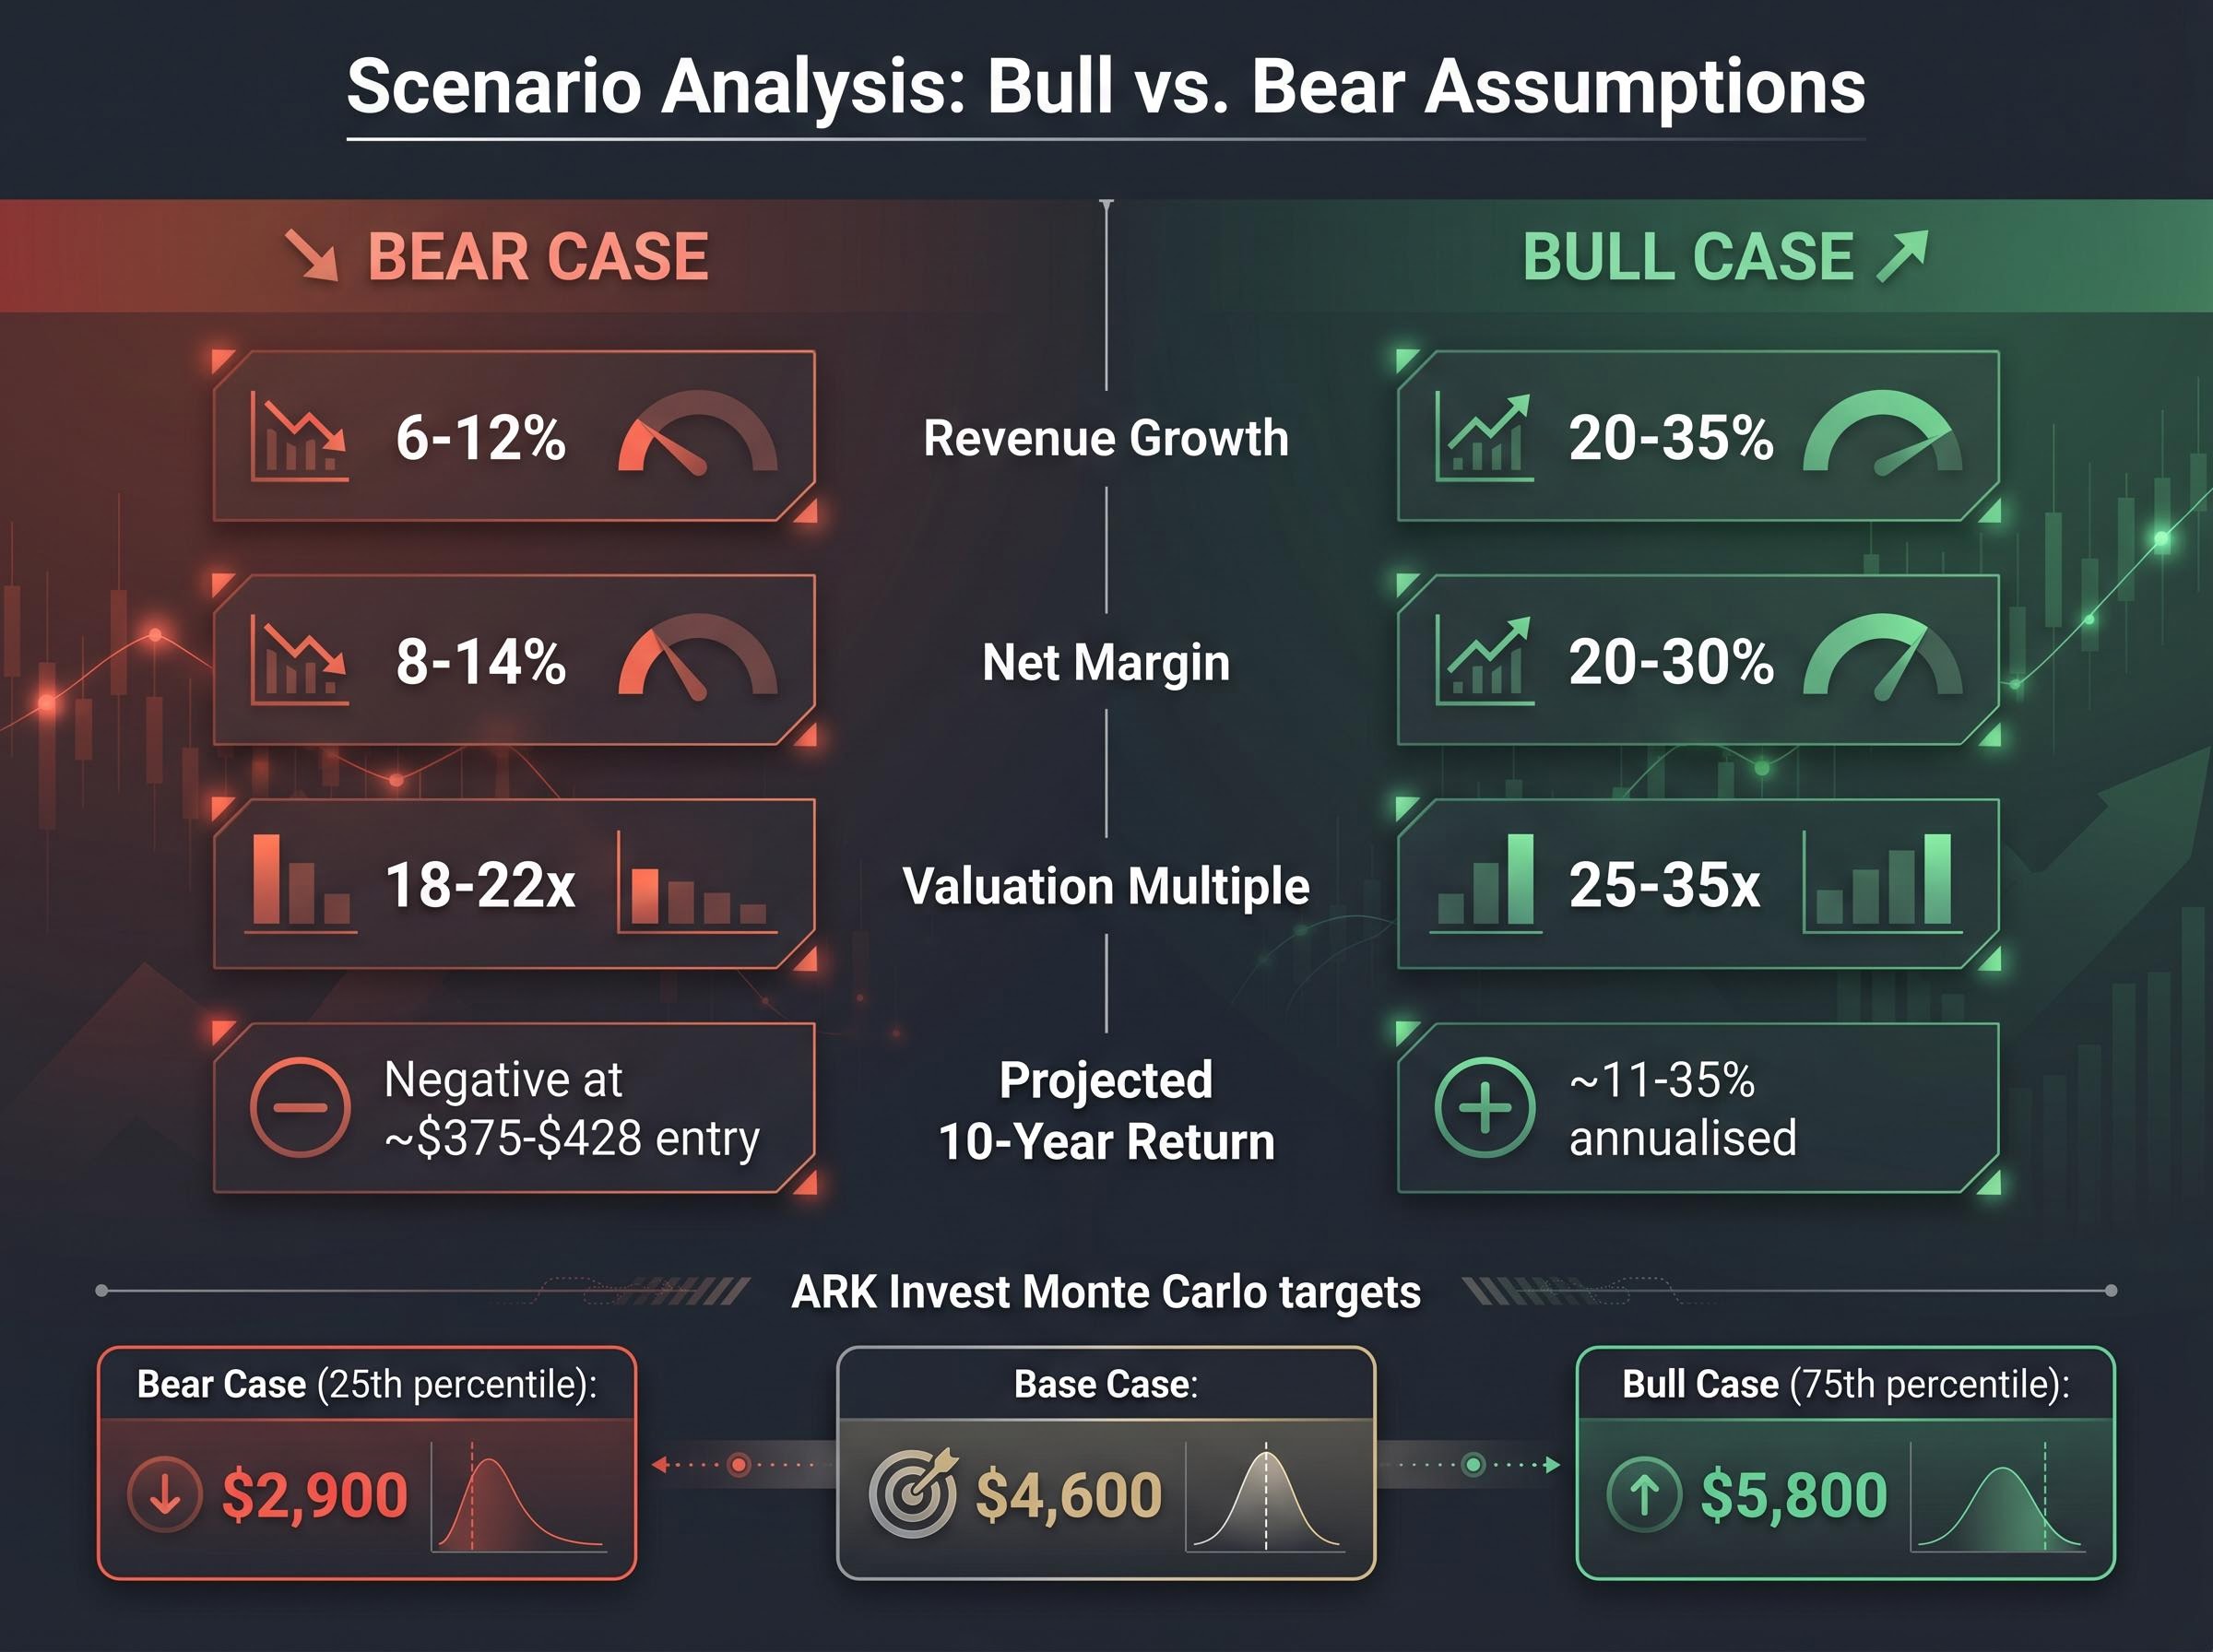
The bull case assumes revenue growth of 20 to 35 percent, net margins of 20 to 30 percent (compared to the current 7 to 10 percent range), and valuation multiples of 25 to 35x. Under those inputs, projected annualised returns over ten years land between approximately 11 and 35 percent. This scenario prices in full execution on autonomous driving, robotaxi network effects, and Optimus robotics at commercial scale.
The bear case assumes revenue growth of 6 to 12 percent, net margins of 8 to 14 percent, and valuation multiples of 18 to 22x. At an entry price of approximately $375 to $428 per share, every projected return outcome in this scenario is negative. This scenario treats Tesla as a maturing automaker facing margin compression and gives no credit to unproven business lines.
| Scenario | Revenue Growth | Net Margin | Valuation Multiple | Projected 10-Year Return |
|---|---|---|---|---|
| Bull Case | 20-35% | 20-30% | 25-35x | ~11-35% annualised |
| Bear Case | 6-12% | 8-14% | 18-22x | Negative at ~$375-$428 entry |
ARK Invest’s Monte Carlo modelling produces a base case of $4,600, a bear case of $2,900 (25th percentile), and a bull case of $5,800 (75th percentile). Morgan Stanley downgraded Tesla in December 2025, citing stretched valuation and EV headwinds through 2026.
Identical Q1 2026 inputs produce price outcomes ranging from $2,900 to $5,800 depending solely on the probability weights assigned to new business lines. The disagreement is not about what Tesla earns today. It is about which company Tesla becomes.
Seeing the two scenarios rendered numerically dissolves the idea that one side is simply being optimistic or pessimistic. The question for any investor is which set of assumptions they are willing to stake capital on.
The tool that separates investors who understand why they own a stock from those who are simply betting on a direction is a probability-weighted scenario model. Building one forces a level of analytical discipline that single-point price targets cannot provide.
The structure follows four steps:
ARK Invest operationalises this approach through Monte Carlo simulation, running thousands of iterations across variable assumptions to produce 25th percentile ($2,900), base ($4,600), and 75th percentile ($5,800) outcomes rather than a single number. Morgan Stanley takes a different approach, applying sector-appropriate multiples to near-term earnings, which inherently anchors the output closer to the automaker scenario.
Professionals working through companies in strategic transition typically use a three-tool ensemble rather than a single metric: Discounted Cash Flow applied to known earnings, sum-of-the-parts valuation to price each segment at an appropriate multiple, and probability-weighted scenario modelling to blend the outputs, because small shifts in probability calibration move the blended intrinsic value far more than adjusting growth assumptions within any individual scenario.
The honest output of this exercise is not a conviction call. It is an explicit map of what the investor believes, laid bare in numbers.
ARK’s framework identifies three pillars that carry the bull case: rapid vehicle unit growth, high software margins, and new business line execution. Each pillar has a concrete failure mode an investor can monitor in real time.
Vehicle unit growth faces commoditisation risk, particularly from Chinese competitors including BYD, which could compress margins across the EV sector. Software margins depend on Full Self-Driving (FSD) regulatory approvals proceeding on schedule; delays in regulatory classification directly erode the high-margin revenue that justifies elevated multiples. New business line execution is where the widest range of uncertainty sits: Optimus V3 production is targeted for late July to August 2026 at the Fremont facility, Cyber Cab production has started at Giga Texas, and robotaxi operations launched in limited capacity in Austin in June 2025 with expansions planned for Dallas, Houston, and beyond.
Five of the planned city expansions have been pushed back from original timelines. That is the probability-weighted model updating in real time. Tesla CFO guidance projects 2026 capital expenditures exceeding $25 billion, generating significant negative free cash flow while investing across multiple business lines simultaneously. Each delayed milestone or missed capital efficiency target is a direct input that shifts the probability weights in any honest model.
For investors who want to operationalise the probability-updating process between quarterly results, our dedicated guide to scenario monitoring triggers defines the specific metrics to track before purchase, including auto gross margin thresholds, robotaxi regulatory progress checkpoints, Optimus production milestones, and CapEx efficiency ratios, so each new data release can be evaluated against a pre-set framework rather than absorbed emotionally.
Every assumption in a valuation model is debatable. Revenue growth could land higher or lower. Margins may expand or compress. Multiples shift with market sentiment. One variable is entirely within the investor’s control: the price paid at the point of purchase.
The arithmetic is unforgiving. An investor who bought Tesla near $100 per share a few years prior enters every scenario with a different return profile than one buying at $428 today, even when both investors use identical forward earnings assumptions and scenario weights. The higher the entry price, the more the return curve compresses toward zero, and eventually past it.
At approximately $375 to $428 per share, even moderately optimistic assumptions about Tesla’s automotive business produce negative projected returns. At the current price, a buyer is entirely dependent on the AI and robotics scenarios materialising to generate an acceptable outcome.
Tesla reached a historical peak near $450 per share. Investors who purchased near that level may still be sitting on losses. Meanwhile, analyst EPS estimates declined more than 90 percent from their peak before recovering, with forward estimates projecting EPS growing more than 5x from current levels. That range illustrates how sensitive return projections are to the earnings trajectory assumed.
This is the concept of margin of safety applied to high-uncertainty stocks. The less certain the future cash flows, the larger the cushion required between the intrinsic value estimate and the entry price:
Margin of safety refers to the gap between what an investor calculates a stock is worth and the price they actually pay. The wider that gap, the more room exists for the thesis to be partially wrong and still produce a positive return. For a stock like Tesla, where the valuation range spans from $2,900 to $5,800, the margin of safety calculation is not a nice-to-have. It is the most actionable output of the entire analysis.
The CFA Institute analysis of margin of safety frames the concept as a qualitative as well as quantitative discipline, particularly for businesses where fair value is genuinely difficult to estimate, a condition that applies directly to any stock embedding speculative future revenue streams in its current price.
Tesla is the case study, not the lesson itself. The analytical framework transfers to any company whose stock price embeds future businesses that do not yet appear in financial statements, where the gap between bull and bear valuations is unusually wide, and where execution on unproven business lines drives the outcome spread.
Three questions form the diagnostic for any transitional stock:
Calibrating execution timelines matters. Elon Musk’s track record provides a useful reference: in 2016, Tesla claimed full autonomy hardware was installed in all vehicles; in 2019, the company projected one million robotaxis by the end of 2020 (not met); in 2021, Optimus deployment readiness was projected for 2022 (not met). The core innovations eventually materialised, but later and at smaller initial scale than announced. That pattern is itself a probability input.
The California regulatory gap illustrates execution risk in real time. Tesla’s ride-hailing service is not currently classified as fully autonomous under California regulations, and new DMV rules effective 1 July 2026 allow citations for autonomous vehicles operating without proper classification. For one of the most strategically significant U.S. markets, that is material overhang. As Professor Aswath Damodaran of NYU Stern has argued in his public valuations, honest valuation requires confronting both the optimistic and pessimistic scenarios with equal analytical rigour, a principle that applies to every transitional company, not just Tesla.
Position sizing is not a risk disclaimer appended after the valuation work is complete. It is a quantitative output of the scenario spread.
The wider the distance between bull and bear outcomes, the smaller the position a disciplined investor should take relative to their portfolio. Tesla’s bear case implies negative returns at the current price. A position sized on bull case conviction alone assumes away the scenario with the higher historical base rate. The appropriate position size is a function of how wide the bear case downside is, not merely of confidence in the upside.
When a company’s stock price is pricing in businesses that do not yet exist in reported financials, the standard analytical toolkit fails. Scenario-based probability weighting becomes the only honest approach.
Tesla makes the point in real numbers. Q1 2026 EPS of $0.41, a forward P/E of roughly 200x, a Hold consensus from 26 analysts, and ARK’s $4,600 base case are all simultaneously true. Each reflects a different but internally coherent answer to the question of which company Tesla becomes.
Entry price determines whether even a correct thesis generates an acceptable return. That is the arithmetic that every investor controls. The near-term milestones that will test the bull case assumptions are arriving: Optimus V3 production start targeted for late July to August 2026, robotaxi city expansion progress beyond Austin, and California regulatory classification outcomes by 1 July 2026.
The framework outlined here is not specific to Tesla. Any investor can build a dual-scenario model for a stock they are currently evaluating: establish the base case from reported financials, define the bull and bear assumptions explicitly, assign probability weights, and compare the weighted output to the current price. The discipline is in making the assumptions visible.
The same scenario-weighting logic that applies to Tesla as a standalone position also applies to investors who hold it indirectly through broad US equity ETFs: Tesla’s weighting in major cap-weighted indexes means that index-level concentration risk creates unintended Tesla exposure for passive investors who believe they have diversified away single-stock outcomes.
This article is for informational purposes only and should not be considered financial advice. Investors should conduct their own research and consult with financial professionals before making investment decisions. Past performance does not guarantee future results. Financial projections are subject to market conditions and various risk factors.
—
A probability-weighted scenario model assigns explicit percentage likelihoods to different future outcomes (bull, base, and bear cases), then blends the resulting valuations into a single weighted range. This approach forces investors to quantify their assumptions rather than simply choosing an optimistic or pessimistic single-point price target.
Tesla's forward P/E of roughly 188-217x reflects the market pricing in future businesses, including an autonomous vehicle network and humanoid robotics, that do not yet appear in reported earnings. Standard automaker multiples of 5-15x apply only to the EV segment, so a single P/E ratio cannot capture all three business profiles embedded in the current stock price.
At an entry price of approximately $375-$428 per share, even moderately optimistic assumptions about Tesla's automotive business produce negative projected returns, meaning a buyer at current prices is entirely dependent on the AI and robotics scenarios materialising. The higher the entry price, the narrower the range of scenarios that can still generate an acceptable return.
Margin of safety is the gap between an investor's estimated intrinsic value of a stock and the price they actually pay; the wider the gap, the more room exists for the investment thesis to be partially wrong and still produce a positive return. For stocks like Tesla, where the fair value range spans from $2,900 to $5,800 depending on scenario assumptions, margin of safety is the most actionable output of the entire valuation analysis.
The framework applies to any company whose current stock price embeds future businesses not yet visible in reported financials: start with reported base-case numbers, define explicit bull and bear assumptions for each business segment, assign probability weights to each scenario, and compare the weighted output to the current price. The key diagnostic questions are what business the market is pricing in, what must be true for those assumptions to hold, and the maximum entry price that still generates an acceptable return if only the base case materialises.