3 ASX ETFs for AI Exposure: Comparing IVV, NDQ and GXAI
8 mins ago

When 42 analysts covering the same stock produce price targets ranging from $25 to $600, the disagreement is not noise. It is a precise measurement of how much uncertainty is baked into the valuation, and a map of the analytical work investors need to do before deciding whether a stock belongs in their portfolio.
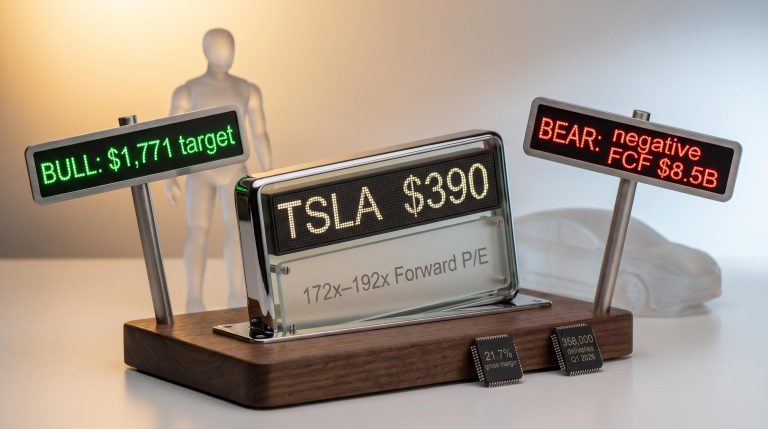
Tesla in May 2026 is trading near $411 with a price-to-earnings ratio above 300x, a positive Q1 EPS beat, and full-year free cash flow projected at negative $5.1 billion. It holds no commercial robotaxi permits in the United States, its Optimus humanoid robot programme has not yet generated a dollar of revenue, and Waymo is already operating 500 commercial robotaxis. That combination of a strong estimate beat and a deeply contested valuation makes Tesla one of the most instructive case studies available for learning how to evaluate a company in transition.
This guide uses Tesla’s Q1 2026 numbers to walk through a transferable methodology for bull and bear case scenario analysis, connecting revenue assumptions to valuation multiples to projected returns, and showing why the price paid at entry is one of the most consequential decisions in any investment thesis.
A price-to-earnings ratio of 301-314x would be dismissed as absurd for a mature manufacturer. For a company in the middle of reinventing its business model, the number is not obviously wrong; it is simply measuring the wrong thing.
Earnings-based valuation metrics like P/E assume that current profitability is a reasonable proxy for future profitability. When a company is spending aggressively to build new revenue streams that do not yet exist, that assumption breaks. The metric captures the cost of the transformation without capturing the potential payoff.
Tesla’s current state makes this visible. The automotive business generates net margins of roughly 7-10%. The stock price, however, reflects a future in which Tesla operates as a software and robotics platform with margins of 20-30%. Those two realities coexist in the same share price, and a single P/E ratio cannot reconcile them.
Tesla’s $1.33 trillion market capitalisation is not a bet on cars. It is a probability-weighted sum of outcomes across Optimus, robotaxi, and Full Self-Driving (FSD), the software system that enables autonomous vehicle capabilities, none of which have generated meaningful commercial revenue as of May 2026.
The Q1 2026 results illustrate the tension. Non-GAAP earnings per share came in at $0.41, beating consensus of $0.34 by approximately 21%. Full-year free cash flow, however, is projected at negative $5.1 billion. The business beat estimates on a quarterly basis while burning cash on an annual one.
The Q1 2026 earnings beat, which saw Tesla report $22.39 billion in revenue and a 21.7% gross margin against a 17% consensus estimate, created a short-term positive signal that nonetheless left the forward P/E above 188x, illustrating the core tension between operational improvement and a valuation multiple that can only be justified by AI and robotics delivery.
When a stock price reflects a future state rather than a current one, the investor’s task shifts. Rather than valuing what the business earns today, the work becomes probability-weighting competing futures:
The gap between those two columns is the entire valuation debate. The sections that follow build a framework for navigating it.
Any valuation scenario, regardless of the company, rests on three variable levers: the rate at which revenue grows, the percentage of that revenue converted to profit, and the multiple the market assigns to those earnings at the end of the projection period. The bull case for Tesla assigns aggressive but internally coherent numbers to all three.
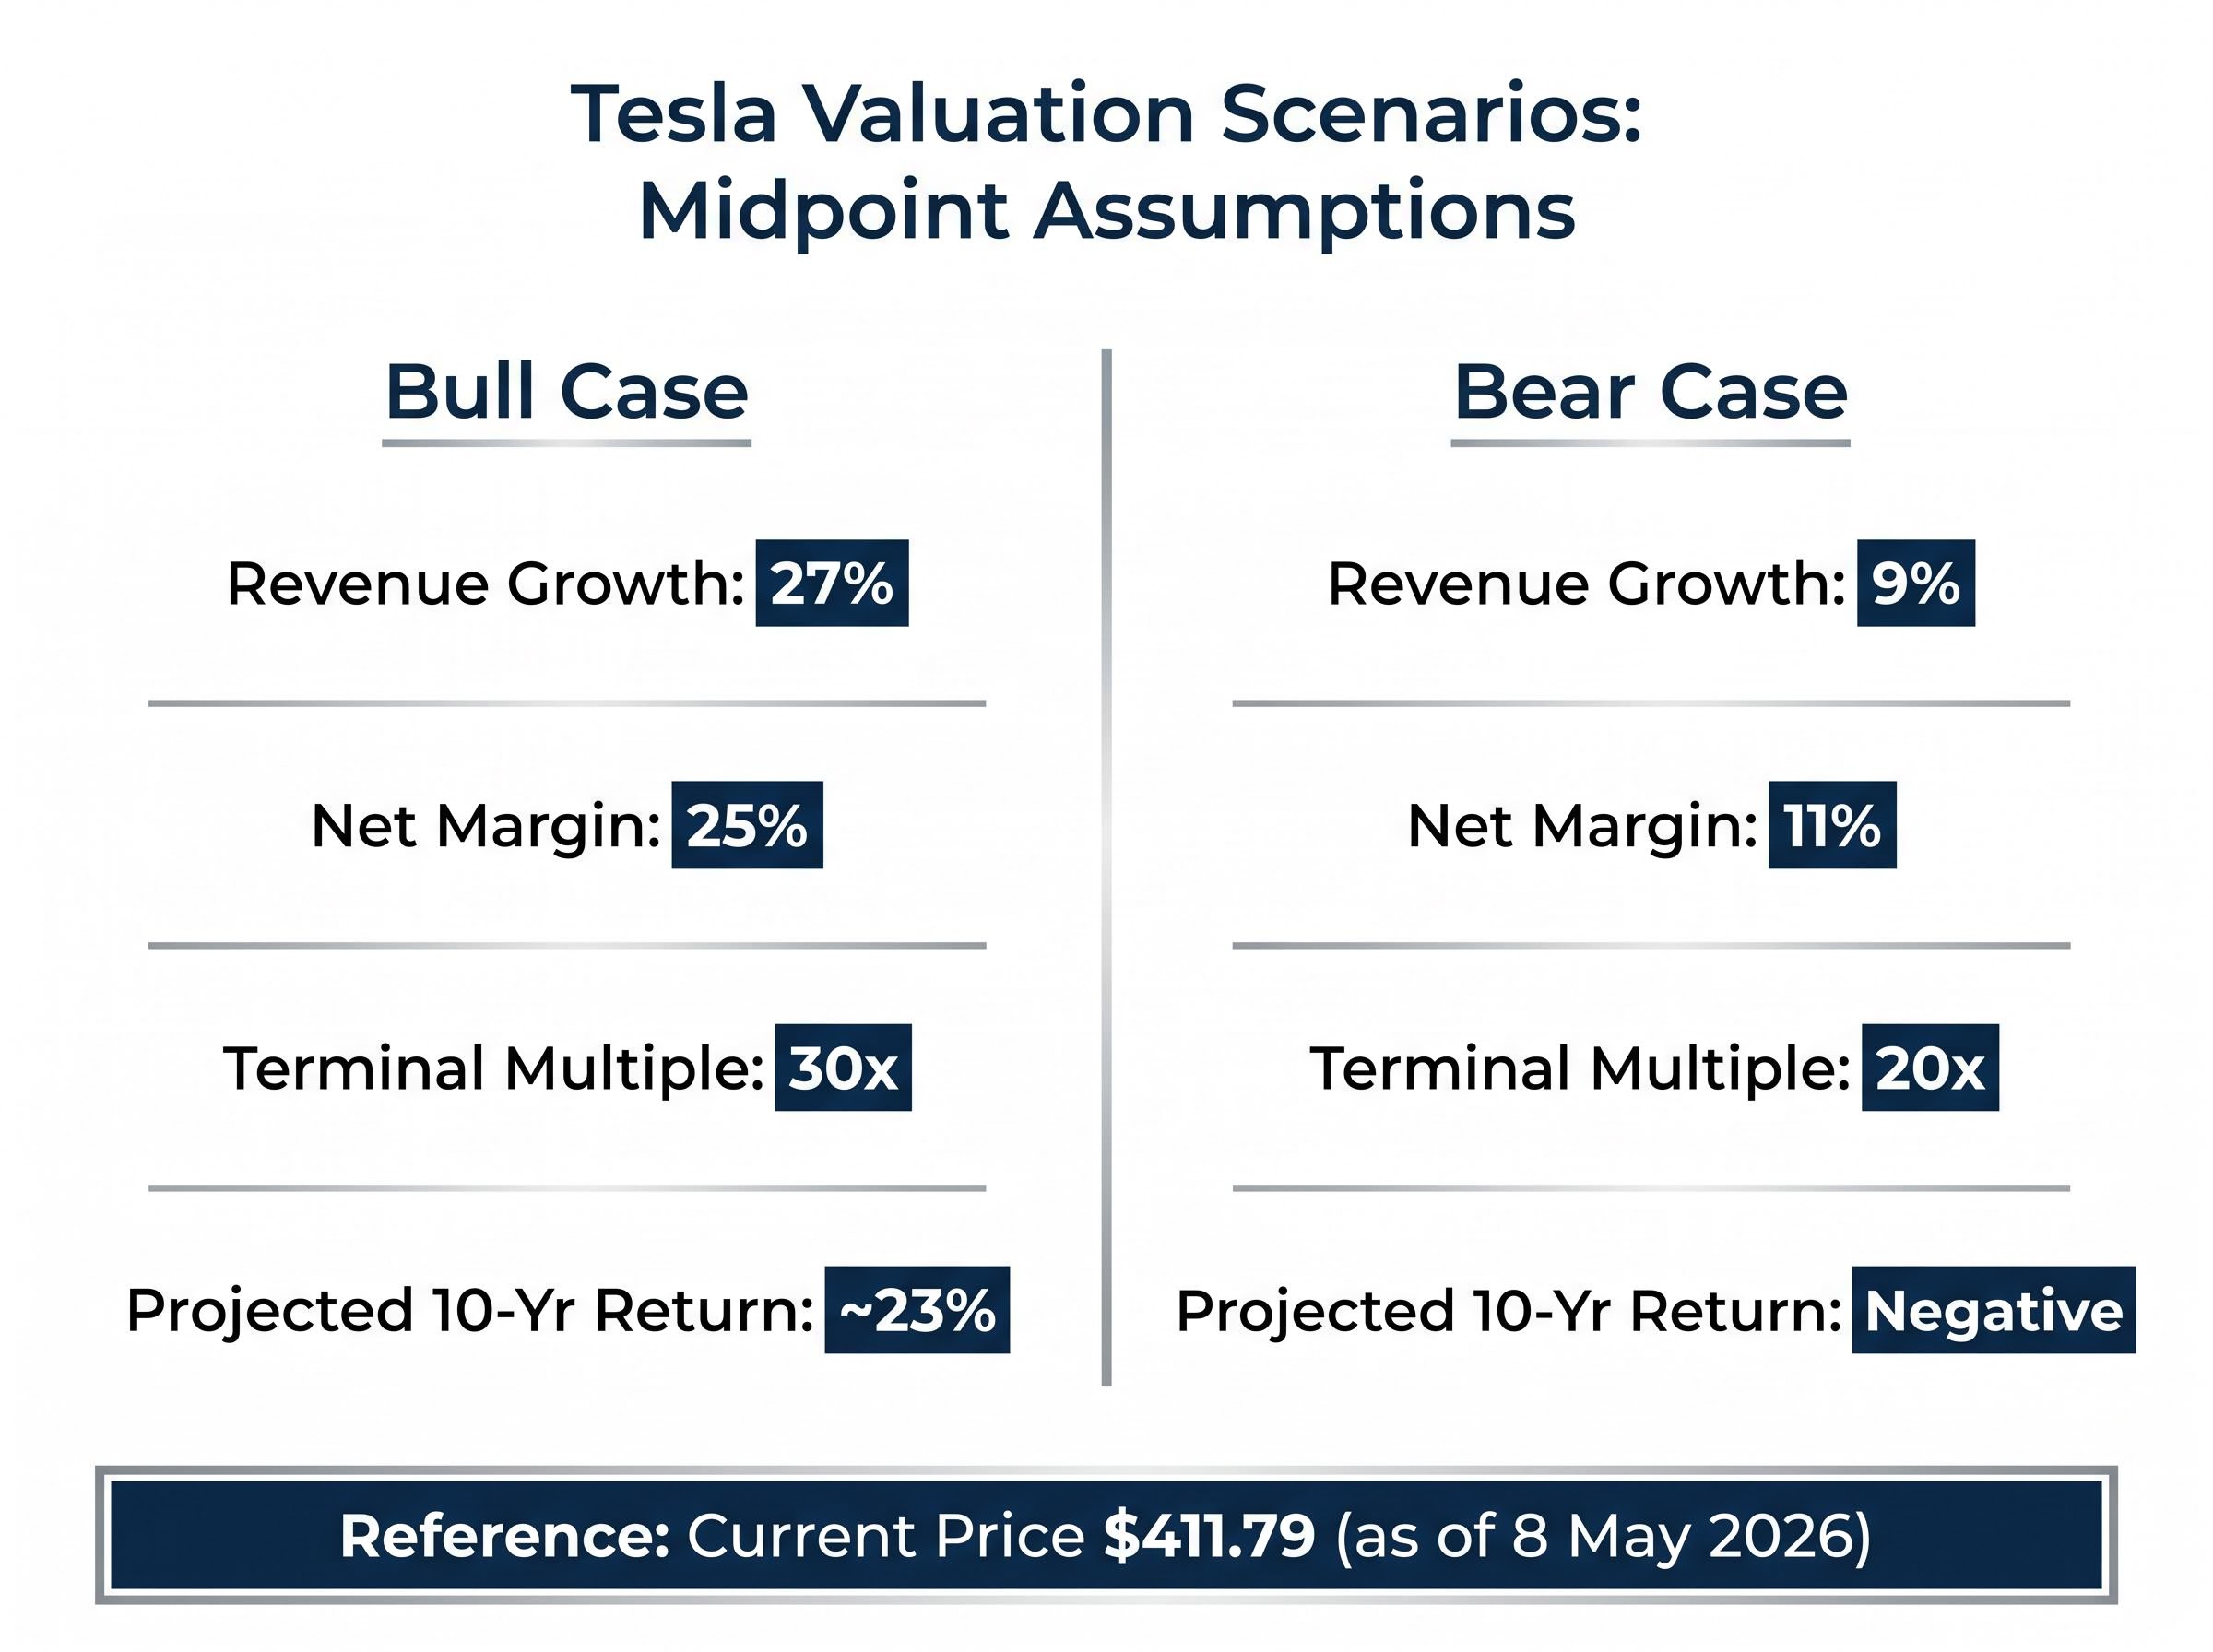
Under the optimistic scenario, revenue growth ranges from 20-35% annually, with a midpoint of approximately 27%. That growth rate assumes successful commercialisation of robotaxi services, with expansion planned for Austin, Dallas, and Houston, alongside meaningful revenue contributions from Optimus. Net profit margins expand to 20-30%, reflecting the higher-margin economics of software, autonomy, and robotics relative to vehicle manufacturing. The terminal valuation multiple lands between 25-35x earnings, consistent with how the market prices high-growth technology platforms.
Damodaran’s DCF valuation framework establishes that terminal value — the discounted sum of all cash flows beyond the explicit forecast period — typically accounts for the majority of a transition-phase company’s estimated worth, which is precisely why the terminal multiple assumption carries such outsized weight in both the bull and bear scenarios modelled here.
| Variable | Low | Midpoint | High |
|---|---|---|---|
| Revenue growth (annual) | 20% | 27% | 35% |
| Net profit margin | 20% | 25% | 30% |
| Terminal valuation multiple | 25x | 30x | 35x |
| Projected 10-year annualised return | 11% | ~23% | 35% |
The mathematics are coherent. At the high end, a 35% annualised return over a decade would be exceptional by any standard.
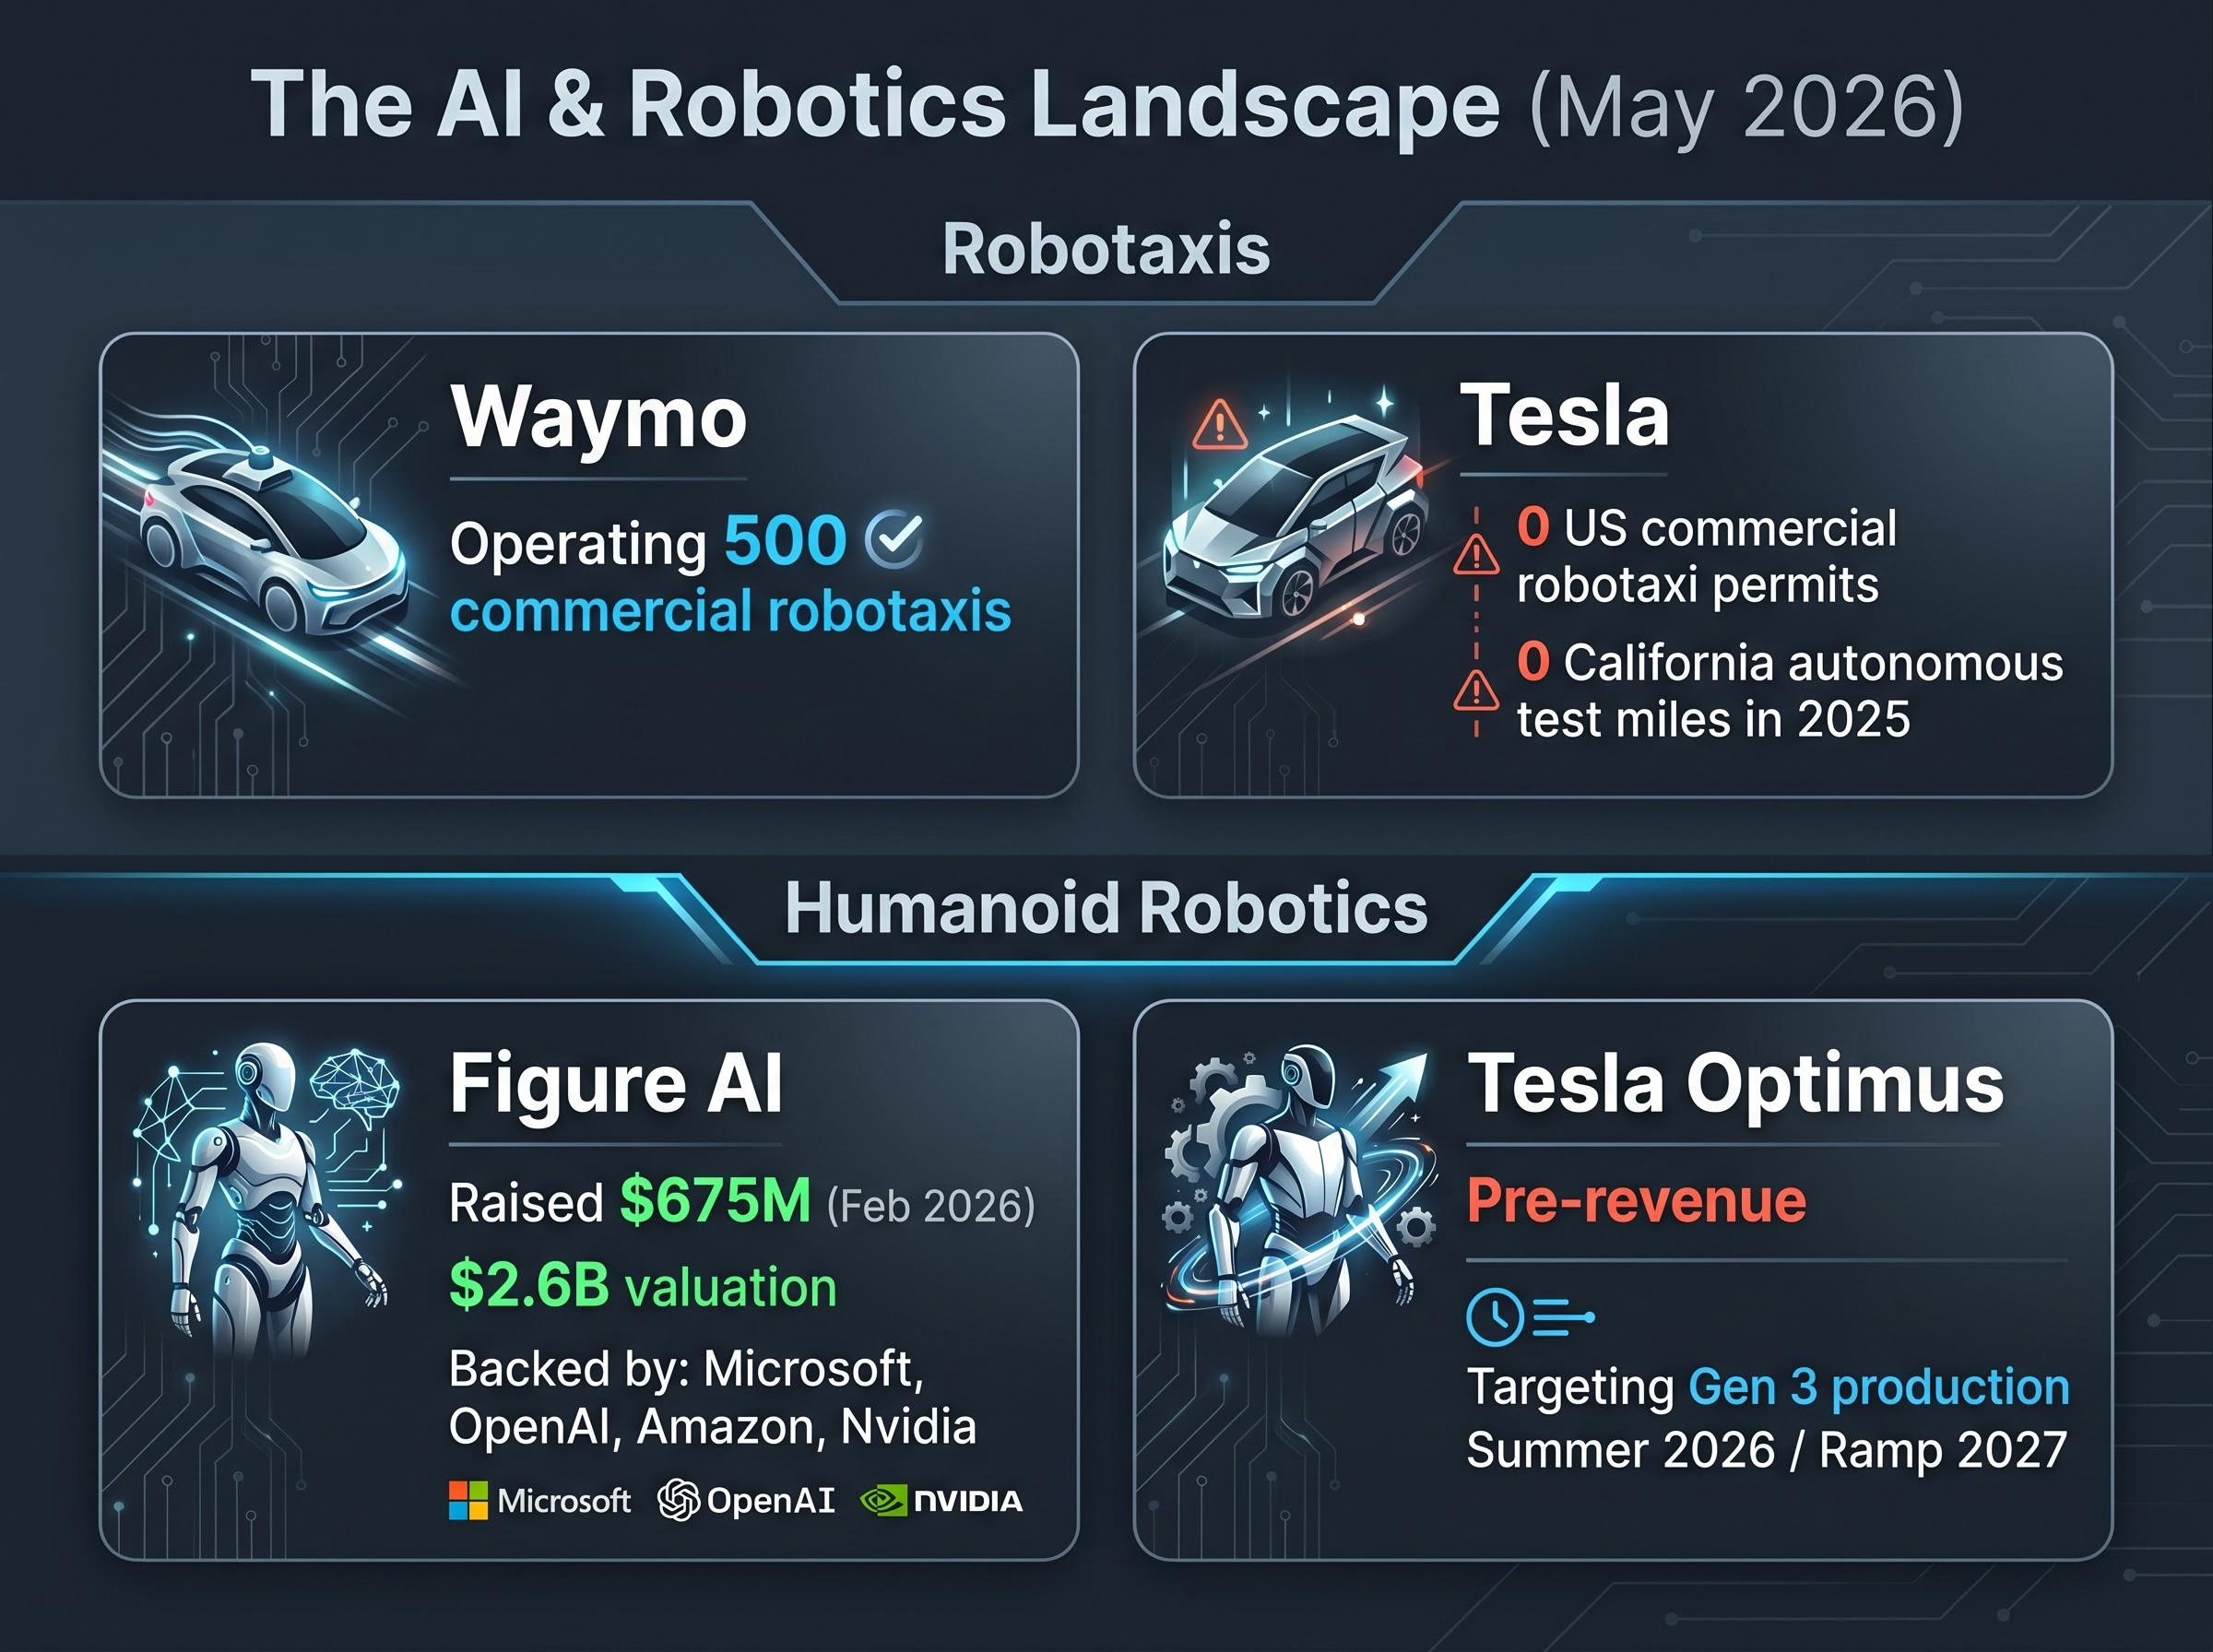
The difficulty is the distance between these assumptions and Tesla’s current operational reality. Tesla has no US commercial robotaxi permits and logged zero autonomous test miles in California during 2025. Optimus Gen 3 production is targeted for summer 2026 with a high-volume ramp in 2027, but the programme remains pre-revenue. Each of these assumptions is a specific bet with execution risk attached.
Analysts and research firms that have modelled full bull case realisation, including ARK Invest with a $2,600 per share target by 2029, assign an estimated 5-10% probability to the scenario playing out in full. That figure is not a dismissal; it is a position-sizing signal. A 5-10% probability of a 35% annualised return has meaningful expected value, but only if the position size reflects the probability rather than the enthusiasm.
The bear case applies the same three-variable framework to a different set of assumptions. This is not a collapse scenario. It models Tesla as a successful electric vehicle company that simply does not become an AI and robotics platform on the timeline the market currently prices.
Revenue growth slows to 6-12% annually, with a midpoint of approximately 9%, reflecting solid automotive performance without the step-change contribution of robotaxi or Optimus revenue. Net profit margins settle between 8-14%, consistent with a well-run automaker benefiting from scale but not from software economics. The terminal multiple compresses to 18-22x earnings, closer to how the market values premium industrial companies.
| Variable | Low | Midpoint | High |
|---|---|---|---|
| Revenue growth (annual) | 6% | 9% | 12% |
| Net profit margin | 8% | 11% | 14% |
| Terminal valuation multiple | 18x | 20x | 22x |
| Projected 10-year return at ~$375-$380 entry | Negative | Negative | Negative |
Every column produces a negative projected return at an entry price near current levels. A good electric vehicle company with above-average margins and no operational collapse still does not justify a $411 share price if the AI and robotics transformation does not deliver.
The competitive landscape reinforces the bear case probability. Waymo is operating 500 commercial robotaxis with active permits as of May 2026, while Tesla has none. Figure AI raised $675 million in February 2026 at a $2.6 billion valuation, with Microsoft, OpenAI, Amazon, and Nvidia participating, introducing well-funded competition into the humanoid robotics space Tesla’s Optimus targets. Energy storage revenue declined 12% year-on-year in Q1 2026, removing another potential growth offset.
The California CPUC permit absence sits at the centre of the bear case regulatory argument: Waymo completed approximately 500,000 paid rides per week as of early 2026 under an active commercial deployment permit, while Tesla operated zero revenue-generating rides in the state, a concrete operational gap that scenario models must quantify rather than acknowledge in passing.
Four conditions define the bear case trigger set:
The core lesson here is that the quality of a company and the quality of an investment at a specific price are separate questions. Tesla can be genuinely impressive and still be a poor investment at $411 if the transformation does not deliver on schedule.
The bull and bear scenarios describe the same company arriving at different futures. Entry price determines what those futures mean for the investor’s actual returns.
Tesla traded near $100 per share in the recent past. It reached a year-to-date high of approximately $450-$454 in January 2026. As of 8 May 2026, shares sit at approximately $411.79, down roughly 13.42% year-to-date. The same bull case scenario, identical revenue growth, identical margins, identical terminal multiple, produces a dramatically different annualised return for an investor who bought at $100 versus one who bought at $450.
Two investors can own the same company, hold it for the same period, and watch the same bull case unfold identically, yet one earns a strong return while the other breaks even or loses money. The difference is not analysis, conviction, or timing of sale. It is entirely a function of what they paid.
The 8-week losing streak that ended 17 April 2026, with shares rising approximately 15% in a single week, illustrates how sentiment-driven volatility amplifies entry price risk. A buyer at the bottom of that streak and a buyer at the top faced the same company with the same fundamentals but entered at materially different prices.
The scenario framework converts entry price analysis into a decision structure. If the full bull case has a 5-10% probability of realisation, what entry price makes the expected value attractive given that probability? At $411, the bull case return is compelling but the probability is low. At a lower entry price, the same probability weight produces a more favourable expected value because the potential upside expands while the downside narrows.
The analyst consensus price target of approximately $398-$403 provides a reference point, not a directive. Consensus targets reflect the average of widely divergent views. More useful is the investor’s own scenario-derived threshold: the price at which the probability-weighted expected return across bull and bear outcomes meets their required rate of return.
Forward EPS growth of more than 5x current levels is embedded in analyst estimates, which means the market already prices significant earnings expansion. Paying a premium above the consensus target requires confidence that the actual trajectory will exceed what is already priced in.
Timeline risk compounds differently from other investment risks. A two-year delay in a ten-year scenario does not reduce the ultimate return by 20%; it compresses the growth runway, delays the cash flow inflection, and often coincides with additional capital consumption during the wait. For transition-phase companies, timelines are not a scheduling detail. They are a valuation input.
Tesla’s history of ambitious projections followed by delays is well documented:
The pattern is consistent: ambitious timelines, meaningful slippage, eventual progress but on a longer runway than originally communicated. This supports the bull case probability being nonzero, since delivery does tend to follow, but it also justifies applying a discount to the probability of any given timeline being met on schedule.
The $575 spread between Wedbush’s $600 price target (maintained by analyst Dan Ives) and GLJ Research’s $25 target (maintained by analyst Gordon Johnson) is the widest in Tesla’s coverage universe. That gap is, in large part, a disagreement about timelines. Both analysts can observe the same Optimus prototype and the same FSD beta performance; what they disagree on is when, and with what probability, these programmes reach commercial scale.
Investors who build explicit timeline buffers into their scenario probability weights, adding one to three years to any stated commercialisation date before assigning a probability, tend to produce more resilient investment decisions than those who take stated timelines at face value.
Tesla is the case study. The methodology is the takeaway.
The three-variable scenario framework, revenue growth rate, net profit margin, and terminal valuation multiple, applies to any company where the stock price reflects a future state that has not yet been earned. Whether the company is a biotech awaiting FDA approval, a fintech scaling into new markets, or an industrial firm pivoting to software, the analytical structure is the same.
Tesla’s Q1 2026 results demonstrate why honest inputs matter. The company beat EPS estimates ($0.41 versus $0.34 consensus), grew deliveries 6.3% year-on-year, and expanded gross margins by 478 basis points year-on-year. Those are genuinely positive operational signals. At the same time, full-year free cash flow has deteriorated to a projected negative $5.1 billion. Short-term operational improvement and long-term execution risk coexist, and both must appear in any credible scenario analysis.
Institutions reach different conclusions from the same data. BlackRock increased its Tesla holdings by 5% in Q1 2026, while the analyst consensus rating remains a hold. Neither is wrong. They are applying different probability weights to the same set of uncertain outcomes.
The five-step scenario analysis framework distilled from this guide:
Defining monitoring triggers before purchase — specific observable metrics like auto gross margin crossing 18%, regulatory permit announcements, or Optimus production milestones — converts a static scenario model into a living framework that can be updated with each quarterly earnings release rather than revisited only when conviction wavers.
The $25-$600 analyst spread on Tesla is not an anomaly. It is the natural output of a market trying to price a company whose future is genuinely uncertain. Investors do not need to resolve that uncertainty to make a disciplined decision. They need to identify at what price the expected value becomes attractive given their own probability weights, and then wait for that price.
Investors wanting to place Tesla’s valuation debate within the broader architecture of speculative cycles will find our deep-dive into Minsky financing stages and AI valuations, which examines how the transition from hedge to speculative financing structures across the AI sector maps onto historical bubble episodes and what that context implies for probability-weighting any single company’s long-horizon bull case.
This article is for informational purposes only and should not be considered financial advice. Investors should conduct their own research and consult with financial professionals before making investment decisions. Past performance does not guarantee future results. Financial projections are subject to market conditions and various risk factors.
Bull and bear case scenario analysis is a framework where investors assign specific assumptions for revenue growth, profit margins, and terminal valuation multiples to model optimistic and conservative outcomes, then calculate the implied return at the current share price for each scenario.
Two investors holding the same stock through an identical bull case outcome can experience dramatically different returns based solely on what they paid at entry; the investor who bought at a lower price earns a higher annualised return even if every other variable is identical.
Price-to-earnings ratios assume current profitability is a reasonable proxy for future profitability, but transition-phase companies spend heavily on new revenue streams that do not yet exist, meaning the metric captures transformation costs without capturing the potential payoff.
Investors can apply a timeline discount by reviewing a company's historical delivery record against its stated targets and adding one to three years to any projected commercialisation date before assigning a probability to that scenario playing out on schedule.
A wide spread between analyst price targets, such as the range from $25 to $600 across 42 analysts, reflects genuine uncertainty about which future the company will deliver and signals that investors must build their own probability-weighted scenarios rather than relying on consensus as a single answer.