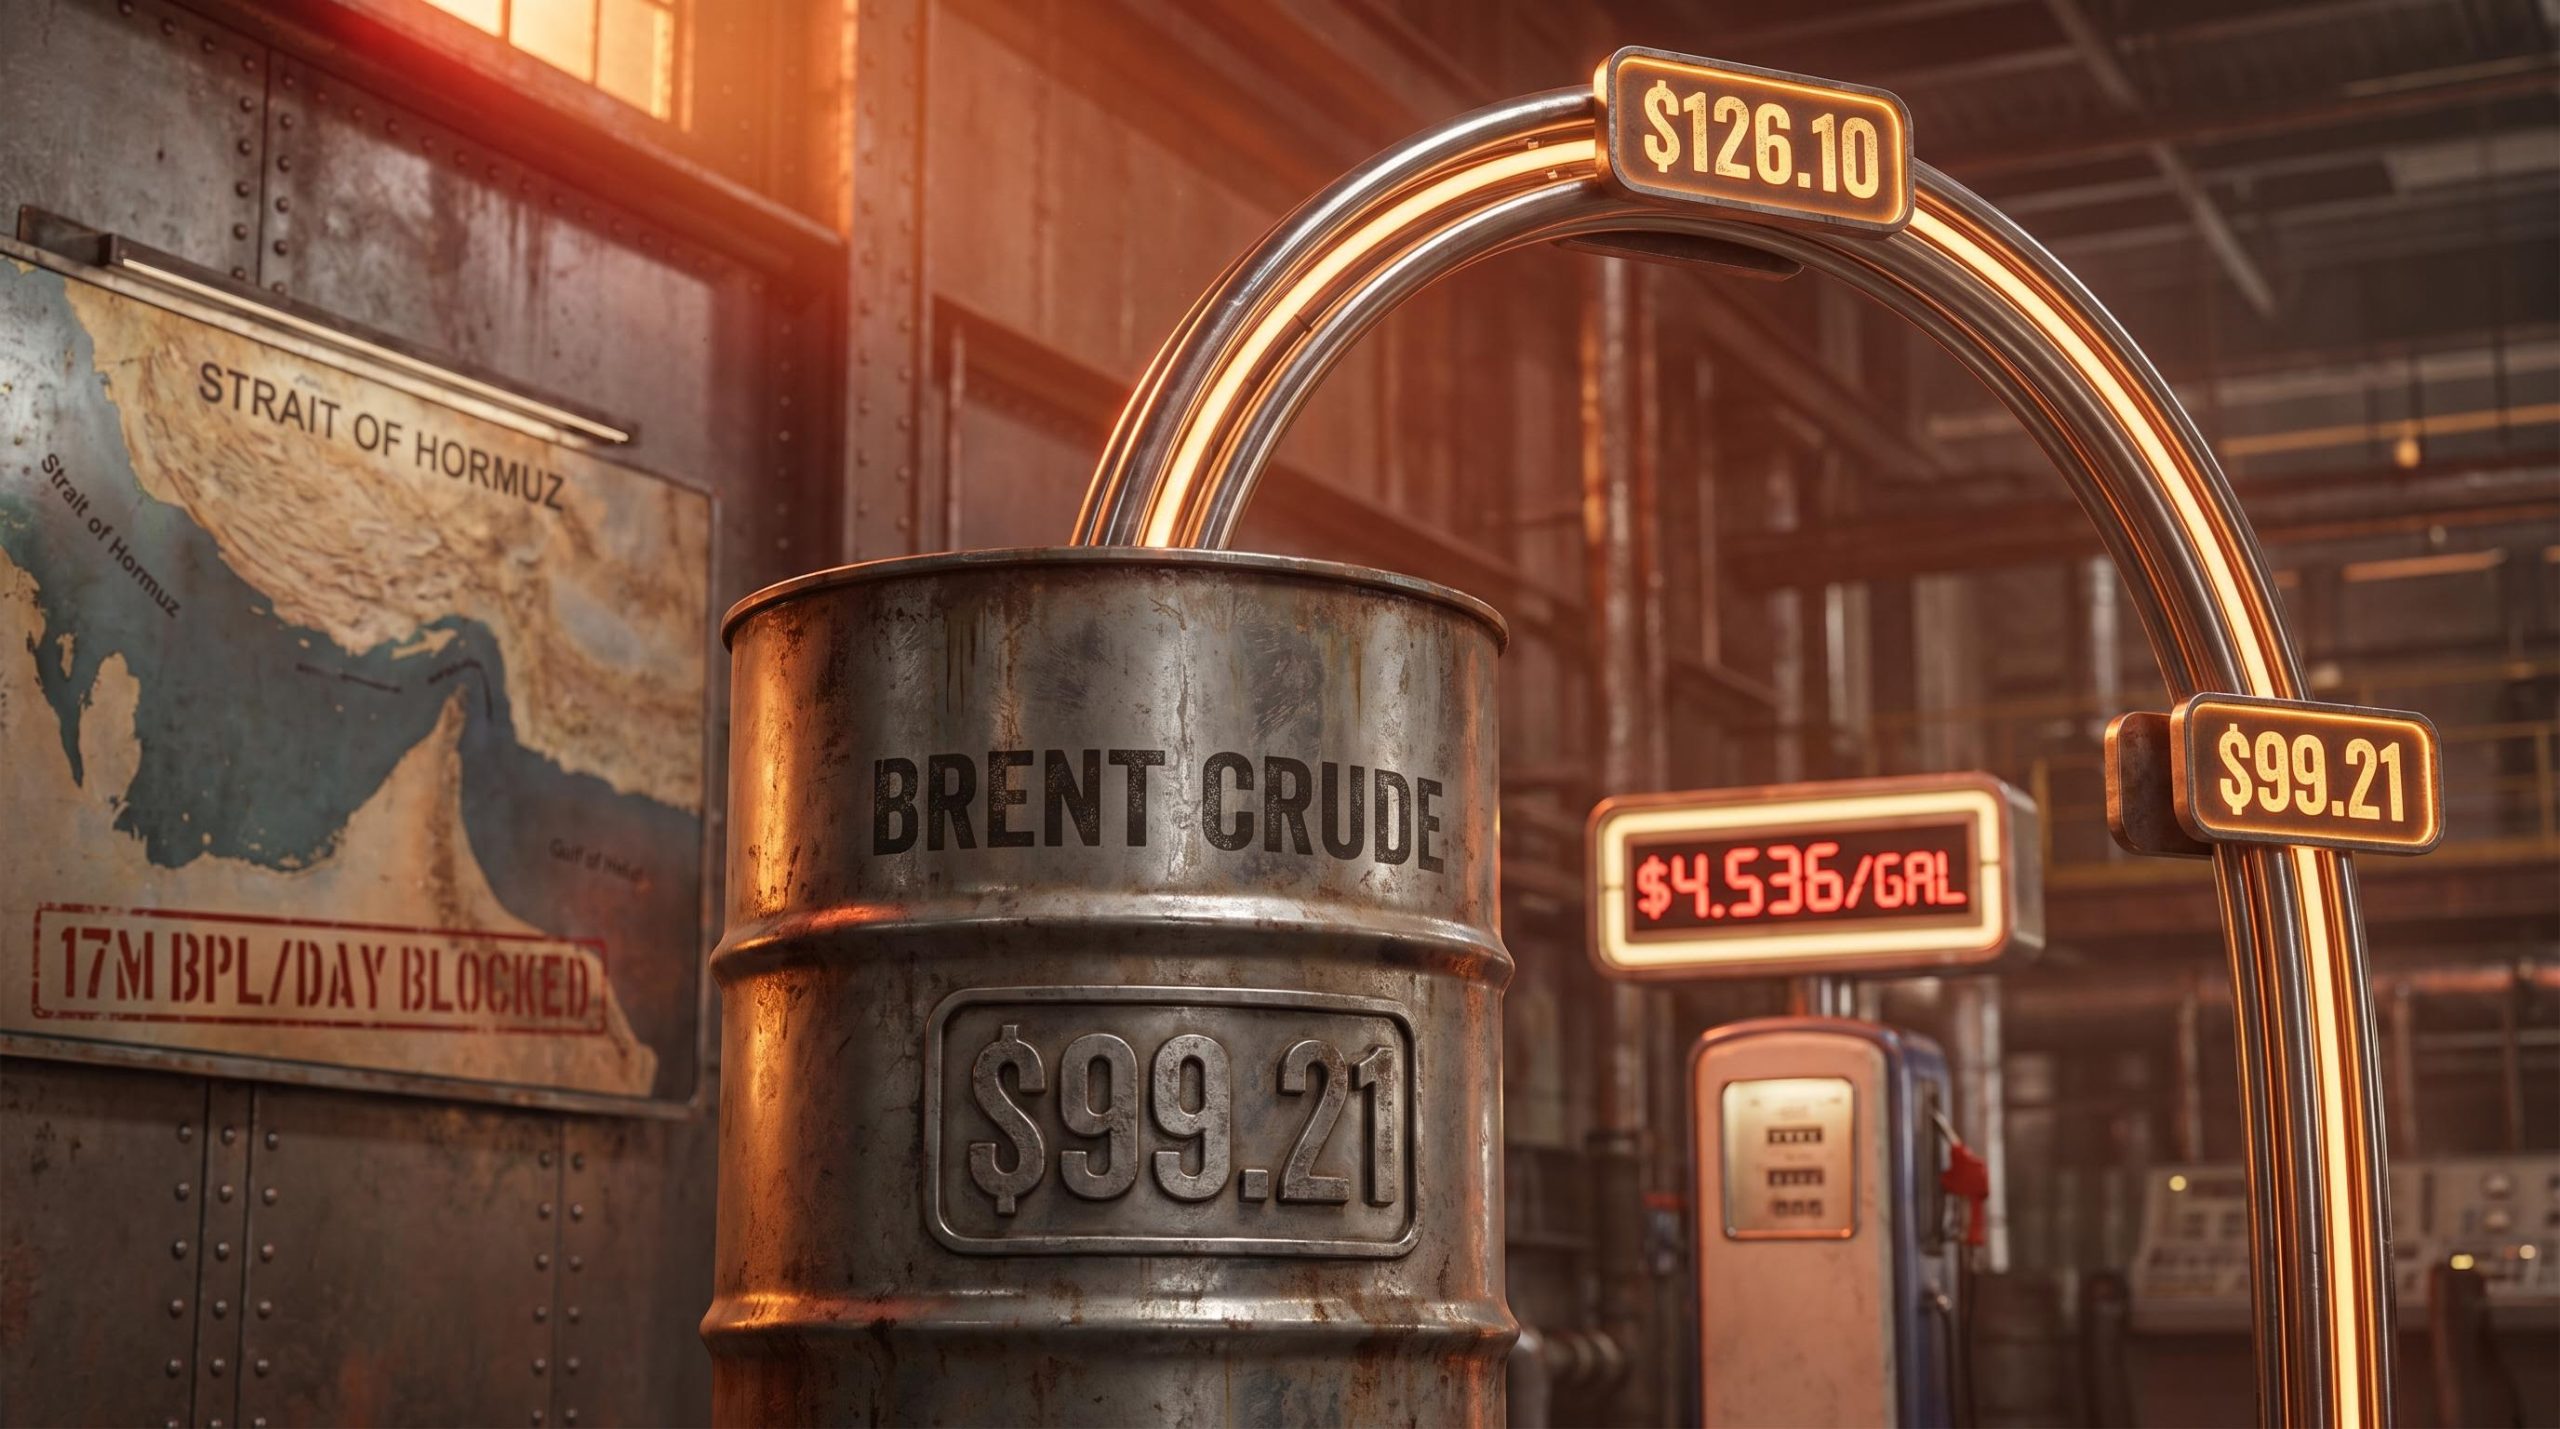
Brent crude fell roughly 2% toward $99 per barrel on 7 May as Washington and Tehran moved within 48 hours of a potential ceasefire agreement, erasing a chunk of the war premium that had driven prices to an intraday high of $126.10 just one week earlier. The U.S.-Iran war, now in its tenth week, has kept the Strait of Hormuz effectively closed since late February, stranding roughly 17 million barrels per day of normal transit volume and pushing U.S. gasoline prices above $4.50 per gallon for the first time since 2022. Formal peace talks are expected to begin as soon as next week in Pakistan, with Iran’s formal response to a U.S. memorandum of understanding due around 8 May.
What follows is an analysis of how the war premium built, why it is now partially unwinding, what the Strait’s closure has meant in hard numbers, and what specific signals investors should track as negotiations develop.
From $126 to $99: how the war premium built and why it is breaking
Oil prices have traced an arc shaped entirely by diplomatic signals. In late April, Brent climbed through five consecutive days of gains to reach $105.33 on 24 April, driven by stalled ceasefire talks and fears of prolonged Hormuz closure. By 30 April, with Iran’s Supreme Leader rejecting U.S. Gulf presence and U.S. Central Command requesting hypersonic missiles, Brent hit an intraday peak of $126.10 before closing at $119.98.
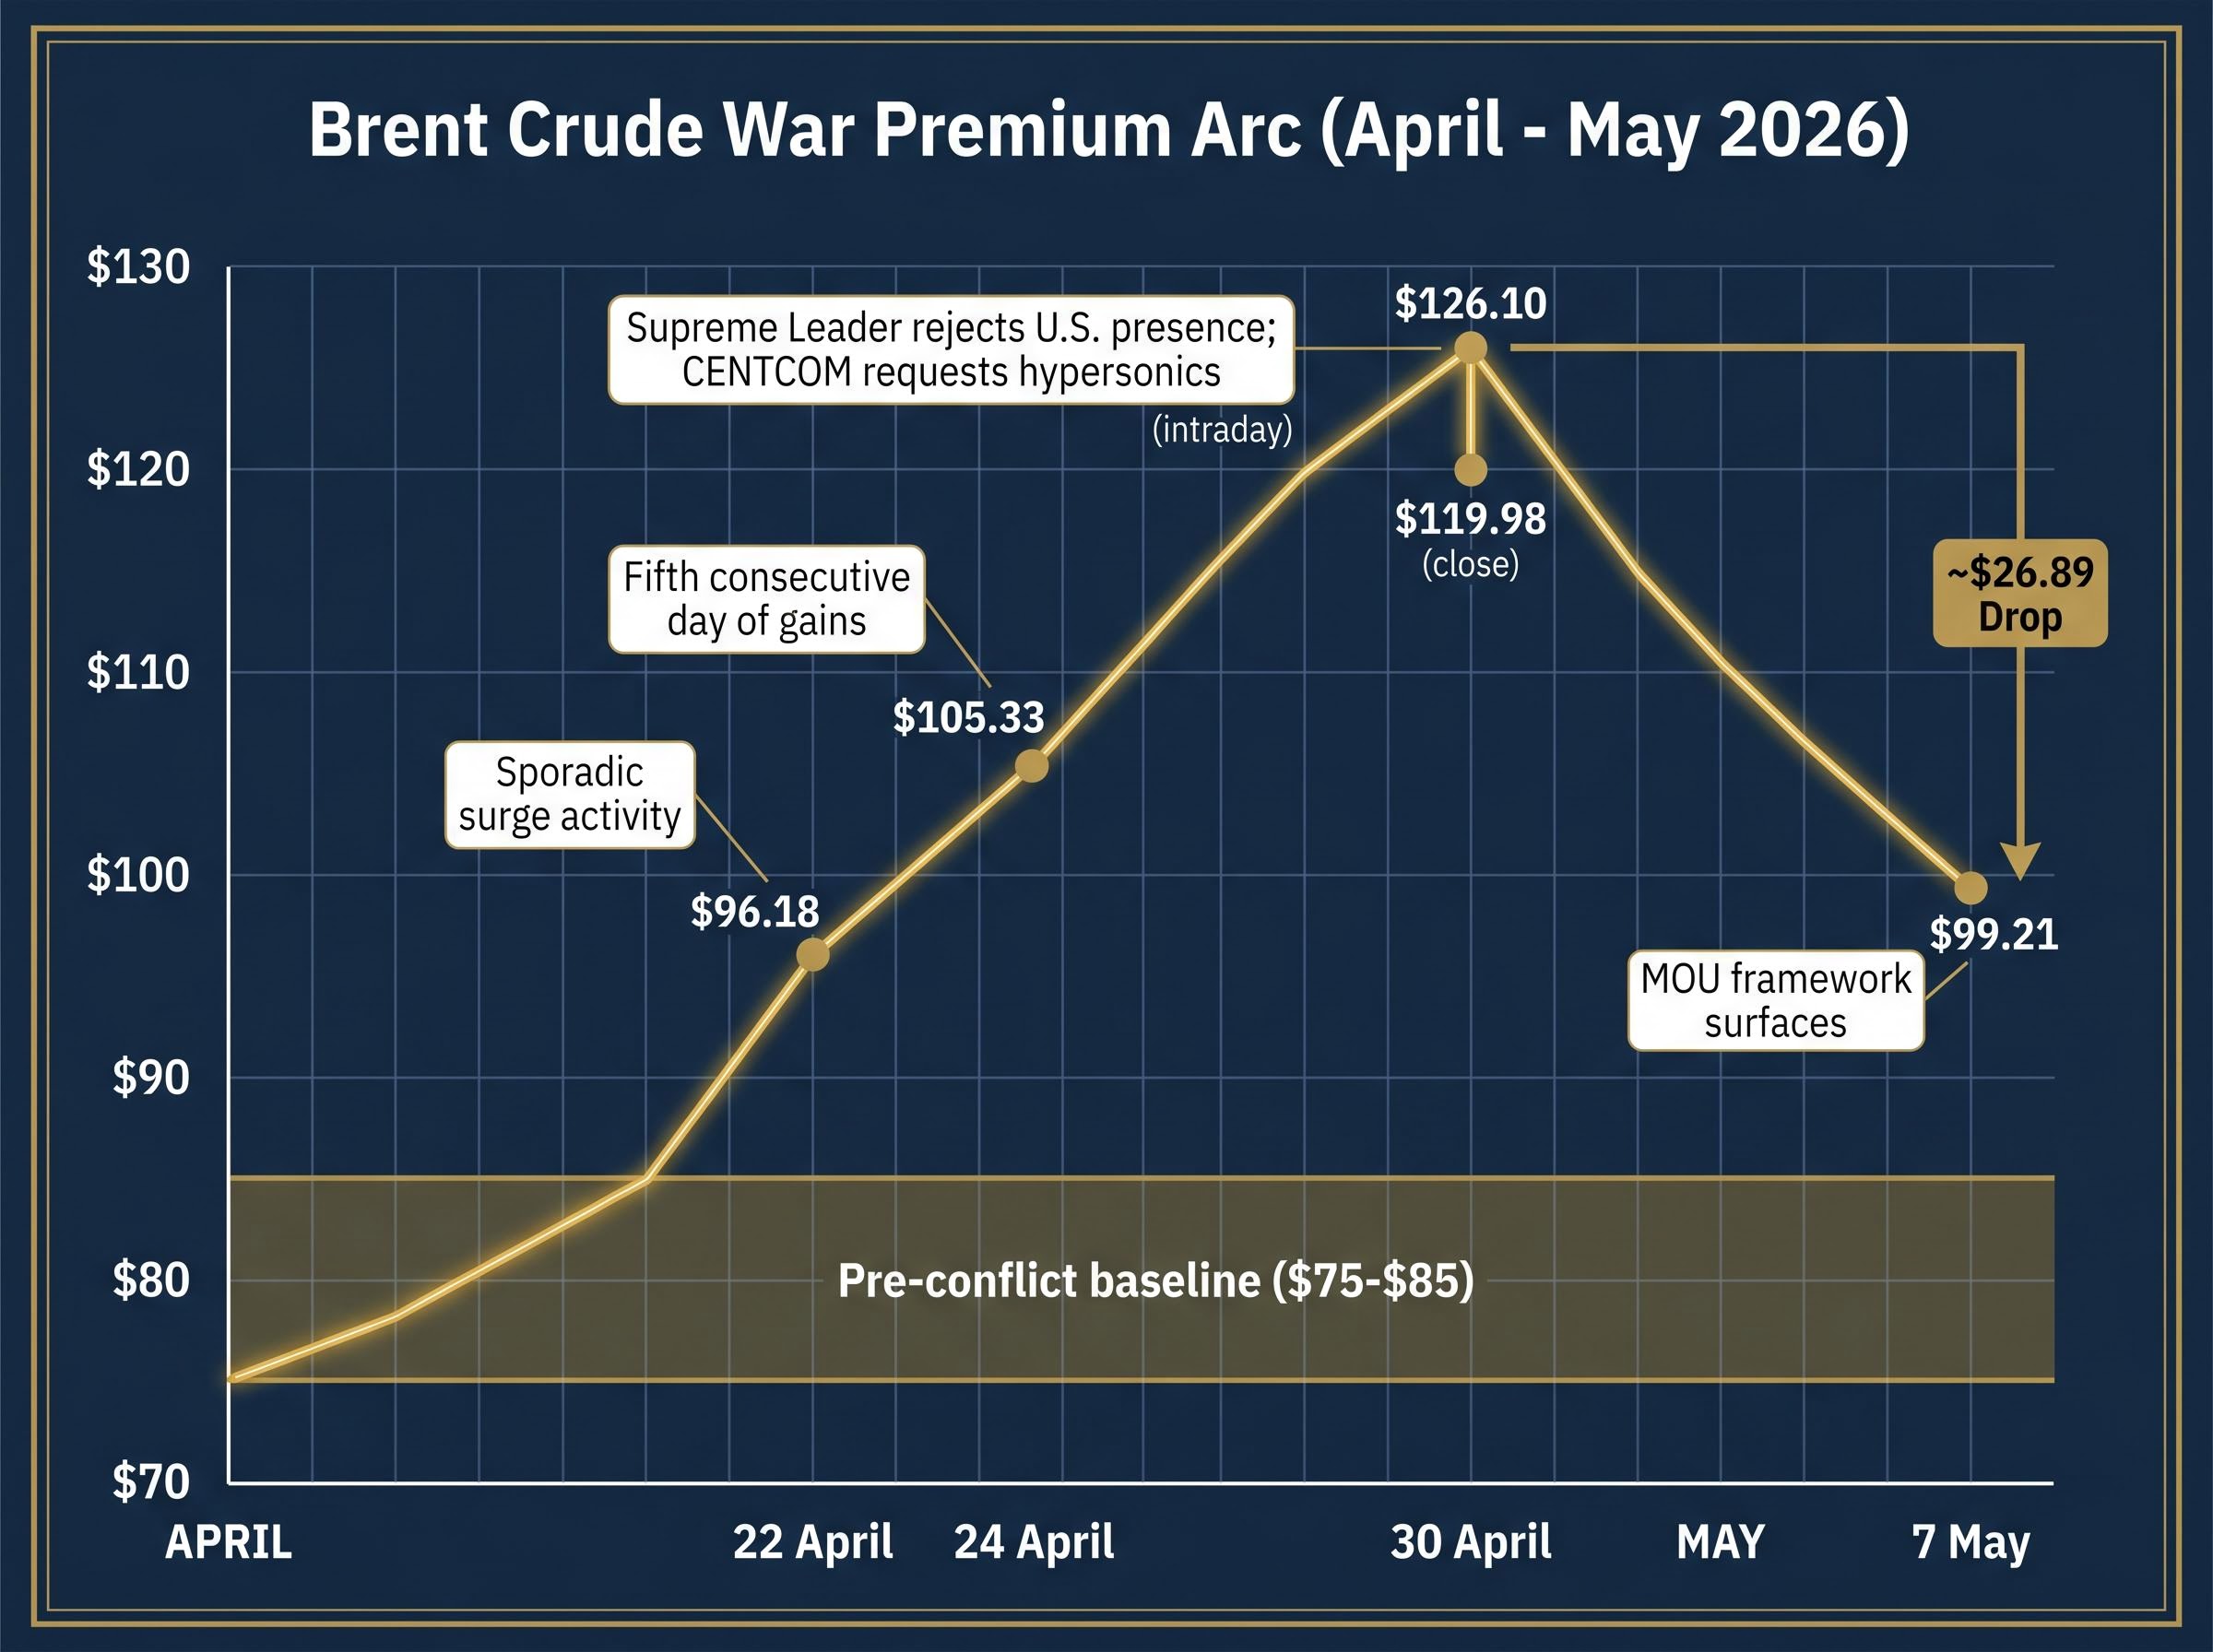
30 April intraday peak: $126.10 per barrel, the highest Brent print since the conflict began, driven by simultaneous diplomatic breakdown and military escalation signals.
The reversal came fast. As the MOU framework surfaced in early May and ceasefire proximity became the dominant headline, Brent fell to approximately $99.21 on 7 May, with WTI dropping to roughly approximately $95, both down approximately 2% intraday. U.S. gasoline, at a national average of $4.536 per gallon on 6 May, had already breached the $4.50 threshold for the first time since 2022.
The Brent crude war premium that accumulated through late April was built on a specific supply arithmetic: the IEA estimated roughly 13 million barrels per day removed from global circulation at the disruption’s peak, a figure with no modern precedent in scale or duration, which explains why the probability repricing from $126 to $99 has been faster than the underlying physical situation would normally justify.
The pullback reflects changed probability, not changed supply. The Strait remains closed. No tankers have resumed normal transit. What shifted is the market’s assessment of how likely a deal is, and that assessment repriced roughly 20-30% of accumulated war premium in a matter of days.
| Date | Brent Price | Diplomatic / Market Context |
|---|---|---|
| 22 April | ~$96.18 | Talk uncertainty; sporadic surge activity |
| 24 April | $105.33 | Fifth consecutive day of gains on stalled negotiations |
| 30 April | $126.10 (intraday high) | Supreme Leader rejects U.S. Gulf presence; CENTCOM requests hypersonics |
| 7 May | ~$99.21 | MOU framework surfaces; deal characterised as “potentially very soon” |
Understanding where prices sit in the arc of the war premium helps distinguish between a genuine supply normalisation and a sentiment-driven dip. The supply picture has not changed. The probability assessment has.
When big ASX news breaks, our subscribers know first
The Strait of Hormuz closure: ten weeks of physical disruption in numbers
The war premium is not abstract sentiment. It is the direct arithmetical consequence of removing a specific volume of oil from global circulation.
Under normal conditions, the Strait of Hormuz carries approximately 20% of global oil trade, equating to roughly 17 million barrels per day. Since late February 2026, that flow has been effectively shut down. The quantified disruption tells the story:
The EIA world oil transit chokepoints analysis confirms that the Strait of Hormuz carried approximately 20.9 million barrels per day in the first half of 2025, accounting for roughly 20% of global petroleum liquids consumption and one quarter of all maritime traded oil, making the current blockade the single largest physical supply disruption in the modern oil market era.
- Blockade duration: approximately 10 weeks as of 7 May 2026
- Vessel transits: only approximately 19 recorded in late April and early May, versus normal high-volume traffic
- Iranian crude exports: effectively suspended for the duration of the conflict
- Regional shipping: broadly disrupted across Gulf states
- UAE OPEC exit: formalised in early May, adding secondary supply-side pressure
No full or partial reopening has occurred as of 7 May. The physical reality of closed shipping lanes, not diplomatic rhetoric, is what sustains elevated prices.
The physical closure is compounded by the near-total withdrawal of commercial maritime insurance coverage from Strait transit routes, a factor that means a ceasefire announcement alone cannot reopen commercial shipping; insurers require a sustained period of incident-free passages before restoring war risk policies, adding weeks or months to the timeline between a signed deal and the first commercial tanker moving normally through the chokepoint.
Reopening the Strait: what the MOU requires and what is still unresolved
Mutual Strait reopening is a stated condition within the proposed MOU framework, but it has not been agreed. No timeline for commercial shipping resumption has been disclosed by either party. The U.S. pause on “Project Freedom” escort operations represents a negotiating gesture, distinct from any actual de-escalation of the blockade posture.
Prices cannot normalise until ships move again, regardless of what negotiators agree on paper.
What the proposed peace framework actually says (and what it does not)
The MOU that Washington expects Tehran to respond to by approximately 8 May contains four core conditions:
- Iran commits to a moratorium on uranium enrichment
- The U.S. releases sanctioned Iranian funds
- Both sides agree to reopen the Strait of Hormuz
- Formal peace talks begin in Pakistan, spanning approximately one month
President Trump has characterised the U.S. position as victorious and communications as constructive. Axios, cited in Bloomberg, described a deal as “potentially very soon.” The framing from Tehran has been more measured. An unnamed Iranian official described the proposal as reflecting American wishes rather than a mutual framework. Iran’s foreign minister indicated Tehran was assessing the proposal and would communicate through Pakistan.
Downside risk anchor: Trump warned that military operations could resume if no deal is concluded, a statement that defines the floor for how far the war premium can fall before confirmation.
The outstanding disagreements are not minor. Enrichment activity levels and inspection protocols remain unresolved, and these were the issues that stalled April’s talks for weeks. Markets are pricing a deal as probable, not certain. Knowing exactly which conditions remain open allows investors to assess whether a breakdown is a tail risk or a base-case possibility, which directly informs position sizing in energy and equity exposures.
How oil markets have historically repriced after conflict resolution
Confirmed conflict resolutions have typically produced a 10-30% price decline within one to four weeks. The speed depends on whether physical infrastructure was damaged and how long supply chains were dislocated.
The 2022 Russia-Ukraine war is the closest structural analog for a sustained energy supply shock. Brent normalised approximately 20-30% below wartime peaks within months, but a lingering premium persisted for more than 12 months as supply-side stress continued. The 2019 U.S.-Iran Hormuz tension, by contrast, saw a 10-20% spike resolve within days to weeks once de-escalation was confirmed and no sustained infrastructure damage was identified.
At the extremes, the 1990-91 Gulf War saw oil fall approximately 50% post-ceasefire within months, while the 1979 Iranian Revolution produced a 100%+ spike that took one to two years to fully normalise.
Dallas Fed research on geopolitical oil price risk documents how the 1979 Iranian Revolution and the 1990 Kuwait invasion each produced sustained periods of elevated price uncertainty that persisted well beyond the initial supply shock, a pattern consistent with the current 10-week blockade and the lingering premium risk investors face even after a deal is signed.
| Conflict / Event | Approximate Price Spike | Normalisation Timeframe | Structural Similarity to Current Scenario |
|---|---|---|---|
| 2022 Russia-Ukraine War | Sustained wartime highs | 20-30% decline within months; elevated 12+ months | High: sustained supply-side shock, prolonged disruption |
| 2019 U.S.-Iran Tensions | 10-20% | Days to weeks on de-escalation | Moderate: Strait-specific, but no sustained blockade |
| Gulf War (1990-91) | ~100% | ~50% decline within months post-ceasefire | Moderate: military conflict, but different supply geography |
| 1979 Iranian Revolution | 100%+ | 1-2 years | Low-moderate: structural regime change, not military blockade |
The current scenario, with no reported infrastructure destruction but a sustained 10-week physical blockade, sits between the rapid 2019 normalisation and the prolonged 2022 pattern. Historical range-banding gives investors a realistic expectation set, preventing both premature short positions and excessive complacency about how long elevated prices can persist after a deal.
Scenario map: what oil prices could do from here
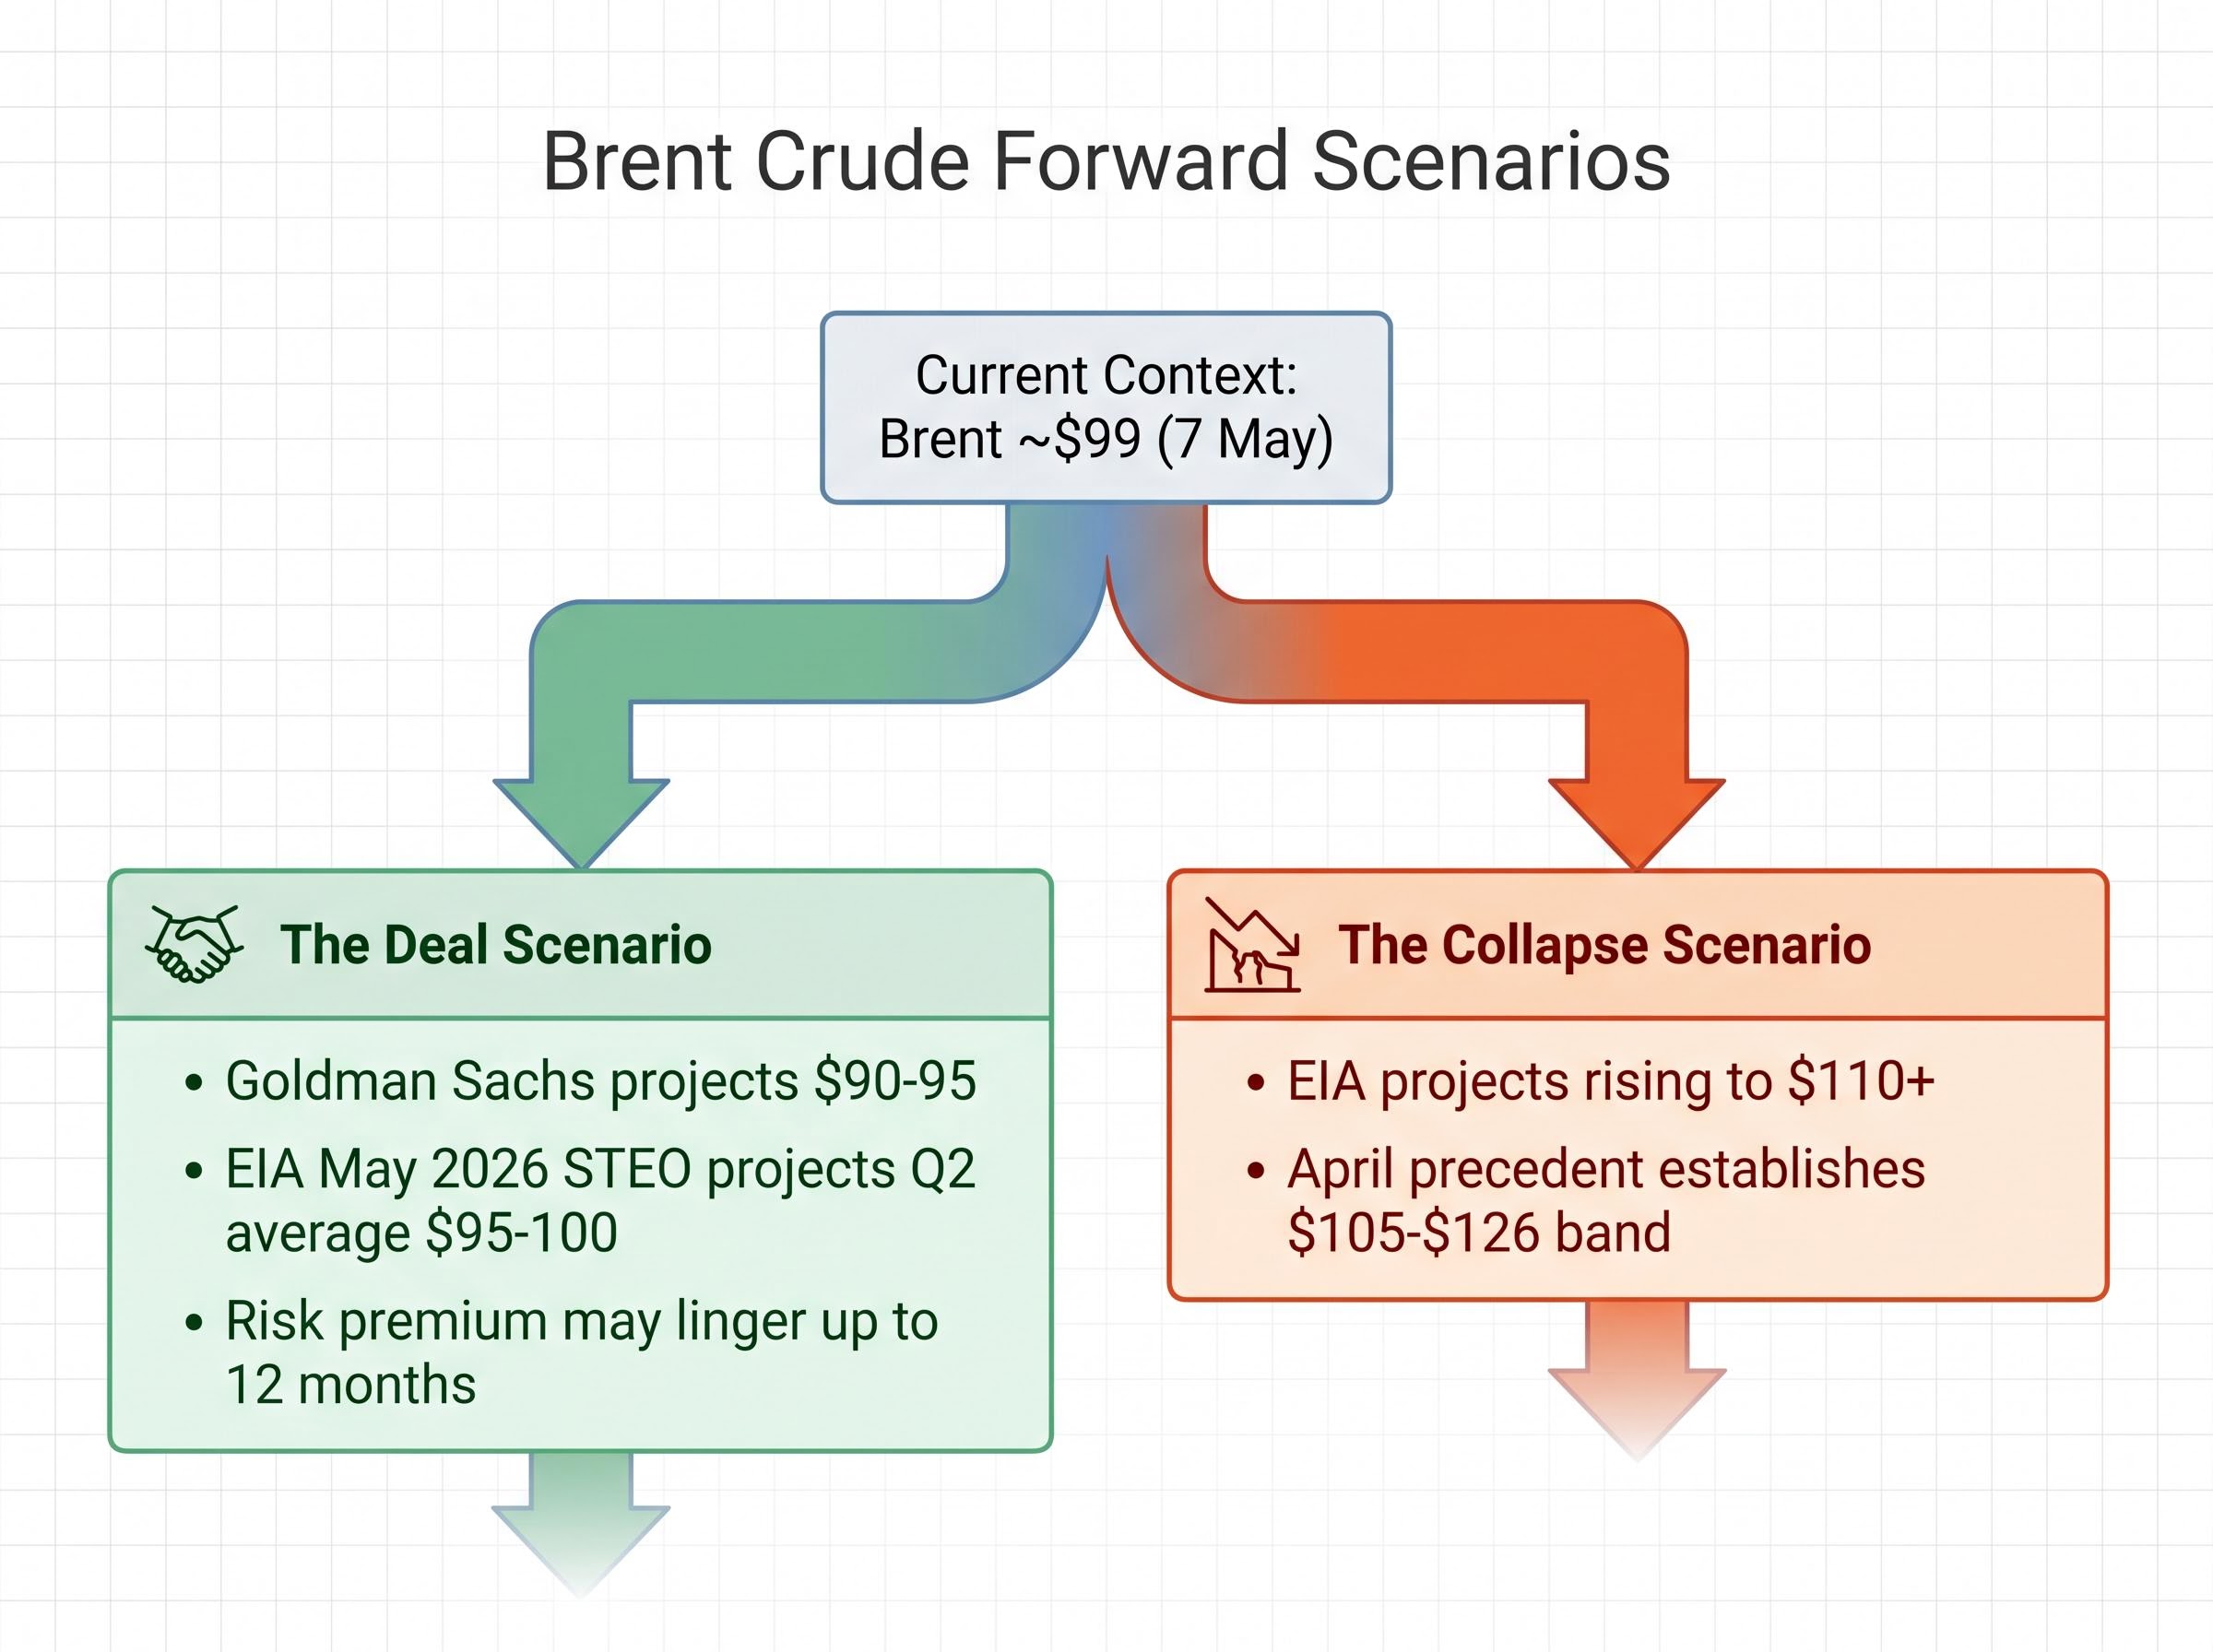
The deal scenario
If Iran’s formal response is positive and talks proceed, Goldman Sachs projects Brent reaching $90-95 as the war premium unwinds. The EIA’s May 2026 Short-Term Energy Outlook projects a Q2 average of $95-100 if a deal holds. The 20-30% war premium above the pre-conflict baseline would begin dissipating, though historical supply-stress models suggest it may linger for up to 12 months as shipping confidence and supply chains rebuild.
The collapse scenario
If talks stall or Iran rejects the MOU, the EIA projects Brent rising to $110+, with the April precedent of $105-$126 establishing the relevant price band. Resumed U.S. military operations or further Hormuz tightening would push prices toward the upper end of that range.
Keith Lerner of Truist highlighted peace talk hopes on 6 May as a key driver of equity rallies, noting reduced escalation risk as markets priced in deal progress.
Three specific signals will determine which path materialises:
- Iran’s formal MOU response, expected around 8 May
- The first confirmed commercial vessel transit through the Strait post-deal
- Any resumption of U.S. military operations or CENTCOM posture changes
The next major ASX story will hit our subscribers first
The war premium explained: why oil prices embed geopolitical risk before outcomes are known
The war premium is the price increment energy traders add to reflect the probability-weighted cost of a supply disruption. It is distinct from actual supply loss. Traders do not wait for barrels to physically disappear before adjusting prices; they price the probability that barrels will disappear, and adjust that probability in real time as geopolitical signals shift.
Forward curve pricing in oil futures markets translates these probability assessments into spot price movements. When the likelihood of sustained Hormuz closure rose through April, traders bid Brent from $96 toward $126. When ceasefire signals emerged in May, the probability weight on prolonged disruption fell, and Brent dropped toward $99, even though the Strait remained physically closed.
The estimated pre-conflict baseline, implied by the 20-30% war premium, sits in the $75-$85 range. The current price of approximately $99 reflects a partial probability repricing, not a supply recovery. At the consumer level, gasoline at $4.536 per gallon on 6 May is the most visible expression of this premium.
Why the premium does not vanish the moment a deal is signed
Even after a confirmed deal, four factors govern how quickly the war premium dissipates:
- Physical infrastructure damage status: whether loading terminals, pipelines, or port facilities sustained damage during the conflict
- Disruption duration: a 10-week blockade has created deeper supply chain dislocation than a brief spike
- Post-deal sanctions posture: whether restrictions on Iranian crude exports remain in place after a ceasefire
- Supply chain confidence rebuild timeline: how quickly shipping operators, insurers, and cargo owners re-engage with Strait transit routes
The 12-month lingering premium pattern observed after analogous energy shocks, particularly the 2022 Russia-Ukraine disruption, suggests that even a clean deal would leave some risk premium embedded in prices well into 2027.
Understanding this mechanism prevents investors from misreading the current pullback as a supply recovery signal. It is a probability-repricing signal. The distinction matters for timing any energy position adjustment.
The market is betting on peace, but the Strait is still closed
Markets have already placed a substantial bet on resolution. The S&P 500 closed at approximately 7,365 on 6 May, up 1.46%, with the Nasdaq near 25,839, both at record highs reflecting deal optimism already priced into equities. Brent’s fall from $126 to $99 represents the energy market’s version of the same bet.
The gap between that bet and physical reality is where the near-term risk sits. No tanker has resumed normal Strait transit. No commercial shipping resumption has been confirmed. The MOU remains unsigned.
Historically, gasoline above $4.00 per gallon has preceded an average 11% S&P 500 decline in the six months following each of the 44 weeks since 1993 when that threshold was breached, a pattern that sits unresolved beneath the current record equity highs and creates a secondary risk dimension for investors who are repositioning on ceasefire optimism without accounting for the consumer-spending transmission channel.
If Iran’s response is negative or talks stall, as they did throughout April when the Supreme Leader rejected U.S. Gulf presence on 30 April, the reversion toward $110-$126 would likely be faster than the current decline. Supply chains have had no time to normalise, meaning the upside repricing requires only a shift in probability, while the downside repricing required an actual change in diplomatic trajectory.
Three watch-points define the next 48-72 hours:
- Iran’s formal MOU response, expected around 8 May
- Any confirmed Strait transit activity indicating partial reopening
- U.S. military posture signals from CENTCOM, particularly any reversal of the “Project Freedom” pause
The next week represents the highest-information period for repositioning decisions in energy and energy-adjacent equities. Investors who understand the gap between sentiment pricing and physical reality are better positioned to interpret incoming news without being whipsawed by each diplomatic signal.
This article is for informational purposes only and should not be considered financial advice. Investors should conduct their own research and consult with financial professionals before making investment decisions. Past performance does not guarantee future results. Financial projections are subject to market conditions and various risk factors.
—