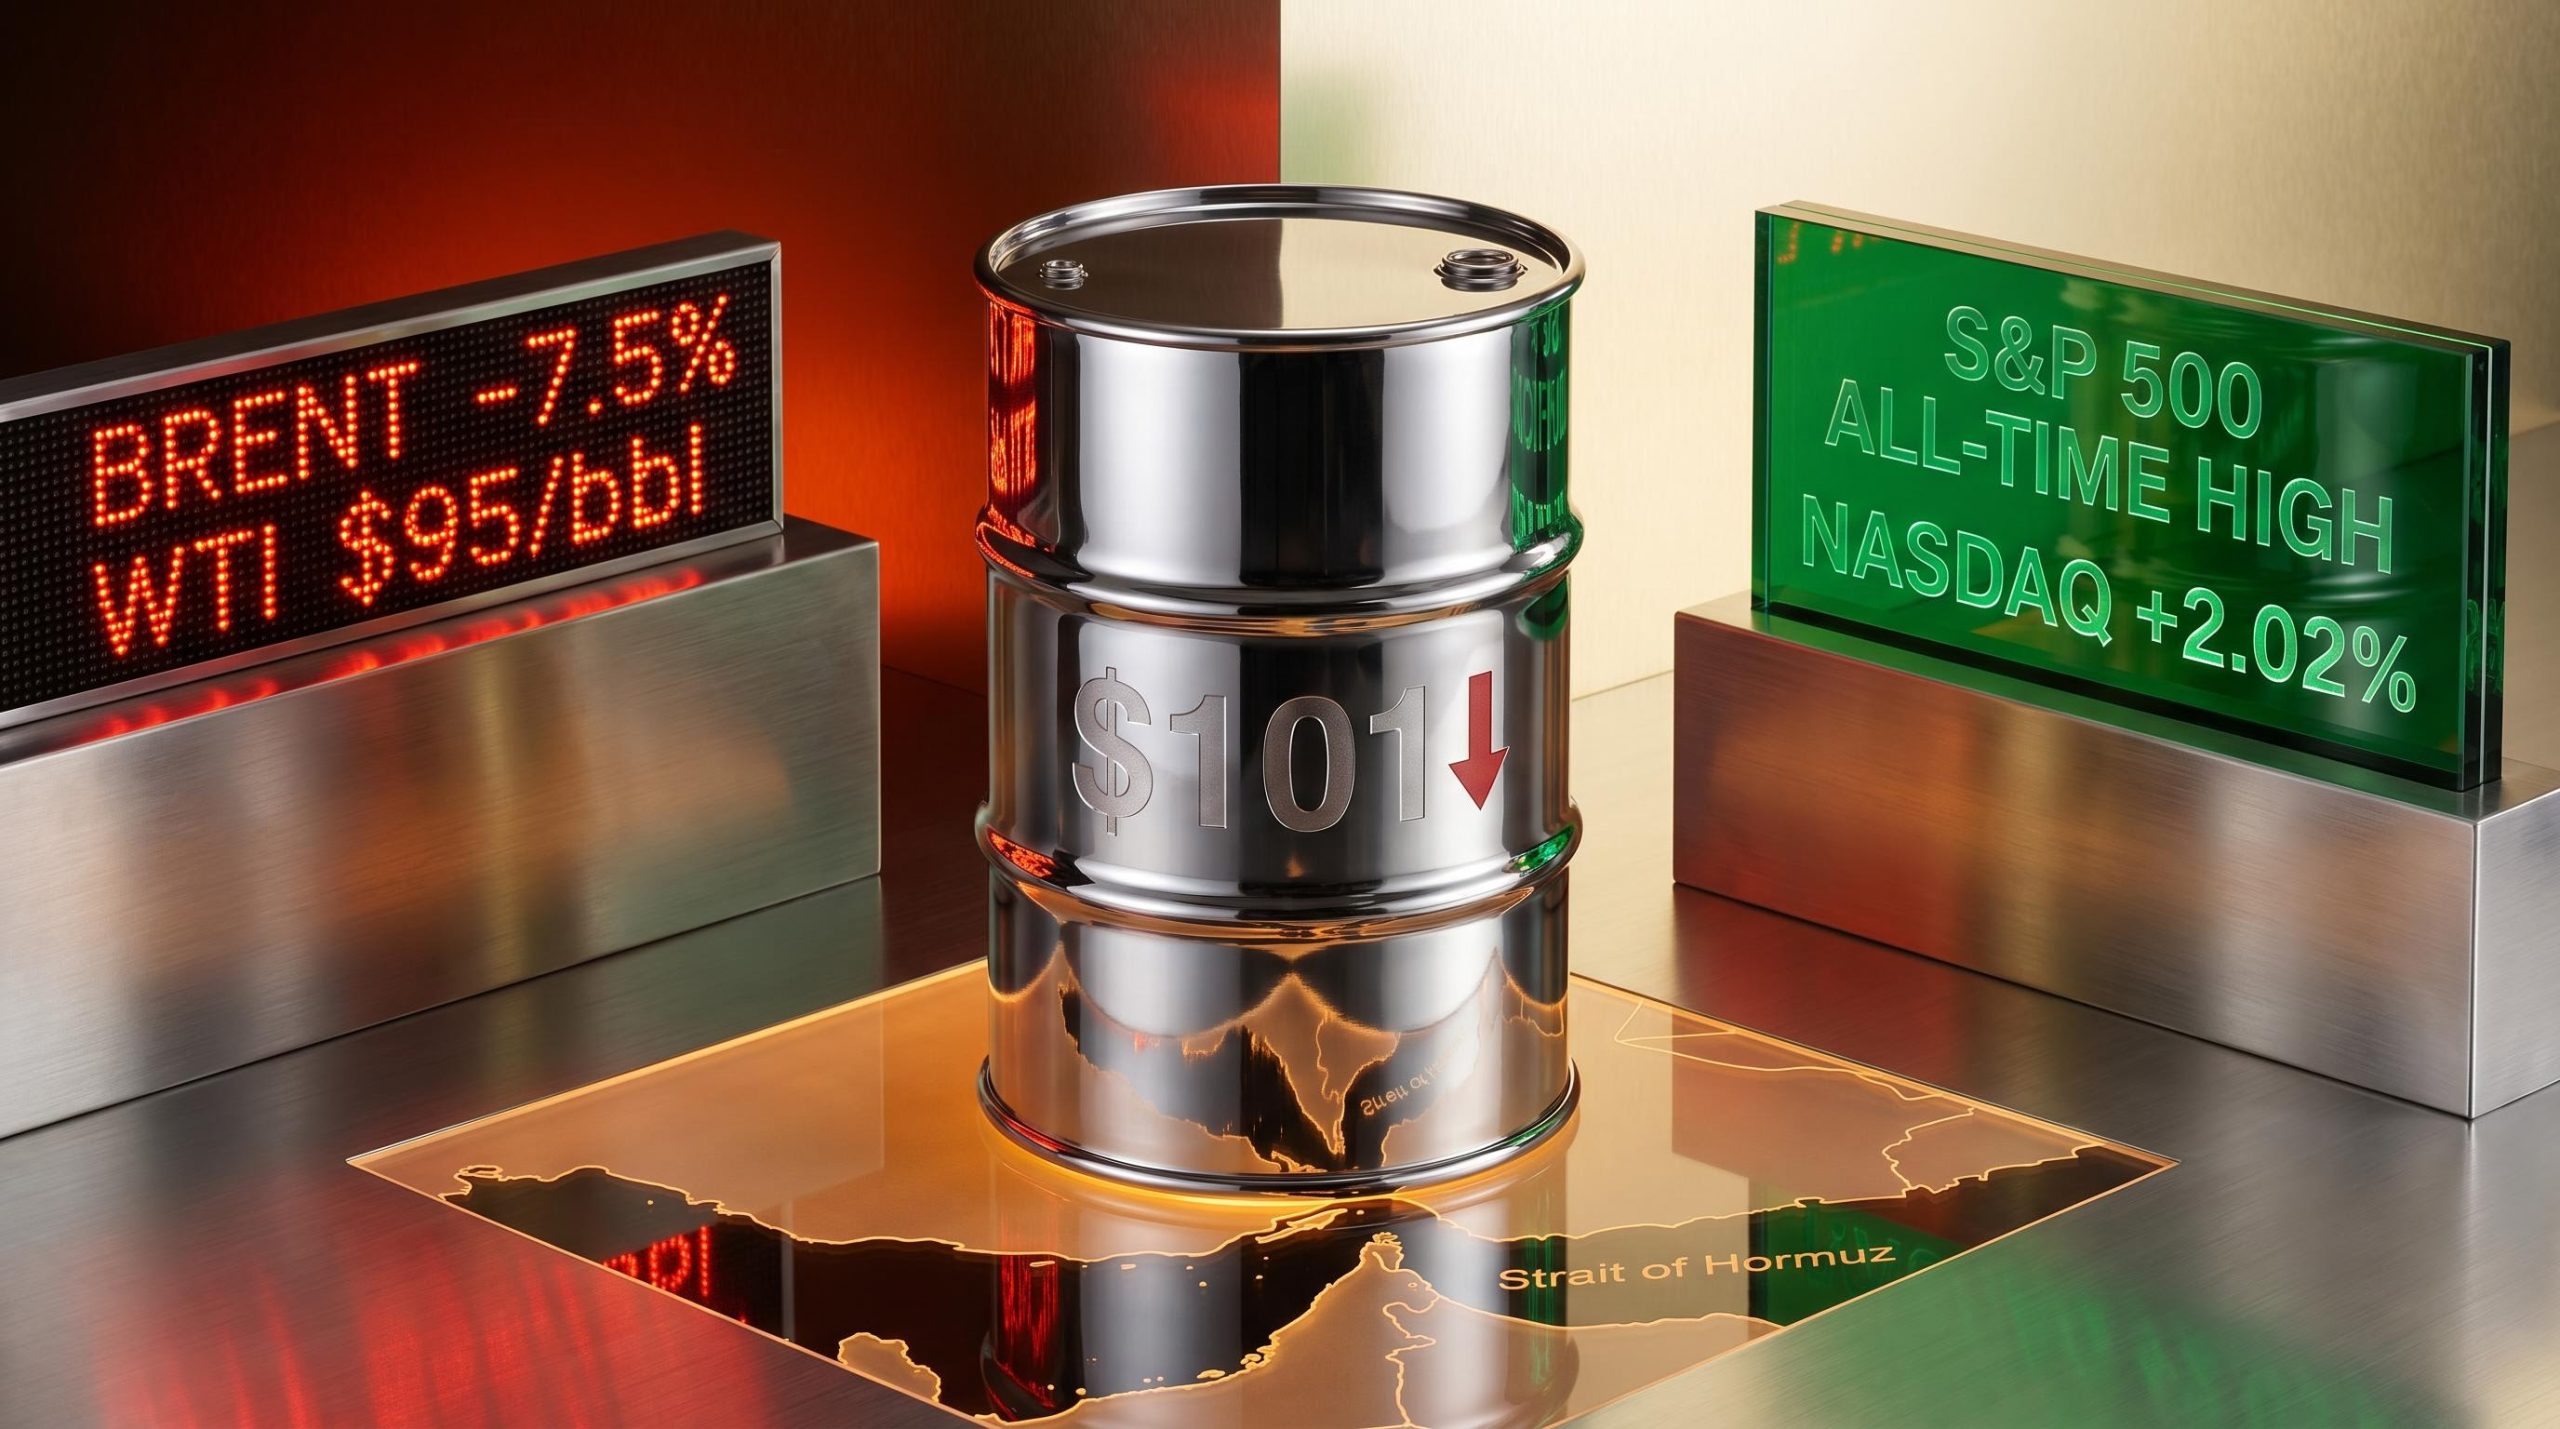
Overnight on 6 May 2026, Brent crude collapsed through $101 per barrel while the S&P 500 closed at a fresh all-time high. The same headline drove both moves. Reports from Axios that the US and Iran are approaching a peace framework triggered one of the sharpest crude oil selloffs since the Hormuz crisis began, simultaneously unwinding the geopolitical risk premium that had been propping up energy prices and unleashing a broad risk-on surge in equities. The divergence is not a contradiction; it is geopolitical de-escalation mechanics playing out across asset classes in real time. What follows covers the overnight session’s oil price move, why crude and stocks moved in opposite directions on the same news, what the diplomatic status actually confirms (and what it does not), and what traders should watch in the hours ahead.
Oil’s overnight collapse: what a $101 Brent price actually means
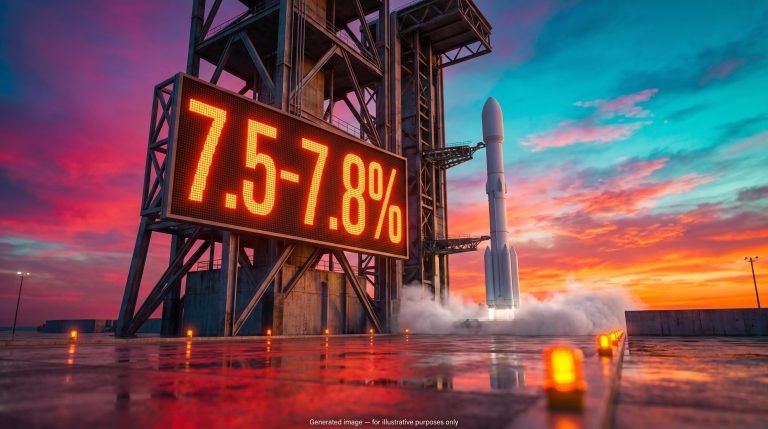
Brent crude fell approximately 7.5% in the overnight session of 6 May 2026, trading at roughly $101 per barrel. WTI crude dropped in parallel, falling approximately 7% to around $95 per barrel. The move ranks as the second-largest single-session decline in the energy complex since the Iran conflict began.
- Brent crude: approximately $101/bbl, down roughly 7.5%
- WTI crude: approximately $95/bbl, down roughly 7%
The speed of the reversal sharpened its impact. WTI’s front-month contract had surged +3.12% on 4 May as escalation tensions spiked. Two sessions later, that entire gain and considerably more had been erased.
“Ceasefire in the Middle East appears to be holding, easing geopolitical risks.” (Barchart, approximately 6 May 2026)
What the selloff represents is a partial unwind of the geopolitical risk premium that has been embedded in crude since the US-Iran Hormuz exchange disrupted supply perceptions through the Strait. Partial is the operative word. Prediction market data retains $112.15 as a support reference and $131.75 as an upside target, indicating that sophisticated participants are not treating de-escalation as permanent. Oil at $101 is cheaper than yesterday; it is not cheap in the context of what a full diplomatic resolution would imply.
The selloff has to be measured against its starting point: the Hormuz closure spike that carried Brent above $125 on 30 April 2026 represented a supply disruption with no modern parallel in scale, removing approximately 13 million barrels per day from global circulation and embedding a premium into crude that the overnight diplomatic news has only partially unwound.
When big ASX news breaks, our subscribers know first
What the US-Iran diplomatic framework actually says (and what it does not)
What has been confirmed
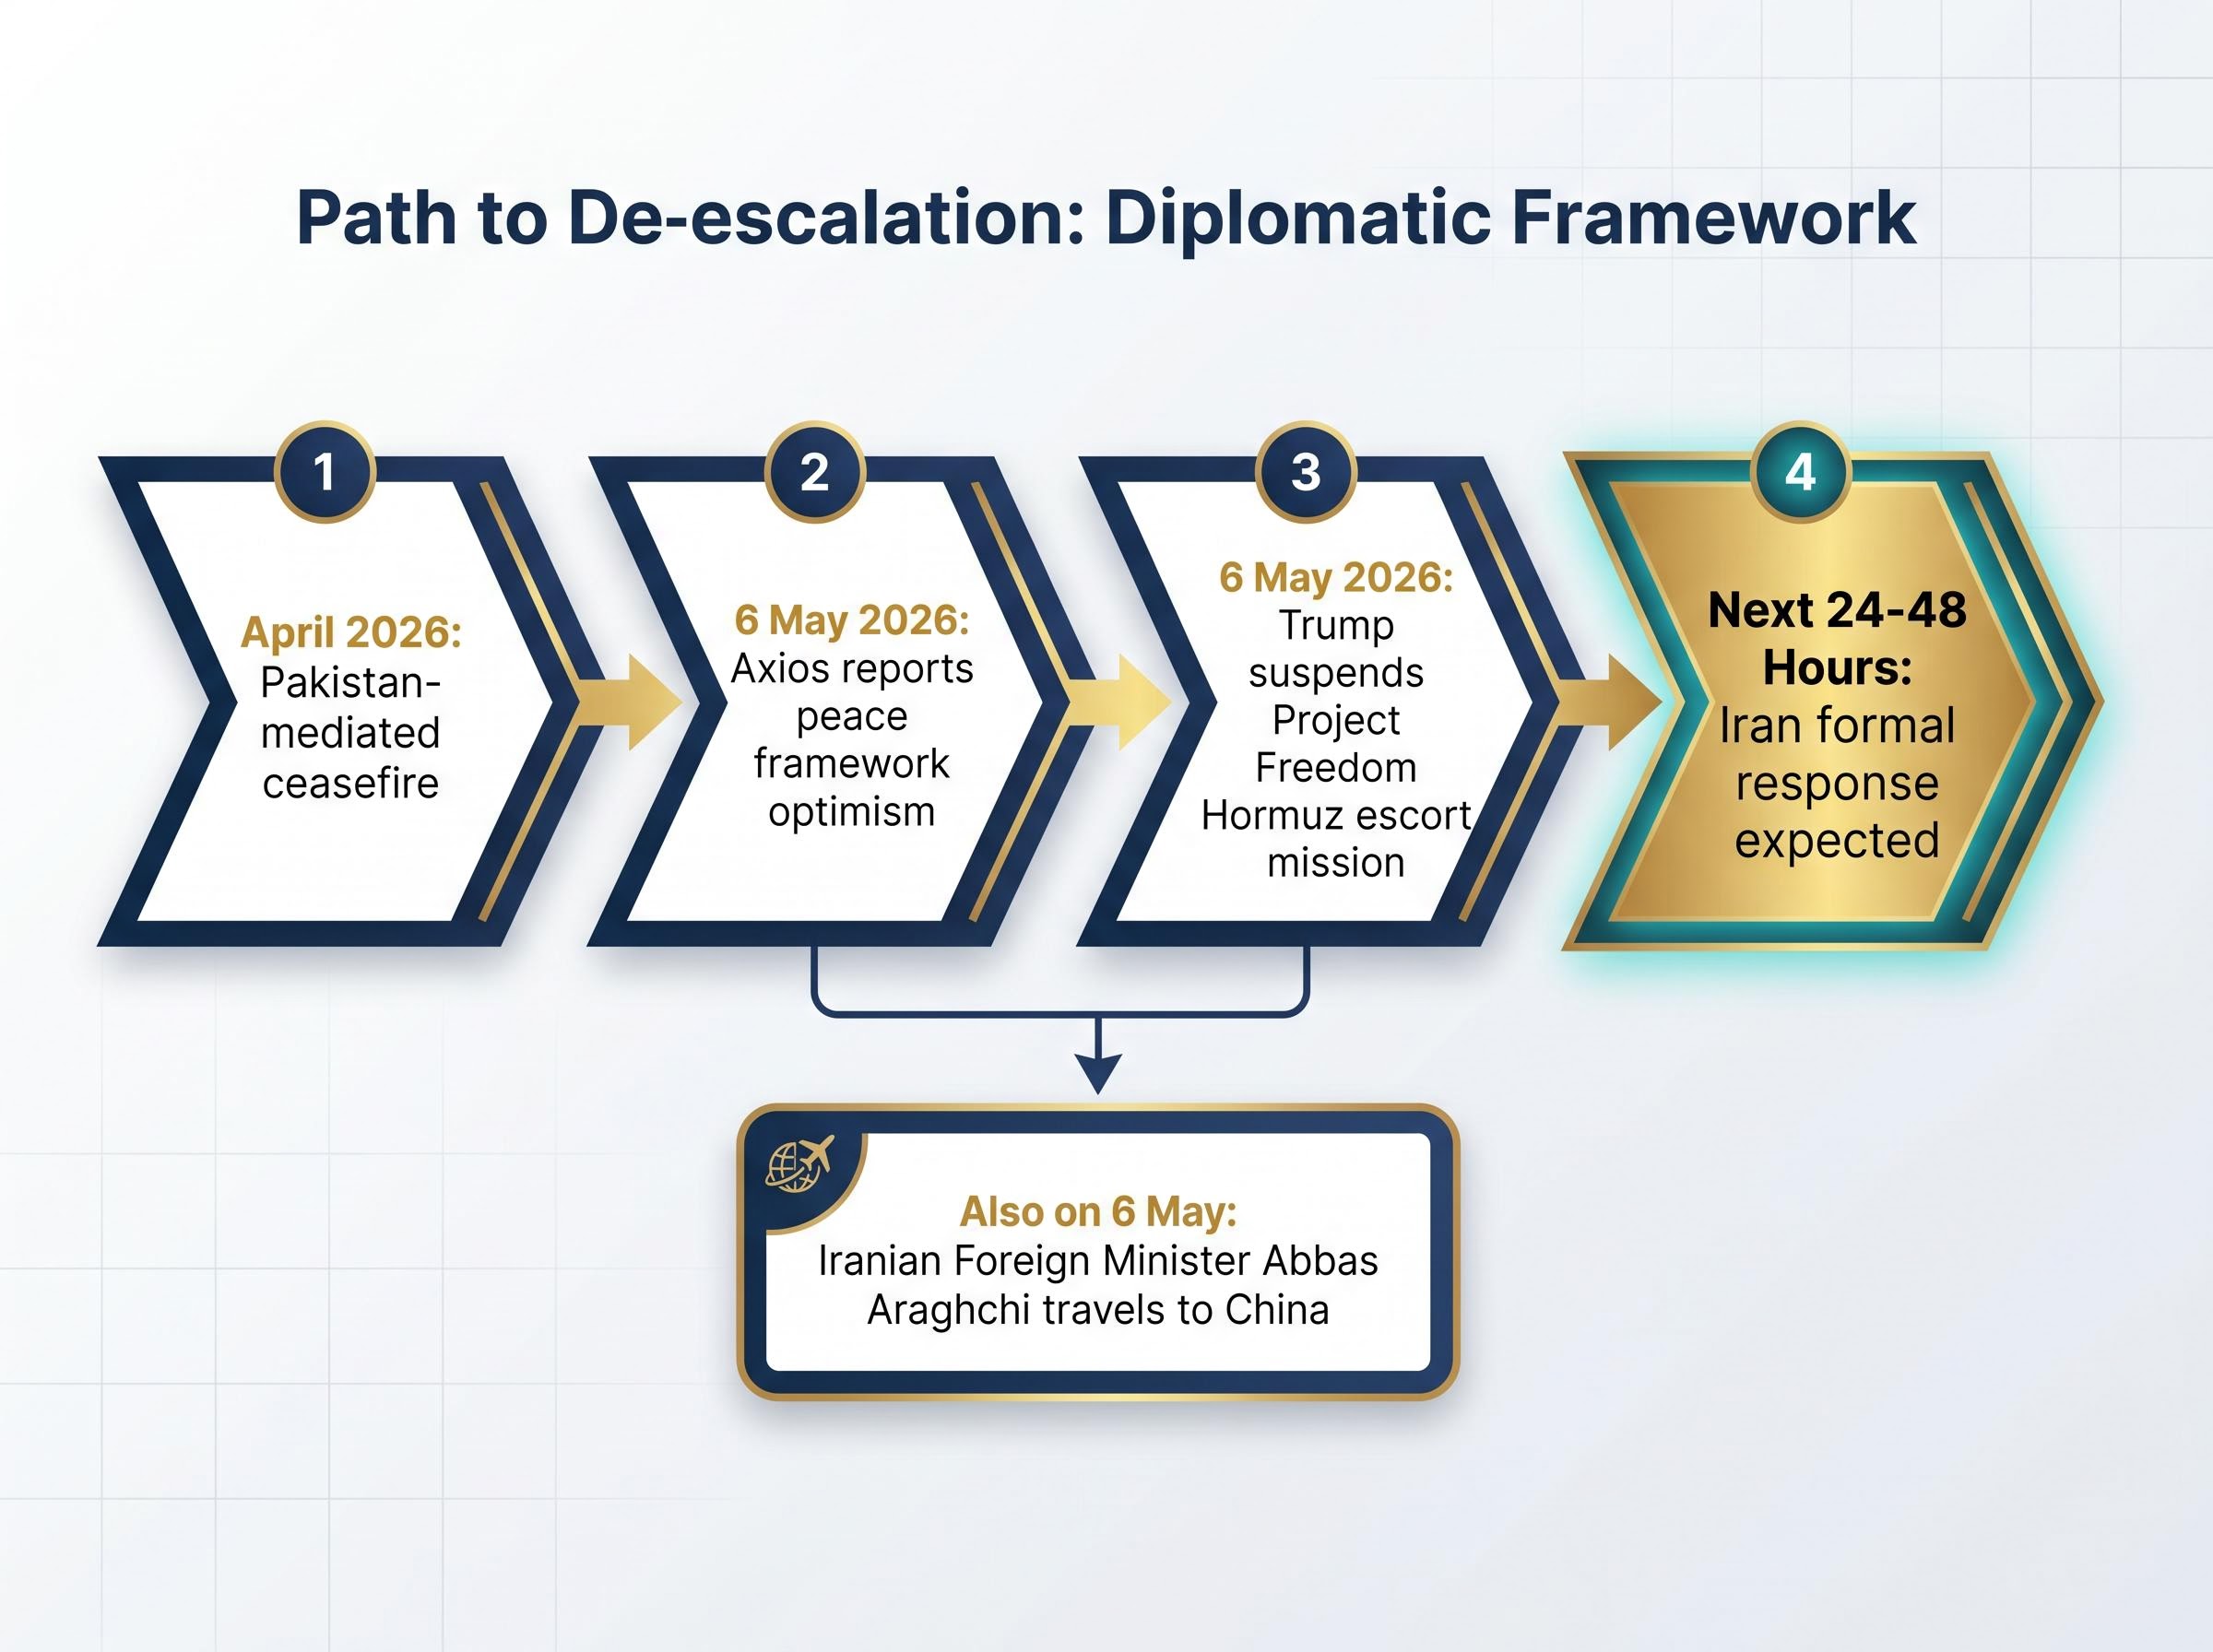
Axios reported on 6 May 2026 that Trump expressed optimism about Iran’s response to a peace framework. US officials stated they expected Iran’s formal response within 24-48 hours. Trump suspended military operations, specifically the “Project Freedom” Hormuz escort mission, to provide room for diplomatic progress.
Iranian Foreign Minister Abbas Araghchi reinforced the momentum. He stated that talks are “making progress” and that there is “no military solution” to the Hormuz crisis. On the same day, Araghchi was travelling to China, suggesting the diplomatic engagement extends beyond a bilateral US-Iran channel.
The preceding context matters too. A Pakistan-mediated ceasefire reached in April 2026 created the precondition for this framework discussion to advance.
What remains unresolved
No agreement has been signed. Iran’s formal response is pending. Trump explicitly retained military optionality, stating that a return to military action remained possible if no agreement was reached. Araghchi’s China visit introduces a multilateral dimension that complicates the bilateral framing markets have priced in.
The distinction between “progress toward a framework” and “a concluded agreement” is the gap traders are now pricing around.
How geopolitical risk premiums work across oil and equities
A geopolitical risk premium is the portion of an asset’s price that reflects uncertainty about supply disruption or conflict escalation, not underlying supply-and-demand fundamentals. When a conflict threatens a supply chokepoint, that premium inflates the price of the commodity at risk. Simultaneously, risk-off sentiment depresses equity prices as investors rotate toward safe-haven assets.
The Strait of Hormuz is the single most price-sensitive chokepoint in energy markets. Approximately 20% of globally traded oil transits the strait. The US-Iran military exchange threatened that route directly, and the resulting premium embedded itself across both asset classes: upward in oil, downward in equities.
EIA Strait of Hormuz chokepoint data confirms that the strait accounts for approximately 20% of global petroleum liquids consumption and one quarter of total global maritime traded oil, figures that explain why a military threat to the route embeds a premium across the entire energy complex rather than just regional benchmarks.
De-escalation reverses both simultaneously. Oil sheds the supply-disruption fear. Equities shed the risk-off discount. The same catalyst produces opposite directional moves because the premium operates in opposite directions across the two asset classes.
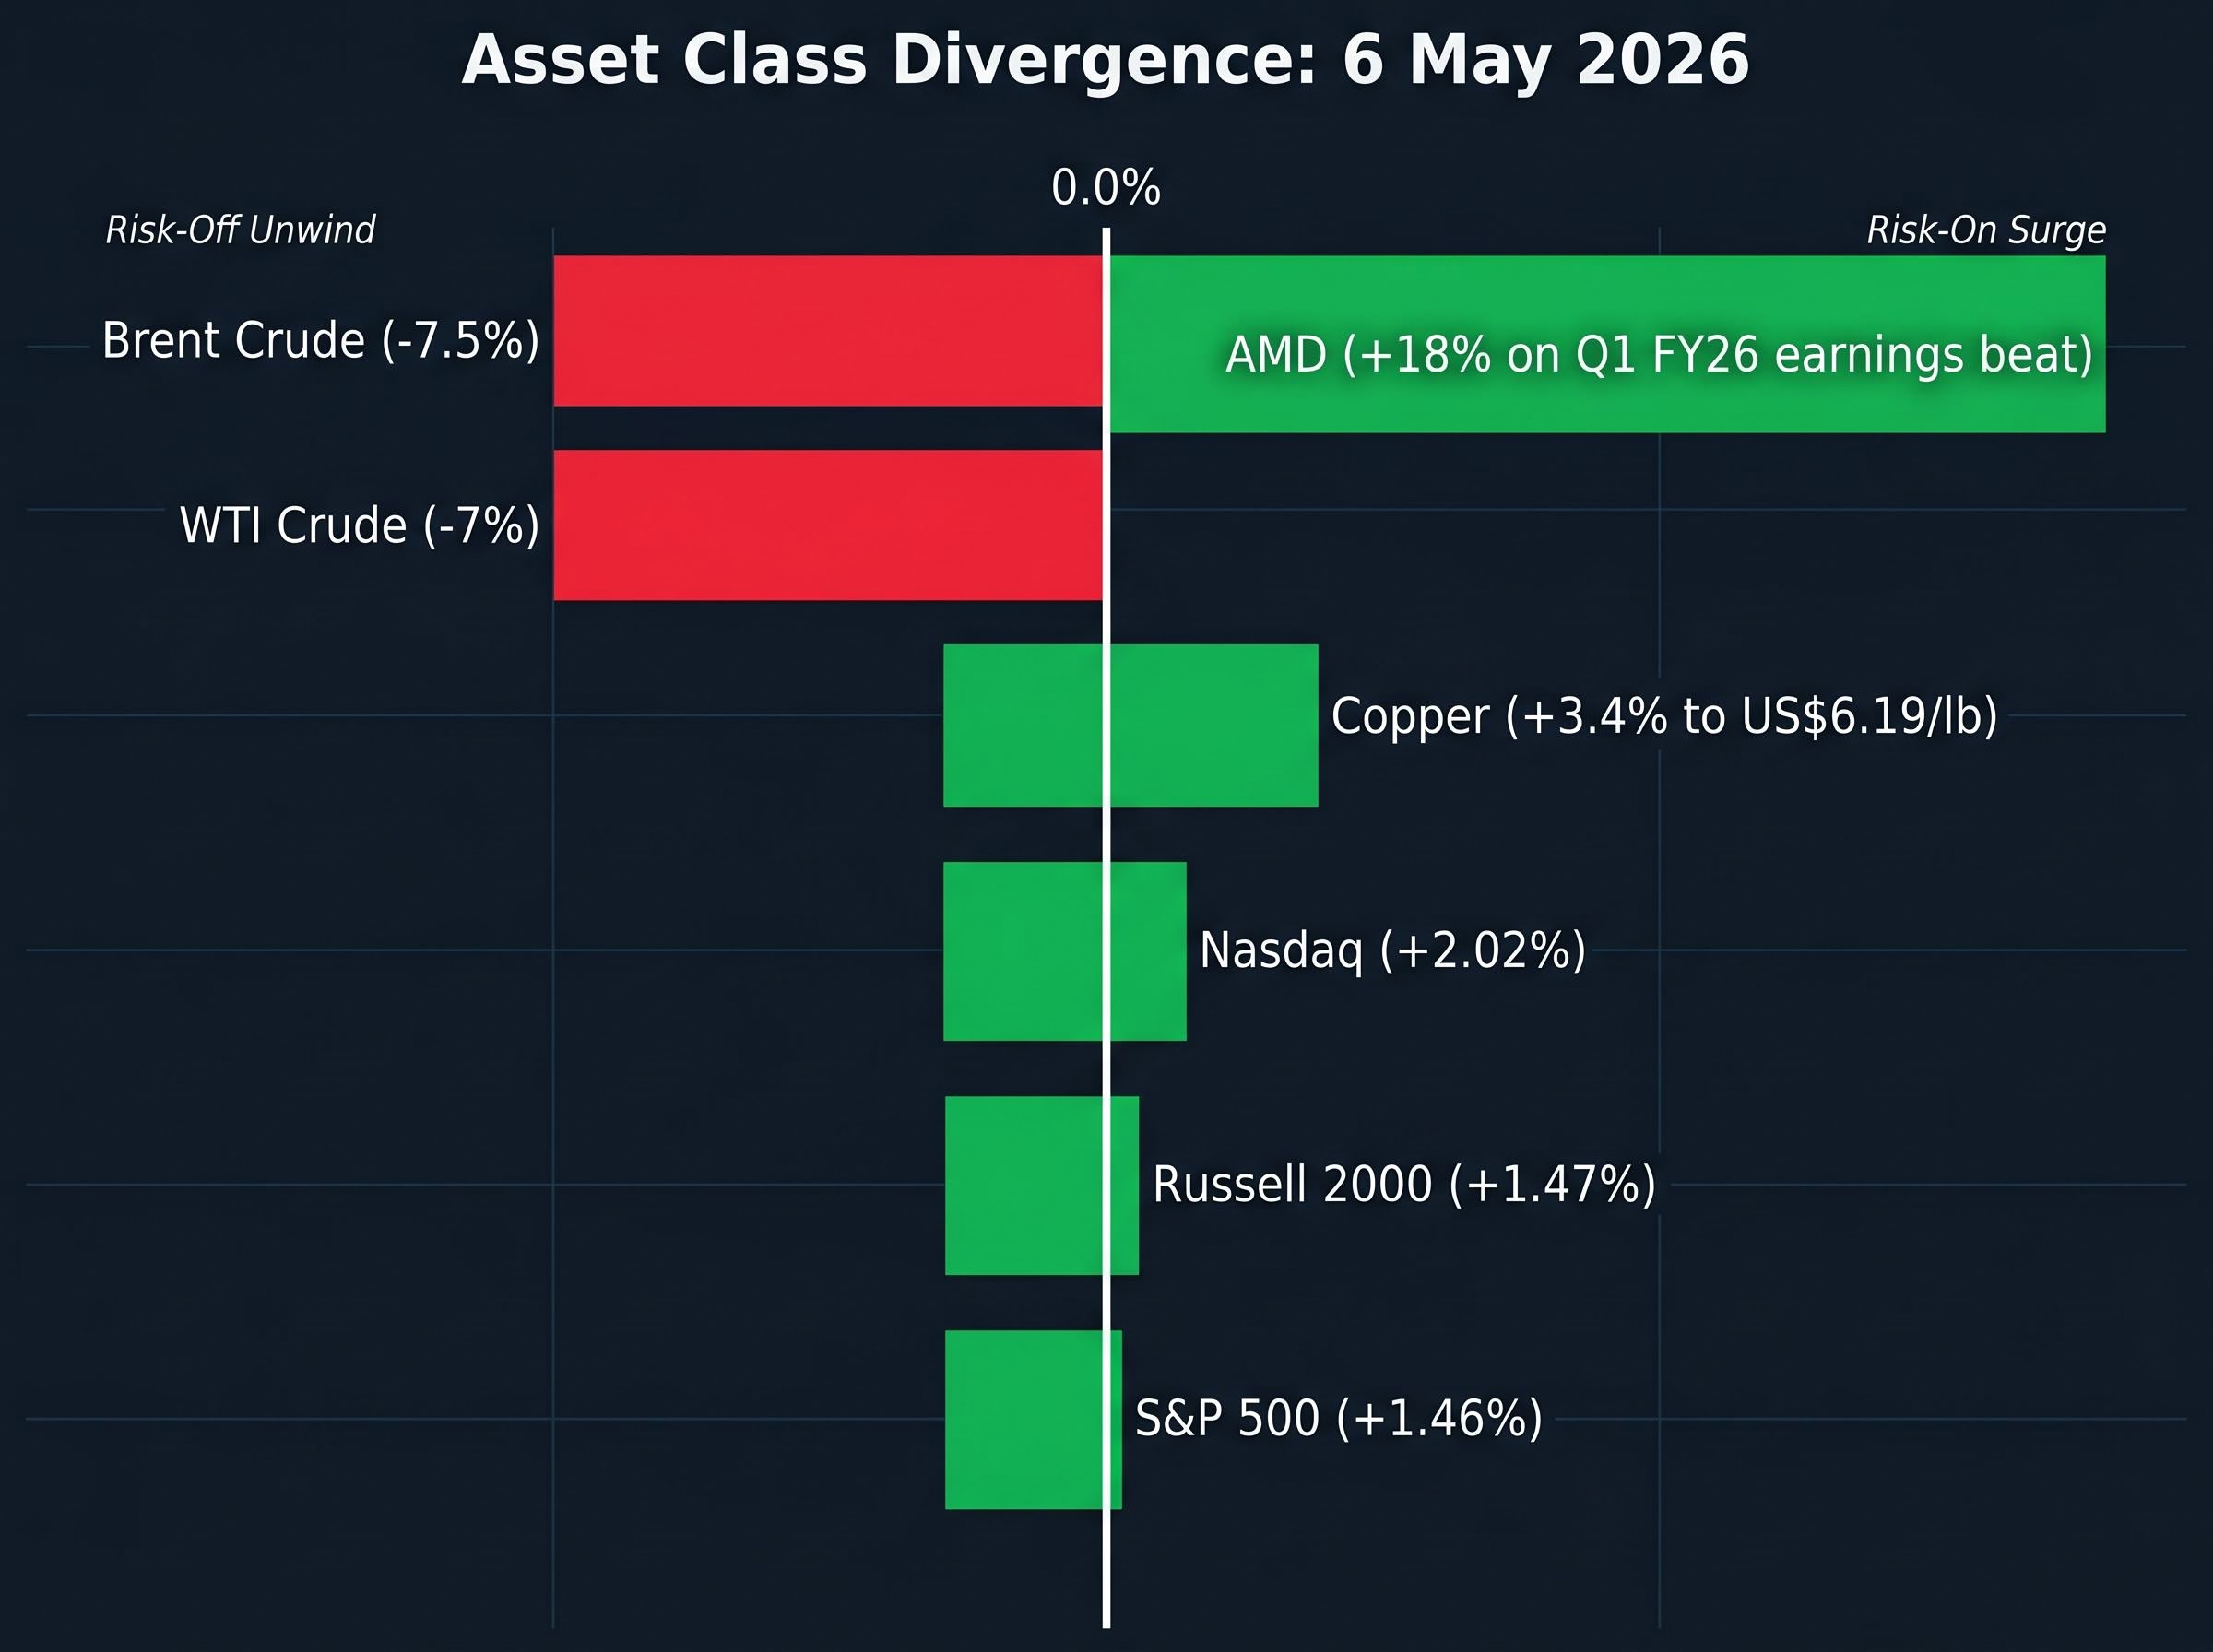
| Asset | Direction | Approximate move | Mechanism |
|---|---|---|---|
| Brent crude | Down | -7.5% | Risk premium unwind on supply-disruption fear |
| WTI crude | Down | -7% | Risk premium unwind on supply-disruption fear |
| S&P 500 | Up | +1.46% | Risk-off sentiment reversal |
| Nasdaq | Up | +2.02% | Risk-off reversal plus AI sector tailwind |
| Russell 2000 | Up | +1.47% | Broad risk-on |
All three US equity benchmarks closed at fresh all-time highs. AMD’s 18% surge on a Q1 FY26 earnings beat provided an additional AI-sector tailwind to the Nasdaq, reinforcing the broader risk-on momentum.
The broader pattern reinforces what the overnight session illustrated: equity markets price forward earnings rather than current headlines, and Goldman Sachs projections of 11% total equity returns into 2027 were built on profit-growth assumptions that treat the Iran conflict as a secondary variable rather than a primary risk to the earnings cycle.
Energy sector and broader commodities: winners and losers in the same session
The de-escalation signal did not uniformly depress commodities. It reshuffled them.
Crude oil’s decline reflected a supply-risk premium unwind. Copper moved in the opposite direction, surging +3.4% to US$6.19 per pound and approaching all-time highs. Copper trades on demand-growth expectations rather than supply-disruption fear. Risk-on conditions and confidence in China’s Q1 2026 manufacturing recovery drove the metal higher in the same session that crushed oil.
- Crude oil (supply-risk-driven): down approximately 7-7.5%, geopolitical premium unwind
- Copper (demand-driven): up +3.4% to US$6.19/lb, risk-on demand repricing
Energy stocks faced a dual force. Commodity price exposure created headwinds from the oil decline, while the broader equity rally provided partial support. The net effect was sector-level tension that commodity investors and multi-asset portfolio managers should monitor closely.
China’s manufacturing recovery provides a structural demand-side floor beneath crude that limits how far the geopolitical premium unwind can push prices before fundamentals reassert. Meanwhile, US pressure on China regarding Iranian oil imports adds a trade dimension that may constrain that floor’s stability.
The supply-demand paradox runs deeper than the overnight session alone: the Strait of Hormuz remained effectively closed at the time WTI touched $100.37, and Goldman Sachs projected a shift from a 1.8 million barrels per day surplus in 2025 to a 9.6 million barrels per day deficit in Q2 2026, meaning sentiment is moving prices in the opposite direction from the physical supply picture.
What traders are watching next: the 24-48 hour diplomatic window
The next move in oil hinges on a formal Iranian response that has not yet arrived. US officials placed the expected timeline at 24-48 hours from 6 May 2026, making the next two days the single most watched near-term catalyst for oil price direction.
Three scenarios, sequenced by market impact:
- Formal agreement reached: Brent likely extends the selloff as the remaining geopolitical premium unwinds further, with prediction market support near $112.15 becoming less relevant
- Talks continue without agreement: Oil stabilises near current levels as markets price in ongoing, but inconclusive, diplomatic momentum
- Talks collapse and military operations resume: Brent reverses sharply toward the prediction market upside target of $131.75/bbl, as the full risk premium re-embeds
Trump’s explicit retention of military optionality means the third scenario remains live. The risk premium has been compressed, not extinguished.
ASX 200 futures were up 95 points (+1.08%) as of 8:10 am AEST on 7 May 2026, reflecting the overnight US gains flowing into the Asia-Pacific session.
The oil market has not returned to normal; it has only paused its ascent
What has changed: the acute geopolitical risk premium has partially unwound, and equities have repriced toward a lower-conflict scenario. What has not: no agreement is signed, military optionality is retained, and prediction markets price residual upside to $131.75 per barrel.
The April 2026 Pakistan-mediated ceasefire created the precondition for this diplomatic opening. Trump’s suspension of the “Project Freedom” Hormuz escort mission is the most concrete diplomatic concession confirmed so far. Iran’s formal response remains pending.
Oil at $101 represents partial de-escalation pricing, not a return to pre-conflict fundamentals. The market has priced in diplomatic progress; it has not priced in diplomatic success.
For anyone monitoring the oil market, the calibration is straightforward. The selloff is real. The diplomatic progress is real. And the residual risk premium is also real. Until a signed agreement replaces optimistic statements, the gap between $101 and $131 remains the market’s measure of how much uncertainty is still priced into every barrel.
For investors wanting to understand what is structurally preventing prices from reaching the $150-$200 range that analysts projected when the Hormuz closure began, our deep-dive into the six cushioning mechanisms keeping Brent below analyst forecasts examines Saudi and UAE pipeline rerouting capacity, IEA reserve release rates, Chinese stockpile resales, and the futures backwardation signals that indicate how long markets expect the disruption to last.
This article is for informational purposes only and should not be considered financial advice. Investors should conduct their own research and consult with financial professionals before making investment decisions. These forward-looking statements regarding diplomatic outcomes and oil price scenarios are speculative and subject to change based on geopolitical developments and market conditions.