
What UK Traders Lose When Their CFD Account Goes Offshore
3 hrs ago
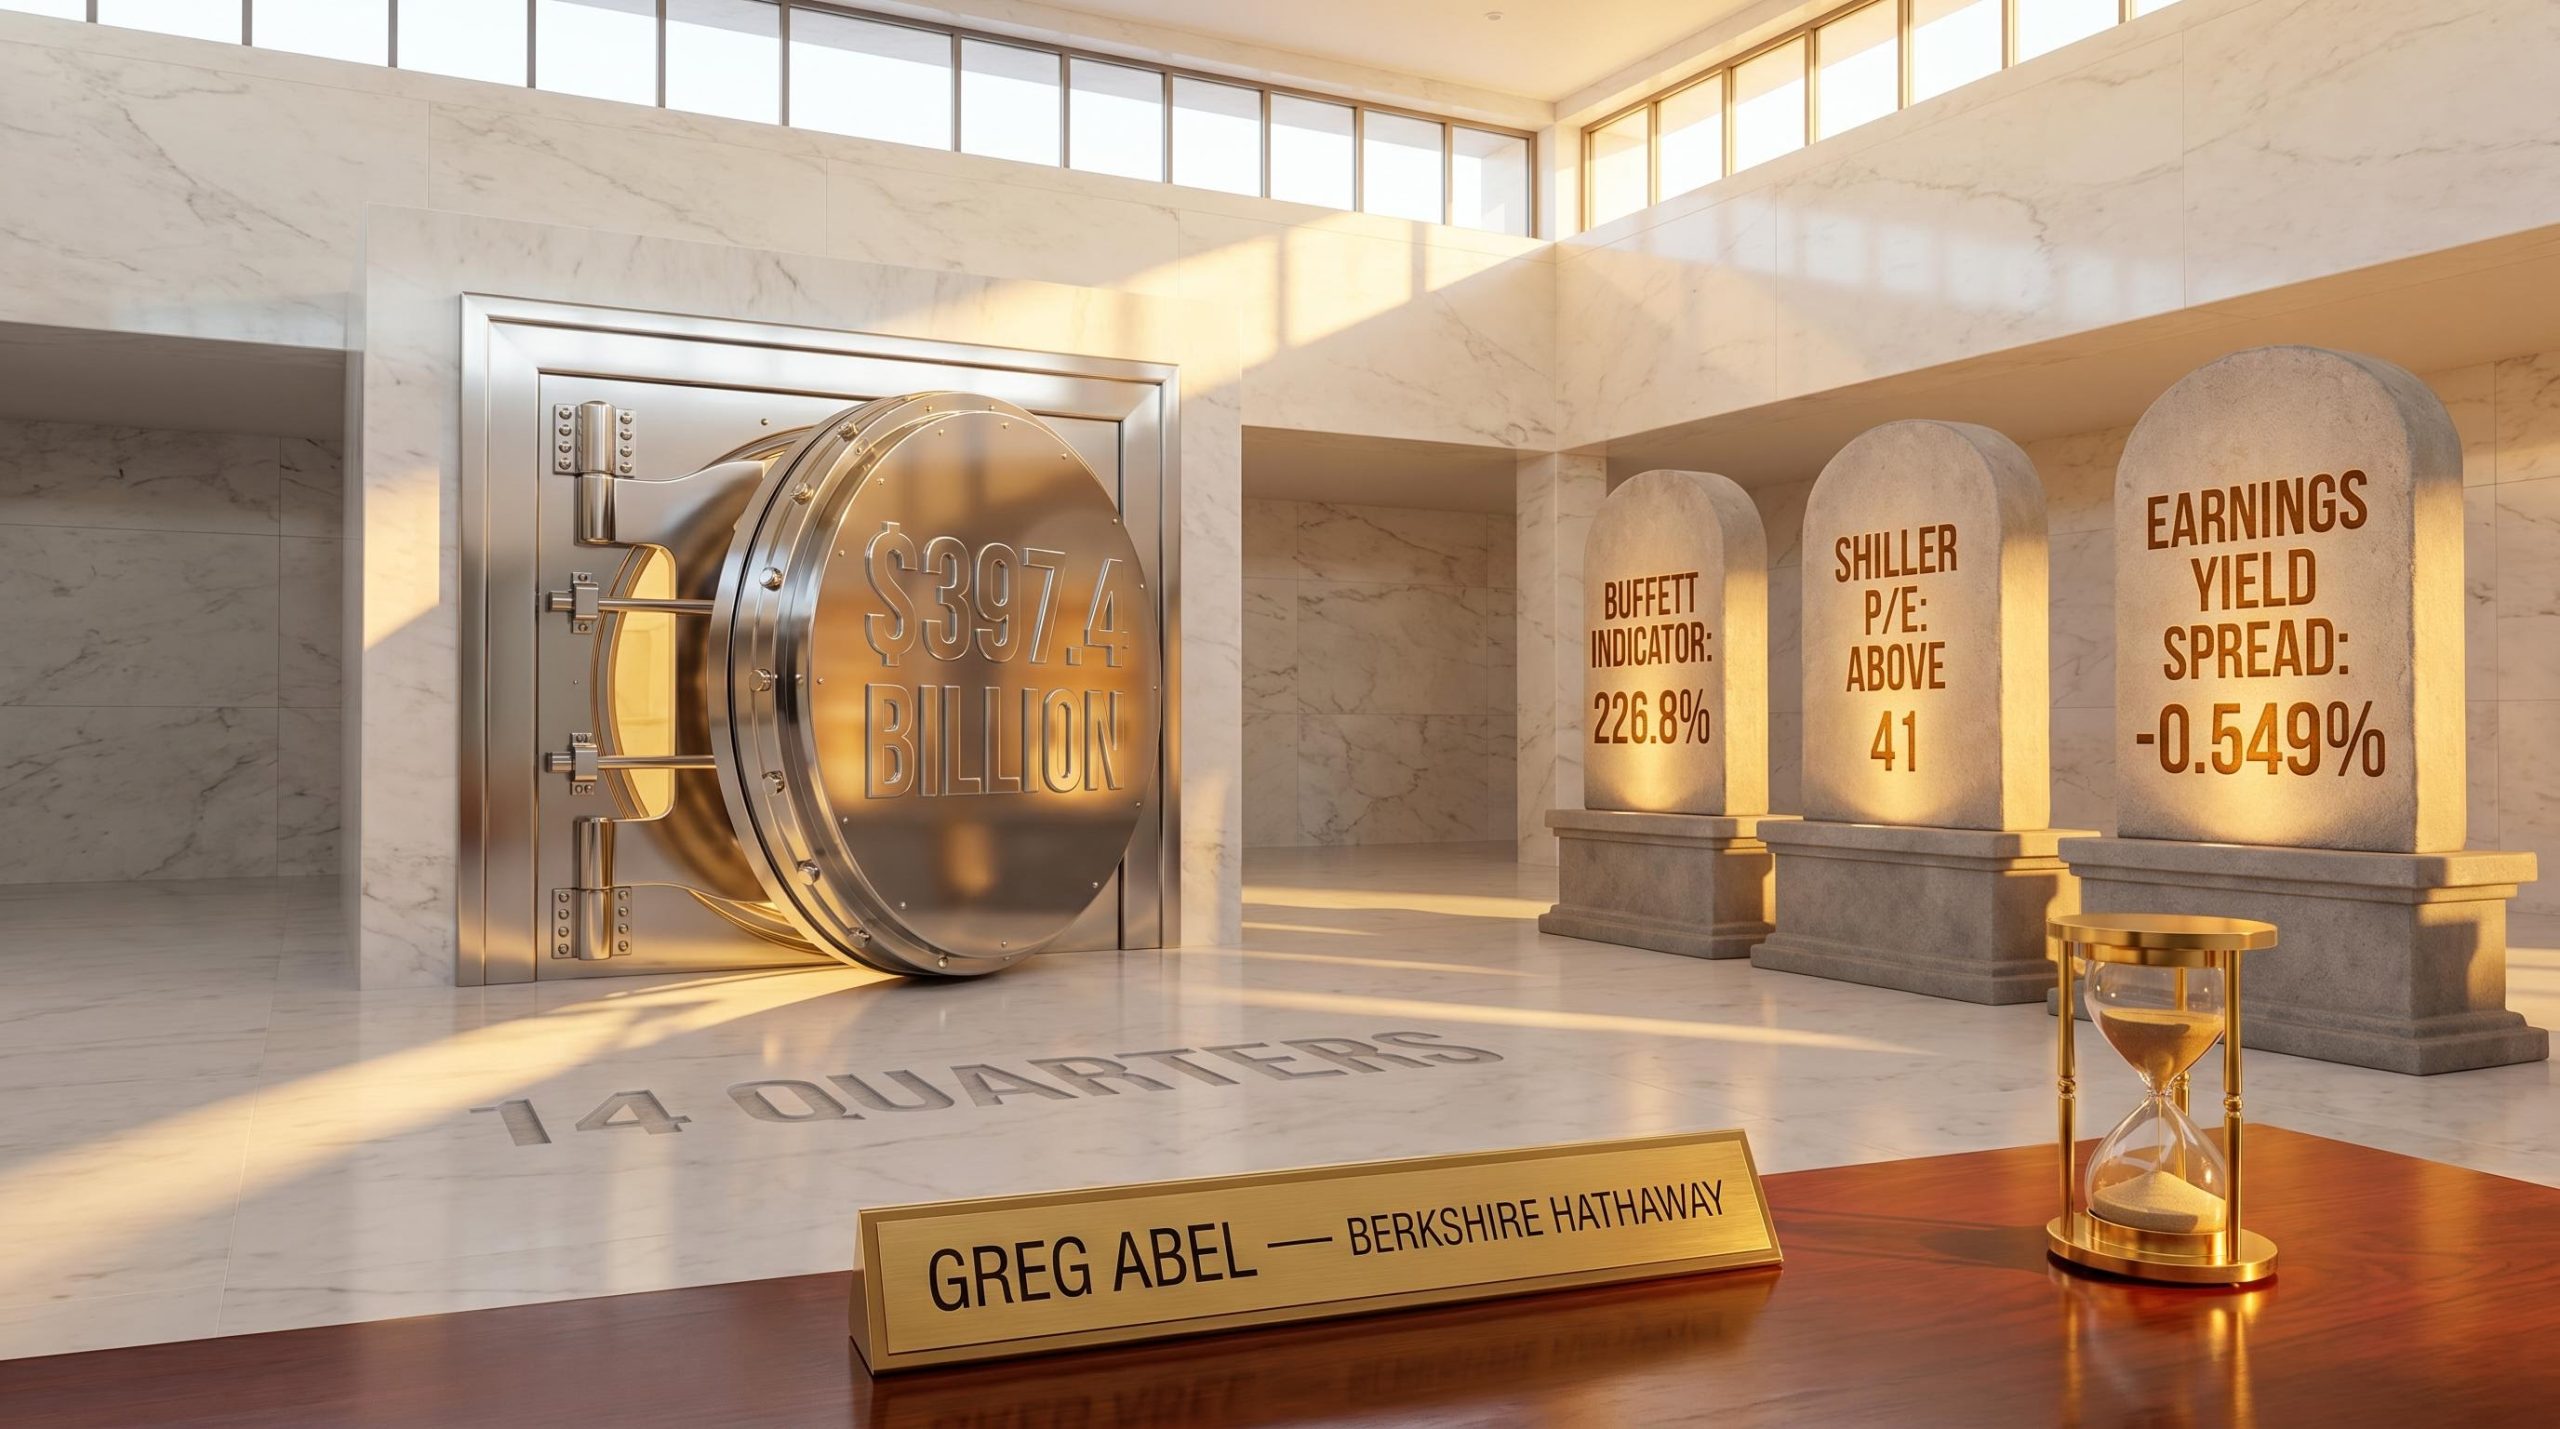
Three market valuation signals are flashing elevated risk simultaneously. The Buffett Indicator sits at 226.8%, the Shiller P/E ratio has climbed above 41, and for the first time in years, 10-year Treasuries yield more than the S&P 500 earnings yield. Meanwhile, the most closely watched institutional investor in American history just handed his successor $397.4 billion in cash and told him to wait.
Greg Abel took the helm at Berkshire Hathaway on 1 January 2026, inheriting the largest single corporate cash reserve in American history and a 14-quarter pattern of net equity selling. When that posture reverses, it will be one of the most consequential investment signals of the decade. The question for individual investors is not whether to pay attention, but whether they will be prepared before it happens.
This guide walks through exactly how to monitor the Abel deployment signal via SEC filings, how to use the same valuation framework Berkshire employs to build a pre-researched watchlist, and why holding cash right now is an active strategic decision rather than a failure of conviction.
Start with the broadest lens. The Buffett Indicator, which measures total US stock market capitalisation as a percentage of gross domestic product, stood at 226.8% as of 30 April 2026. The long-term historical average is 88%. That gap is not a rounding error; the current reading is more than 2.5 times the norm and exceeds the prior all-time high set near the 1999 dot-com peak.
A second, entirely independent measure confirms the same thesis. The Shiller P/E ratio, which smooths corporate earnings over a 10-year inflation-adjusted cycle to filter out short-term noise, has climbed above 41 as of April 2026. Readings at this level have historically preceded deeper market corrections, according to Gotrade analysis.
Shiller’s CAPE data, maintained at Yale and updated monthly, provides the underlying cyclically adjusted earnings figures used to construct the ratio, allowing investors to verify current readings and trace how prior peak valuations in 1929 and 1999 compared to today’s levels above 41.
The third signal is the most practically actionable. As of 1 May 2026, the S&P 500 earnings yield sits at 3.841%, while the 10-year Treasury yields 4.39%, a spread of -0.549%. This earnings yield inversion, where bonds outperform equities on a yield basis, has occurred only a small number of times in the past four decades and has historically preceded significant drawdowns.
No single data point warrants a portfolio overhaul. What makes the current environment unusual is the convergence: three independently derived quantitative measures, using different inputs and different methodologies, all pointing toward the same conclusion at the same time.
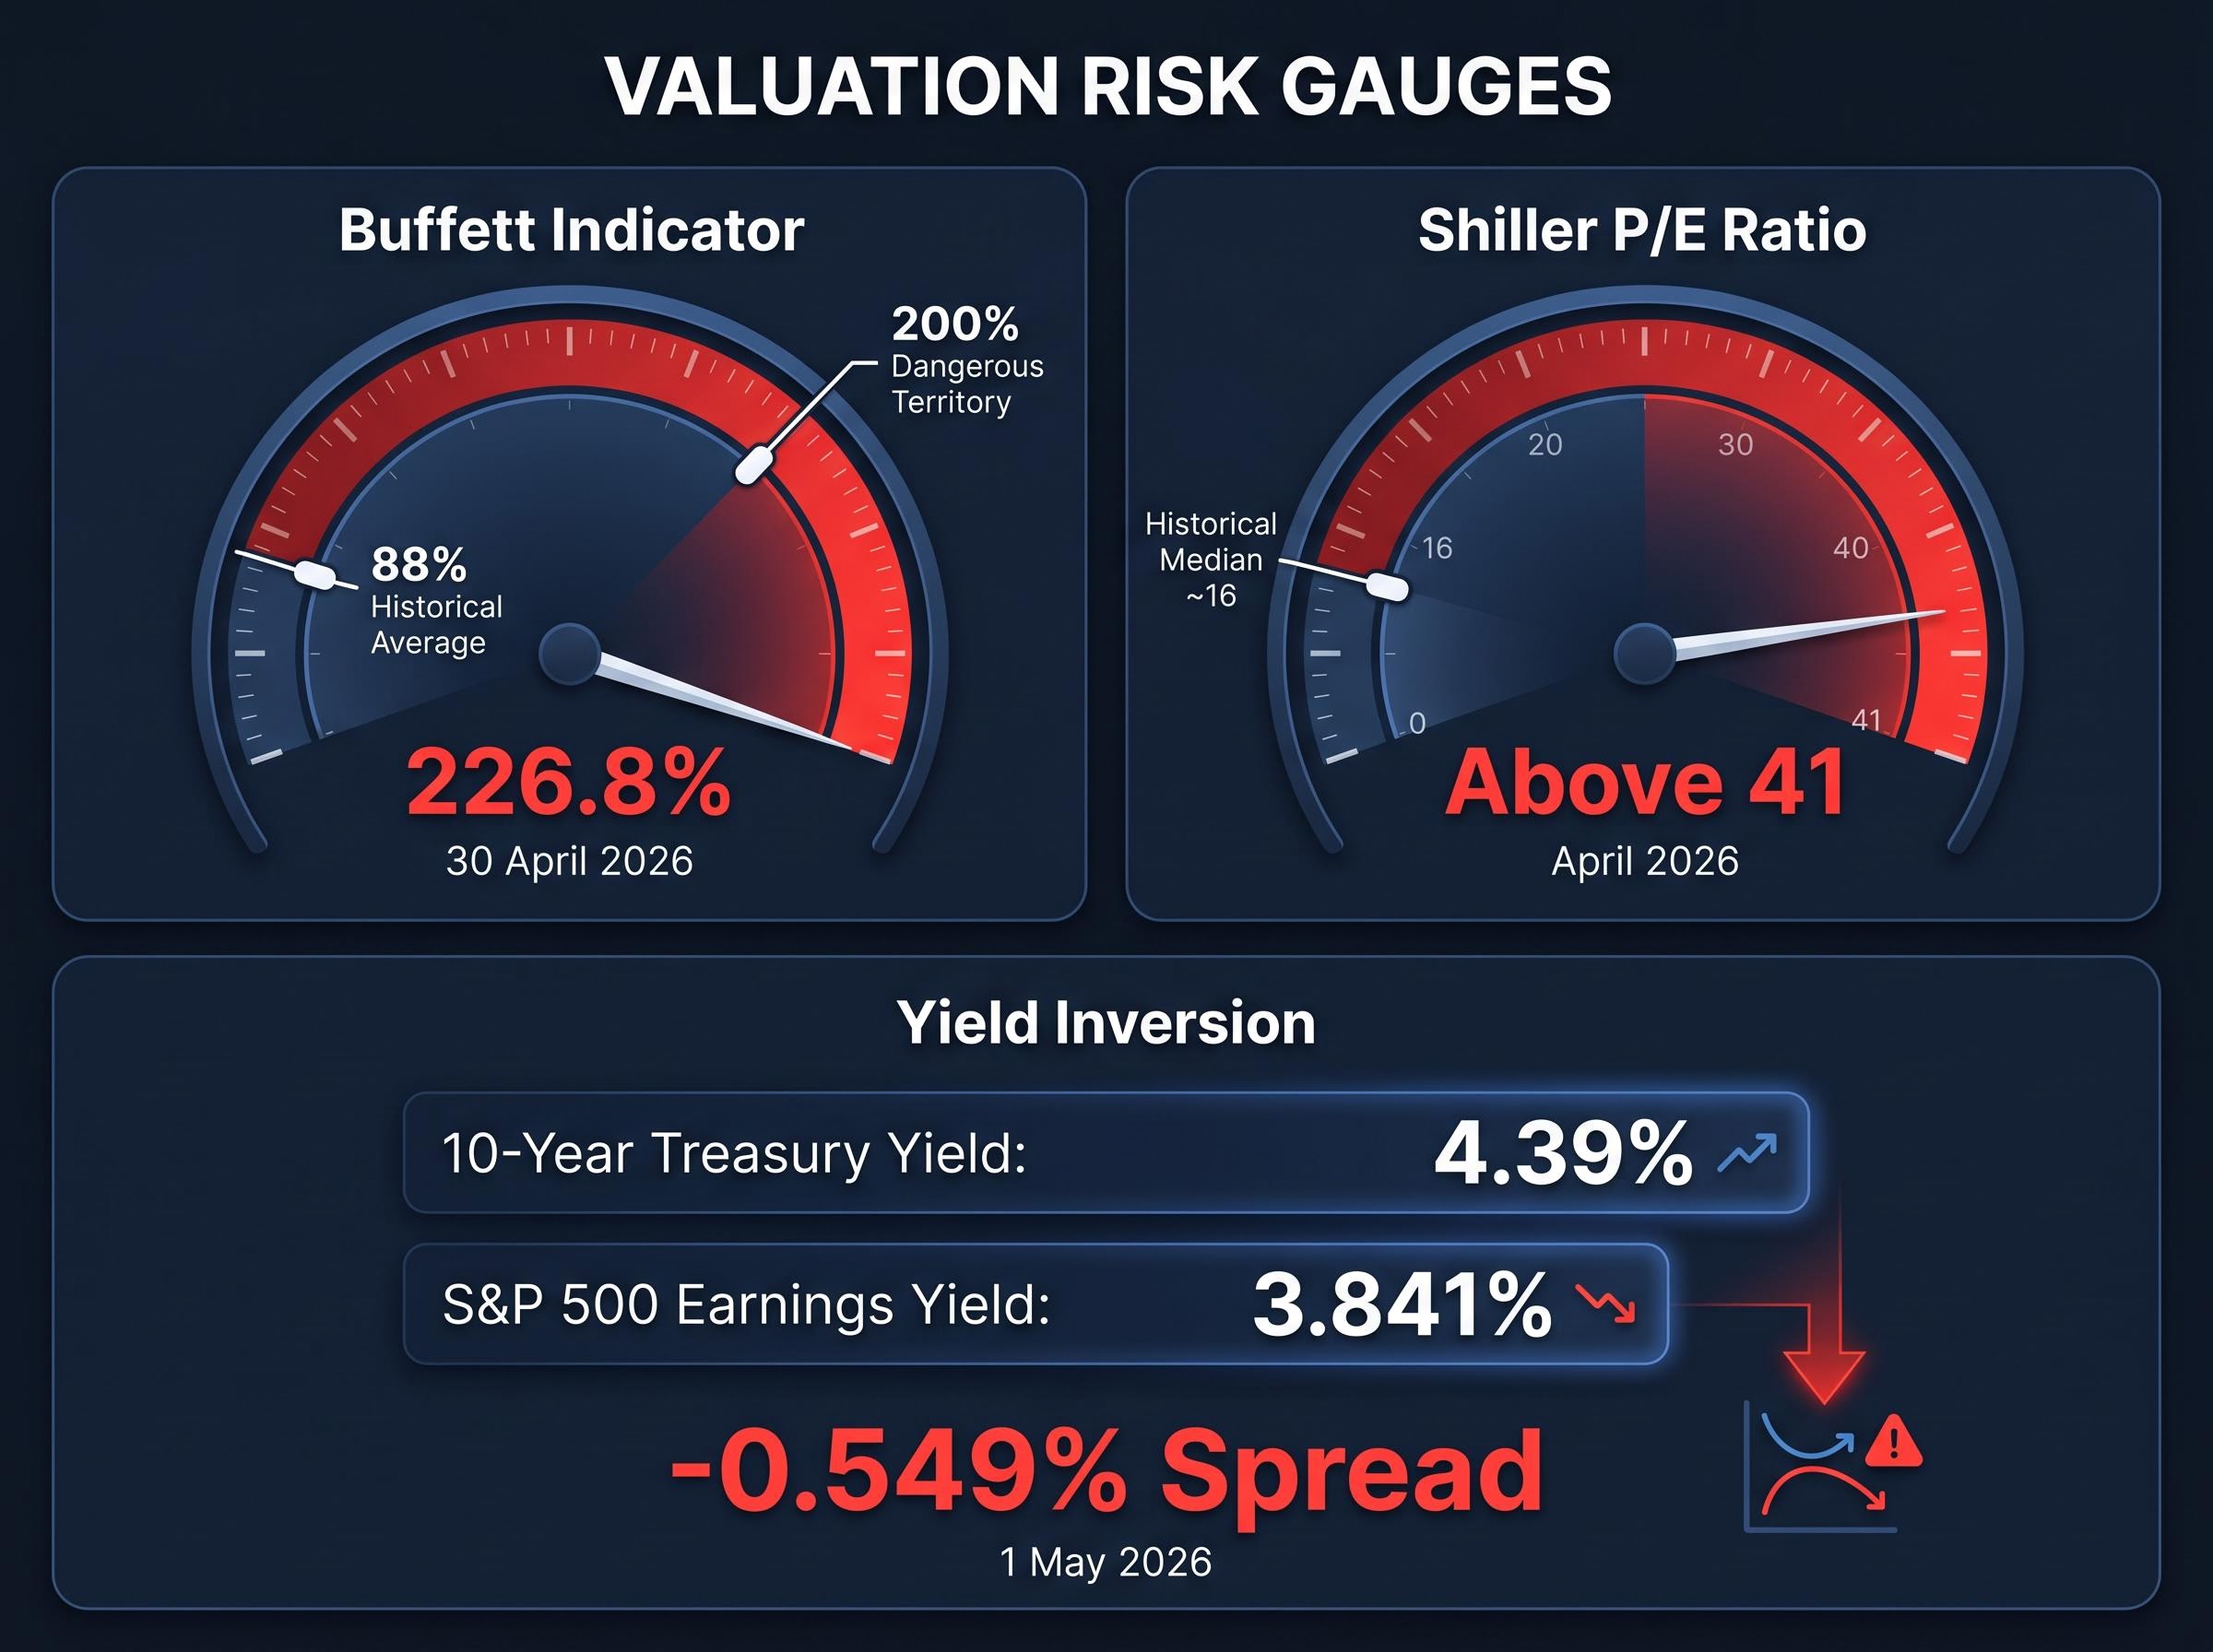
Warren Buffett described the market-cap-to-GDP ratio as entering dangerous territory as it approaches 200%. The current reading of 226.8% exceeds that threshold by a considerable margin.
| Signal | Current Reading | Historical Benchmark | Risk Interpretation |
|---|---|---|---|
| Buffett Indicator | 226.8% (30 April 2026) | 88% long-term average | Significantly above prior dot-com peak; indicates broad overvaluation |
| Shiller P/E Ratio | Above 41 (April 2026) | Historical median near 16 | Elevated readings have preceded major corrections |
| Earnings Yield vs. 10-Year Treasury | -0.549% spread (1 May 2026) | Positive spread in most periods | Bonds currently outperform equities on yield; rare inversion historically precedes drawdowns |
The pattern predates the current market cycle by decades. Three prior episodes reveal the same strategic logic at work.
In each case, the sequence was identical: build cash when nothing meets the quality-at-a-fair-price standard, then deploy aggressively when the correction arrives.
Berkshire has now recorded 14 consecutive quarters of net equity selling, spanning Q4 2022 through Q1 2026. The cumulative total is striking: approximately $194.8 billion more sold than purchased over that period, with $8.149 billion in net sales in Q1 2026 alone.
The resulting cash position, $397.4 billion as of 31 March 2026, defies easy comparison.
Berkshire’s Q1 2026 operating earnings of $11.346 billion, an 18% year-over-year increase driven primarily by insurance underwriting and BNSF railroad, illustrate the structural paradox Abel now manages: a business generating substantial cash inflows into a reserve that already exceeds most sovereign wealth funds.
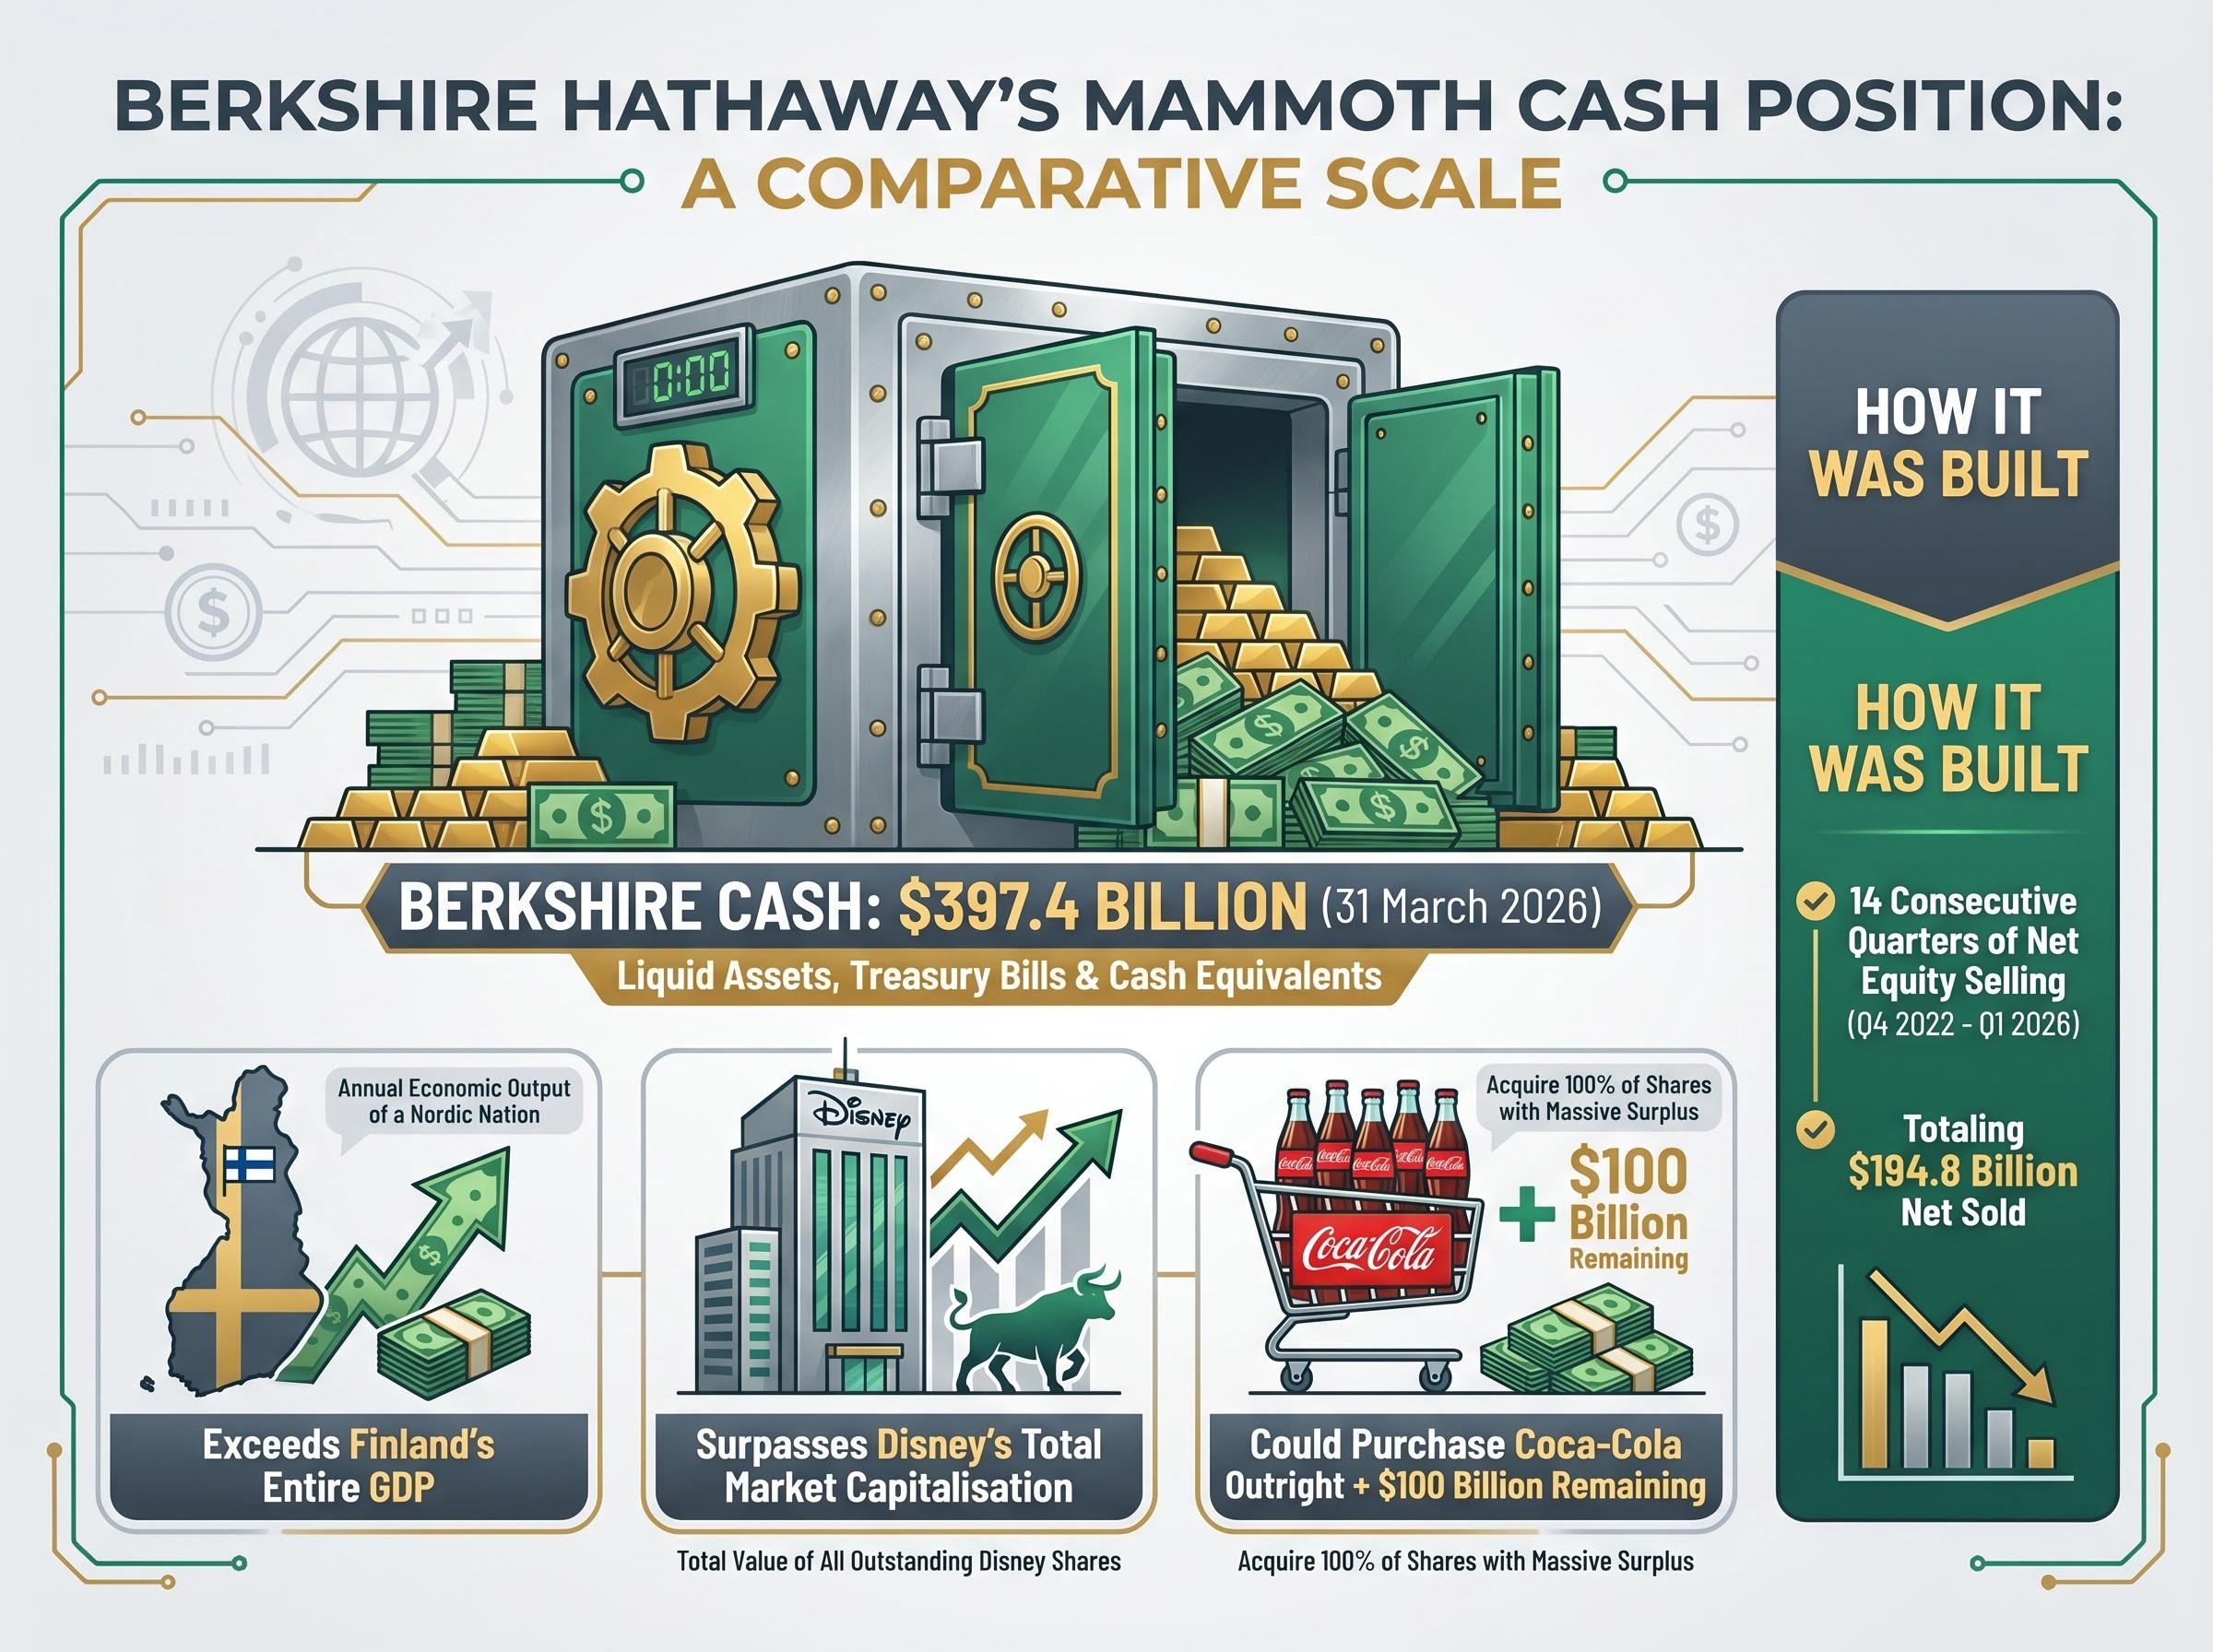
Berkshire’s cash as a proportion of total assets is at levels not seen since before the Great Recession. The scale is different. The logic is the same.
Investors who interpret the leadership change as a reason to discount Berkshire’s positioning are misreading the signal.
Abel assumed leadership on 1 January 2026 and has continued the net-selling pattern rather than deploying capital. That continuation is itself the data point. If Abel viewed the current environment differently from Buffett, the most immediate way to demonstrate that would have been to put the cash to work. He has not.
The Berkshire Hathaway succession involved more than a change of name on the door; Abel’s addition of an Alphabet stake in late 2025, before formally assuming the CEO role, suggested a slightly wider investment aperture than Buffett’s final years, even as the macro posture of accumulating cash remained unchanged.
Buffett’s final acts reinforce this reading. He abstained from significant new equity purchases for roughly 19 months before his retirement. In his final shareholder letter, Buffett stated explicitly that very few available deals met the scale and price criteria Berkshire requires, a structural observation about the market rather than a personal preference.
Buffett stated that he would deploy cash as soon as appropriate opportunities emerged but would not invest simply for the sake of activity.
Bloomberg notes that Abel faces the same structural challenge: deploying capital in a high-valuation environment with few acquisition targets meeting value criteria. Barron’s observes that Abel’s approach of maintaining heavy cash reserves without major equity redeployments represents an amplification rather than a break from Buffett’s historically cautious stance.
When deployment begins under Abel’s leadership, it will carry a specific meaning: Berkshire’s institutional judgment, not one individual’s instinct, has concluded that valuations have corrected enough to justify committing capital. That is a qualitatively different signal than any single analyst call.
The discomfort is real. Watching equity markets climb while holding cash triggers a specific psychological response: the sense that inaction is costing money. That sensation is the mechanism that draws capital into overvalued markets. It is the reason most individual investors buy near peaks and sell near troughs.
Berkshire’s leadership is experiencing the same calculation at a different scale. The difference is that the decision to hold cash is grounded in analysis, not anxiety. Buffett stated he would not invest simply for the sake of activity. Abel has maintained the same posture. For the individual investor, the logic translates directly: cash held with a plan (a watchlist, a monitoring habit, pre-calculated buy prices) is categorically different from cash held out of paralysis.
The distinction matters because the opportunity cost argument, the idea that holding cash means missing returns, runs both ways in the current environment.
The S&P 500 earnings yield of 3.841% is currently below the 10-year Treasury yield of 4.39%. That -0.549% spread means that, on a yield basis, short-duration Treasuries outperform equities right now.
The S&P 500 earnings yield inversion does not exist in isolation; it sits alongside a closed Strait of Hormuz, Brent crude above $112 per barrel, and a Goldman Sachs recession probability of 30-35%, each of which has historically amplified the downside that yield-spread dislocations signal on their own.
For the first time in years, the mathematical case for holding cash over equities is positive, not merely defensible. The earnings yield inversion quantifies what investors give up by holding stocks over bonds in the current environment.
This condition has appeared only a small number of times in four decades and has historically preceded notable market drawdowns. It is a directional signal, not a market-timing tool. The watchlist and the quarterly 13F monitoring habit described in the following sections provide the mechanism to act when conditions change.
Past performance does not guarantee future results. Valuation signals are directional indicators subject to market conditions and various risk factors.
A Form 13F is a quarterly report that institutional investment managers with more than $100 million in assets under management are required to file with the Securities and Exchange Commission (SEC). It discloses their equity holdings as of the end of each calendar quarter.
For Berkshire, the 13F is the document that reveals position-level detail: which stocks were bought, which were sold, and which were added to or trimmed. The aggregate data for Q1 2026 (net sales of $8.149 billion) is already confirmed. The 13F, due by 15 May 2026, will show exactly where that selling occurred and whether any new positions were initiated.
The monitoring process takes under 15 minutes each quarter.
Not every change in a 13F filing is a signal. Minor rebalancing of existing positions, small trims, or adjustments to index-related holdings are routine. Distinguish these from genuine signals.
A meaningful shift would look like one or more of the following: a new equity position in a sector Berkshire has avoided, a substantial increase in an existing position, or a net-buying quarter after 14 consecutive net-selling quarters. Sectors currently identified as trading below fair value per Morningstar analysis offer the most likely candidates:
One caveat deserves emphasis. 13F filings carry a 45-day reporting lag. By the time the filing is public, institutions with greater resources will have already acted on the information. The value for individual investors is directional confirmation, not front-running. The filing tells you that the environment has changed; the watchlist tells you what to do about it.
For investors building the EDGAR monitoring habit described above, it is worth noting that SEC reporting infrastructure may shift materially in the coming years; a May 2026 proposal would allow eligible companies to file semiannually rather than quarterly, which would extend the information lag that already affects 13F-based investment signals from 45 days to potentially six months.
Market dislocations unfold quickly. The S&P 500 lost more than 30% in roughly five weeks during March 2020. Investors without pre-researched conviction in those weeks either froze or chased momentum, and both outcomes were costly.
The work of identifying which businesses to buy at what price belongs in the quiet period before a correction, not in the volatile sessions after one begins. A well-constructed watchlist converts the Abel deployment signal from an interesting data point into an actionable trigger.
The framework is straightforward. Phil Town, citing the Buffett methodology, notes that this approach of identifying outstanding businesses at attractive prices with a sufficient margin of safety generated approximately 20% annualised returns over 60 years.
Build the watchlist in five steps:
Aim for a list of five to fifteen companies. In the current environment, sectors already trading closer to fair value are where the first opportunities are likely to emerge in a correction. Morningstar’s below-fair-value assessment highlights several starting-point research candidates:
These are research starting points, not buy recommendations. Each requires individual analysis before inclusion on a personal watchlist.
These statements are speculative and subject to change based on market developments and company performance.
The preparation framework this guide has built rests on three elements: monitoring Berkshire’s 13F filings quarterly for the first sign of net buying, maintaining a pre-researched watchlist with pre-calculated buy prices, and holding cash as a deliberate strategic position while valuation signals remain stretched.
The Abel deployment signal, when it arrives, is a confirmation mechanism rather than a trigger. Investors who have done the preparation work will already know which businesses they want to own and at what price. The 13F shift simply confirms that the environment has changed enough for the most patient institutional capital in the world to move.
The window for preparation is the period before the correction, not after. The readers who build their watchlist, set price alerts, and establish their quarterly EDGAR monitoring habit now will be positioned to act with conviction rather than react with uncertainty when prices fall.
Take one concrete step this week: open SEC EDGAR, locate Berkshire’s 13F filing history using CIK 0001067983, and identify one business at the right price to begin the list.
This article is for informational purposes only and should not be considered financial advice. Investors should conduct their own research and consult with financial professionals before making investment decisions.
The Buffett Indicator measures total US stock market capitalisation as a percentage of GDP, with a long-term average of 88%. At 226.8% as of April 2026, it sits more than 2.5 times the historical norm, signalling broad market overvaluation.
A Form 13F is a quarterly SEC filing required of institutional managers with over $100 million in assets, disclosing their equity holdings. Investors can track Berkshire Hathaway's buying and selling activity by searching CIK number 0001067983 on SEC EDGAR each quarter.
Start by identifying businesses with durable competitive moats and strong management, then calculate intrinsic value using conservative earnings-growth estimates and set a buy price at roughly 50% of that figure as a margin of safety. Sectors currently trading closer to fair value, such as financials, industrials, and utilities, offer useful starting points for research.
Berkshire has net-sold approximately $194.8 billion in equities from Q4 2022 through Q1 2026 because few available deals meet its quality-at-a-fair-price standard in a high-valuation environment. Both Warren Buffett and his successor Greg Abel have maintained this posture, building a cash reserve of $397.4 billion as of March 2026.
As of May 2026, the S&P 500 earnings yield of 3.841% sits below the 10-year Treasury yield of 4.39%, meaning bonds currently outperform equities on a yield basis. This inversion has occurred only a handful of times in the past four decades and has historically preceded significant market drawdowns.