How Zero Commissions Changed the Maths on Thematic ETFs
6 hrs ago
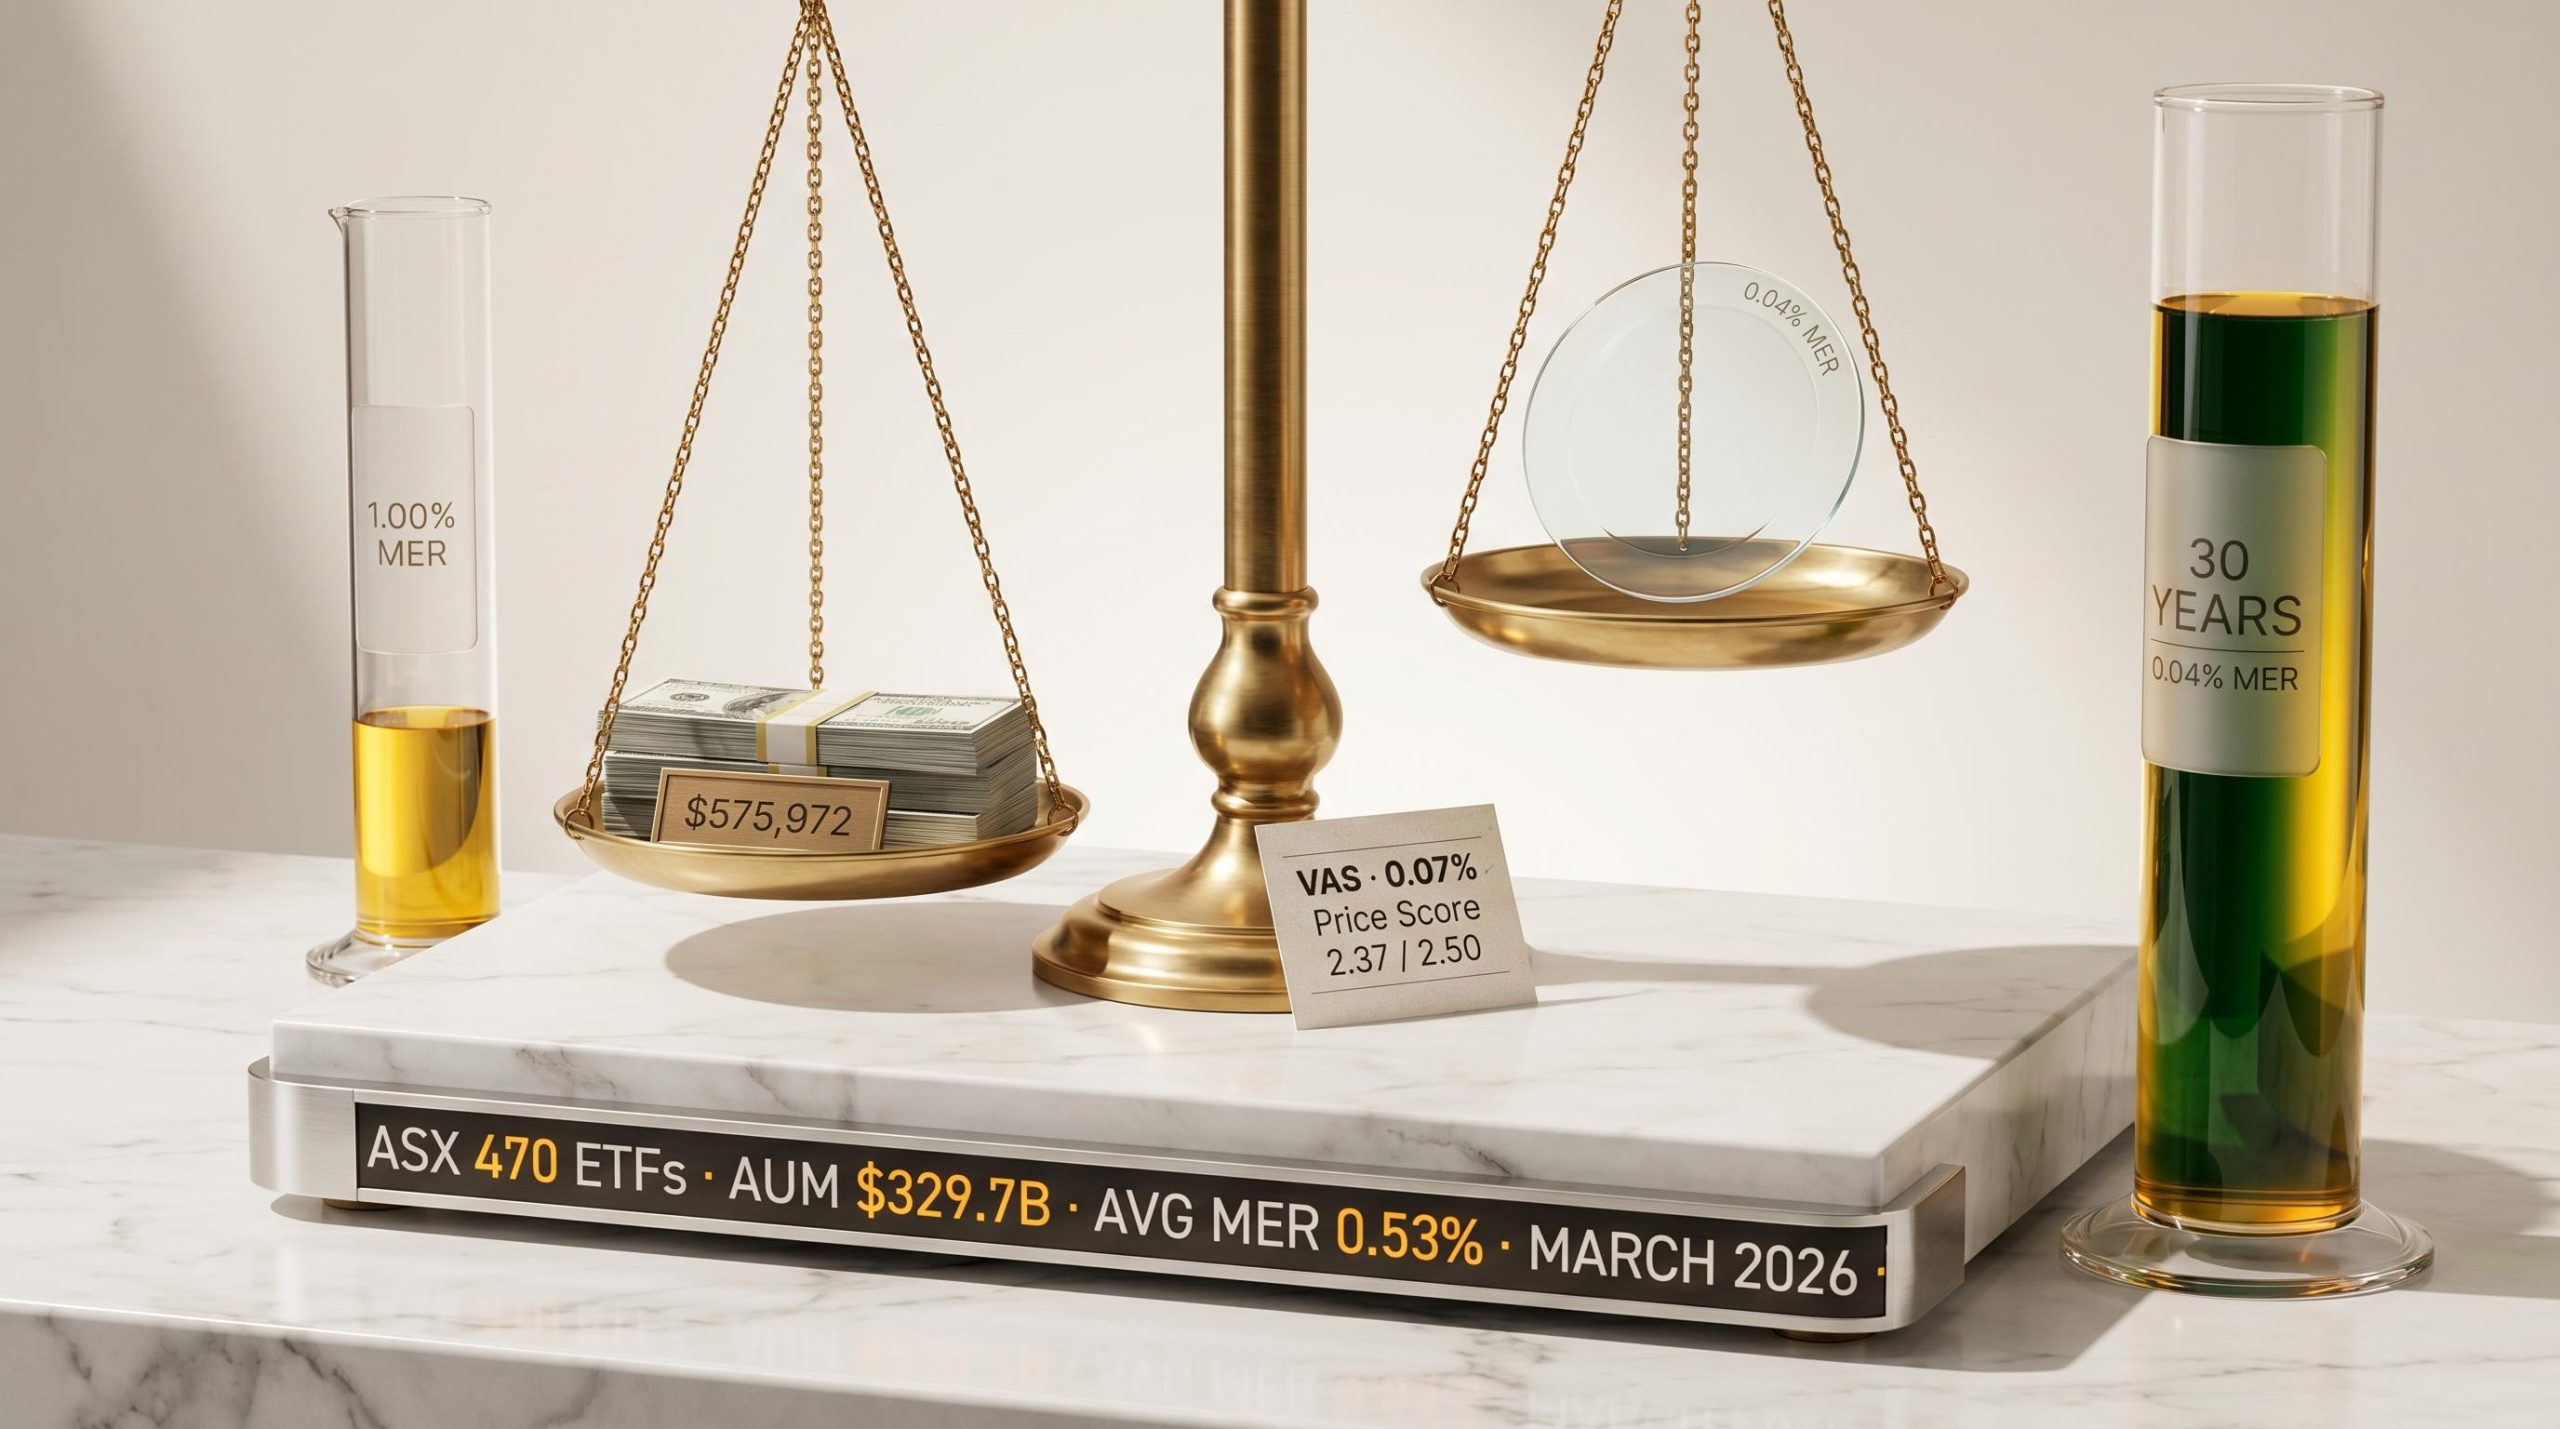
The ASX now lists 470 ETFs with combined assets of $329.7 billion, and the single variable most consistently shown to predict which of those funds will outperform over the long run is not past returns, not fund size, and not star ratings. It is the fee. Australian ETF adoption has accelerated sharply, with assets under management growing 31.7% over the prior year as of March 2026. A larger and faster-growing universe, however, makes cost-aware selection harder, not easier. With average management expense ratios (MERs) across the ASX sitting at approximately 0.53% per annum and individual fund fees ranging from 0.03% to above 1%, the spread between a well-chosen and a carelessly chosen ETF can compound into a materially different financial outcome over a decade or more. This guide explains why fees predict long-term performance, how ETF fee mechanics actually work, what the compounding cost drag looks like in dollar terms, and how to apply a structured, category-relative screening approach to narrow a 470-fund universe into a manageable shortlist.
Most investors begin their ETF search by looking at past performance. It feels intuitive: find the funds that have delivered the strongest returns and assume that pattern will continue. The research, however, consistently inverts that instinct.
Multiple studies, including repeated analysis from Morningstar, have identified fund fees as one of the most reliable predictors of future investment success. Not trailing returns. Not fund size. Not qualitative ratings. Fees.
Morningstar research on fund fees and returns found that lower-cost funds were significantly more likely to succeed and outperform higher-cost peers across asset classes and time periods, a finding that has held up consistently across repeated analyses and multiple markets.
Research consensus: Across asset classes and geographies, fund fees have been shown to be a more reliable predictor of relative long-term returns than past performance, fund size, or star-based rating systems.
The logic is straightforward. Unlike active manager skill, which varies from year to year, and unlike market conditions, which shift with cycles, fees are known in advance. They do not change with the economic environment. They compound against the investor every single year, with certainty.
For Australian investors facing 470 ETFs on the ASX with an average MER of approximately 0.53%, the challenge is not identifying whether a specific fee is “high” or “low” in absolute terms. It is establishing a reliable filter before analysis begins, one that narrows the field based on a variable with genuine predictive power. Fees are that variable.
The Management Expense Ratio is an annual percentage fee expressed as a proportion of the fund’s net asset value. It accrues daily and is typically deducted monthly. The critical detail for investors is the deduction mechanism: there is no invoice, no line item on a brokerage statement, and no visible transaction. The fee is reflected in the ETF’s unit price, which means it silently erodes returns without the investor ever seeing a charge.
This invisible deduction is why many beginner investors underestimate ETF costs. A fund charging 0.50% per annum does not send a bill for $500 on a $100,000 holding. Instead, the unit price is fractionally lower each day than it would have been without the fee. Over months and years, the effect accumulates.
Across ASX-listed ETFs, fees span a wide range. Low-cost passive index trackers sit at one end; active and thematic products sit at the other.
| ETF Type | Example Fund | Approximate MER | Cost Tier |
|---|---|---|---|
| Low-cost passive index | BetaShares A200 | 0.04% | Ultra-low |
| Low-cost passive index | Vanguard VAS | 0.07% | Low |
| Active / thematic | Various | 0.50-1.00%+ | Moderate to high |
The MER is not the total cost of ownership. Morningstar Australia identifies two components: holding costs (the MER itself) and transaction costs (brokerage paid when buying or selling ETF units on the ASX, plus the bid-ask spread).
For investors who trade infrequently and invest larger amounts, transaction costs are a minor addition. For those investing smaller amounts, say $500 lots rather than $5,000 lots, brokerage represents a materially larger proportion of each transaction. A $10 brokerage fee on a $500 purchase is a 2% cost before the MER even begins to accrue. Both layers deserve attention, but the MER is the cost that compounds every day the investment is held.
The full ETF cost of ownership on the ASX includes not only the MER but also the bid-ask spread on each trade and brokerage commissions that can represent a significant percentage of small transaction amounts, with execution practices such as using limit orders and avoiding the opening and closing minutes of each session helping investors minimise those transaction-layer costs.
Consider two ETFs tracking the same Australian equities index. One charges 0.04% per annum. The other charges 1.00%. In any single year, the difference barely registers.
Over 30 years, modelling from fee calculator tools such as Banker on Wheels suggests the terminal wealth divergence between those two funds could reach approximately $575,972, depending on the initial investment amount and assumed rate of return.
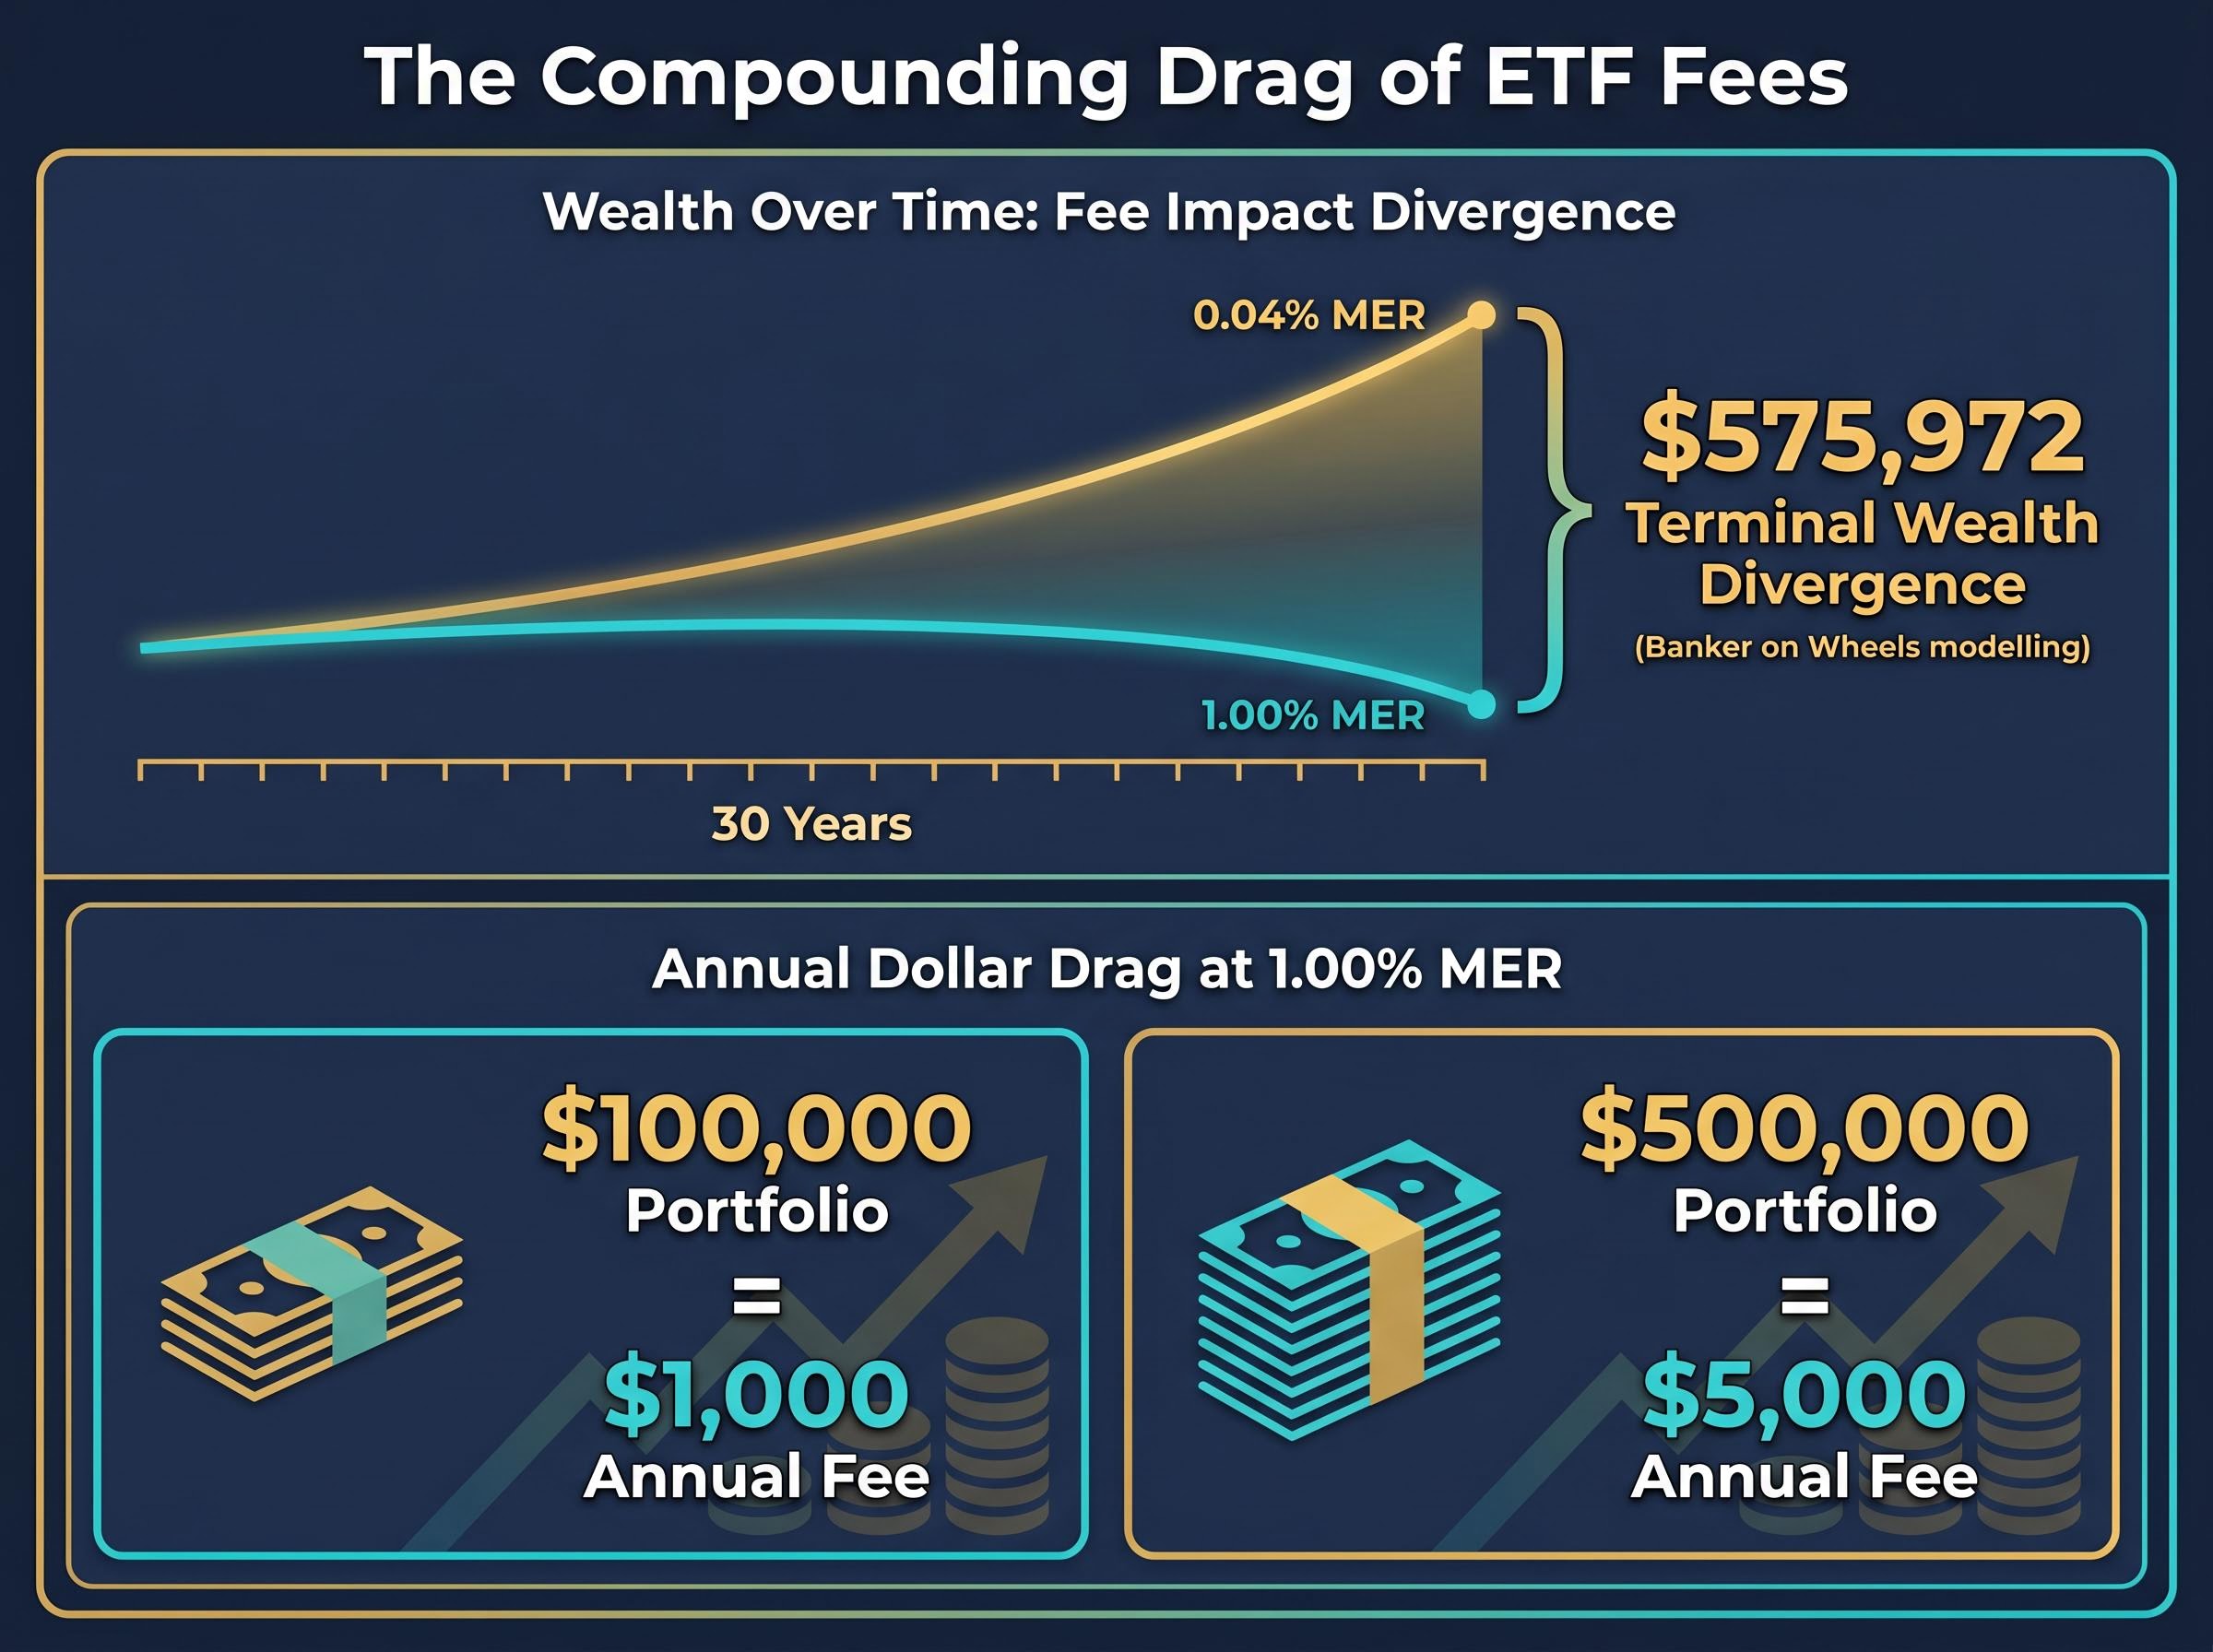
That figure is assumption-dependent, but the direction is not: a fee difference of less than 1% per annum, compounded over a long investment horizon, can consume hundreds of thousands of dollars in terminal wealth.
The mechanism is straightforward. As the portfolio grows, the same percentage fee extracts a larger dollar amount each year. A 1.00% MER on a $100,000 portfolio is $1,000. On a $500,000 portfolio, it is $5,000. The drag accelerates precisely when the portfolio is at its largest and compounding is doing its most valuable work.
The conditions under which fee drag is most severe are worth noting:
These are not hypothetical edge cases. With the ASX average MER at approximately 0.53% and several passive alternatives available at 0.04-0.07%, the divergence scenarios described above reflect live comparisons available to any Australian investor today.
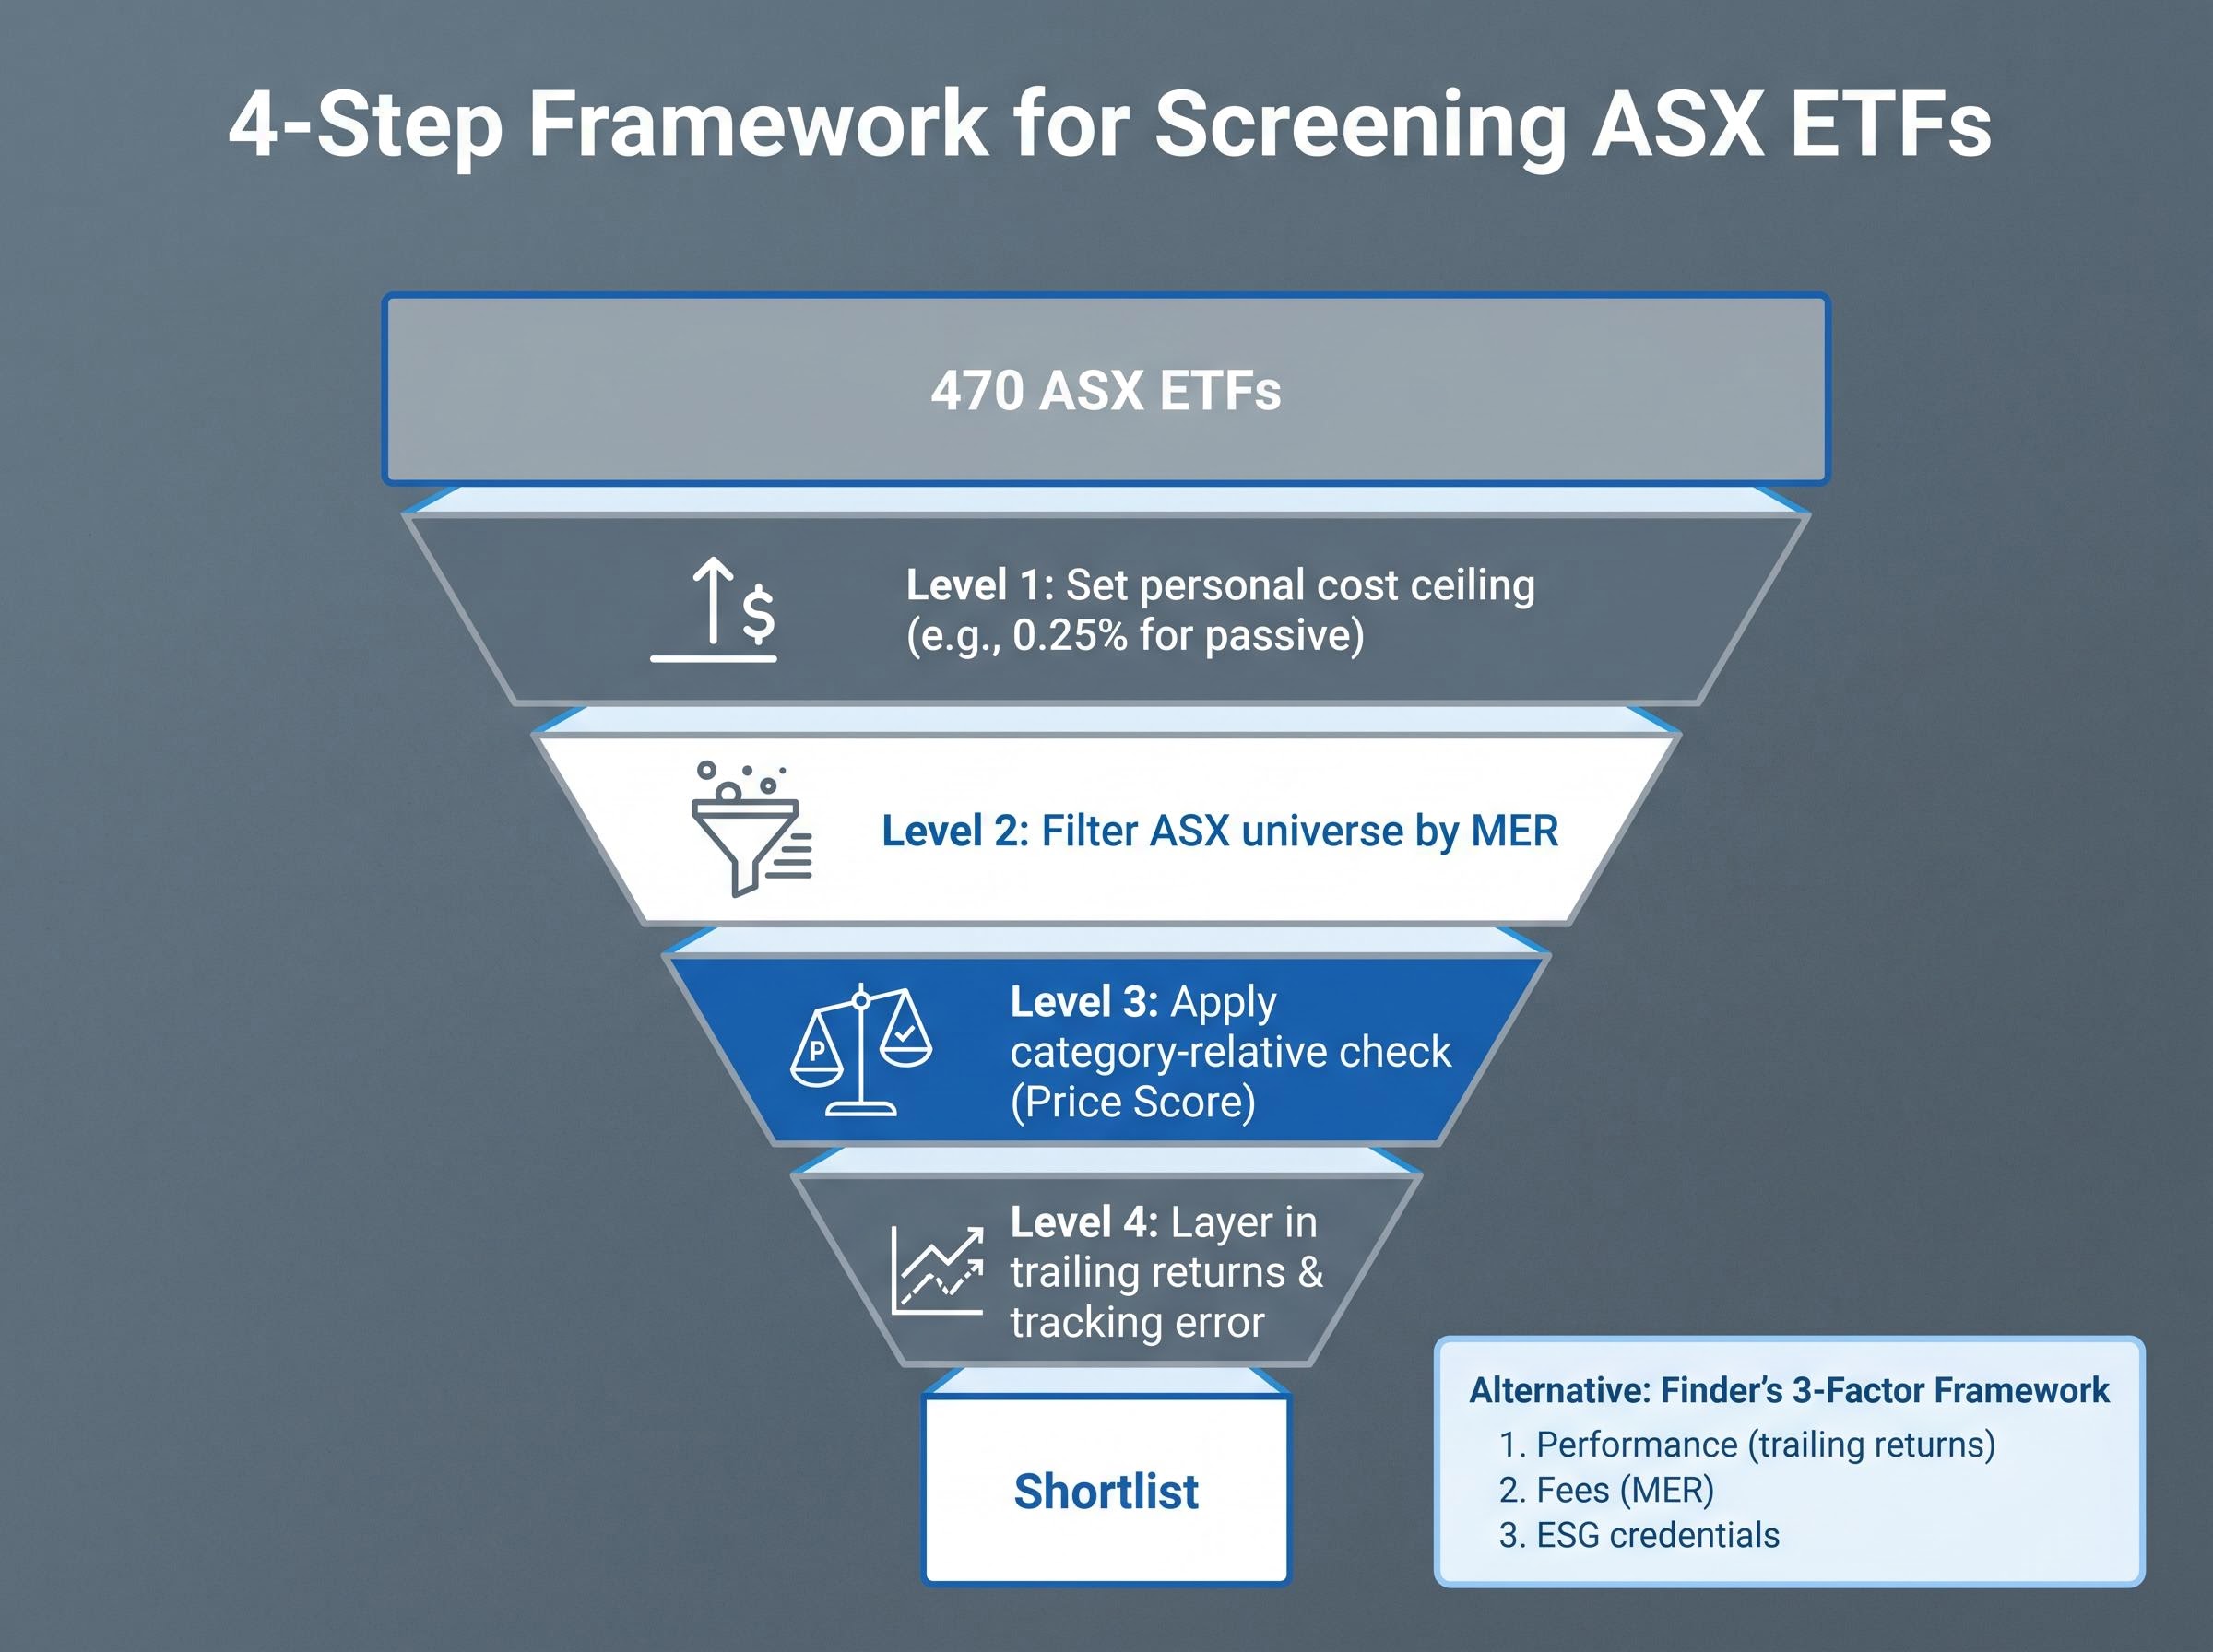
Knowing that fees matter is the passive half of the equation. The active half is screening for them. With 470 ETFs on the ASX, investors need a repeatable process, not an ad hoc comparison that restarts every time they evaluate a new fund.
A practical starting point is an informal cost ceiling: a threshold above which products are excluded from further analysis. Simonelle Mody, Associate Investment Specialist at Morningstar Australia, has cited a personal screening rule of excluding products above 0.25% total cost ratio per annum.
That figure is illustrative, not universal. An investor focused exclusively on passive broad-market ETFs may set a tighter ceiling, say 0.10%. An investor allocating to niche or thematic strategies may need to adjust upward, accepting that specialised strategies carry higher management costs. The purpose of the ceiling is not precision; it is to reduce the field before deeper analysis begins.
Passive index ETF outperformance against active funds on a net-of-fees basis reached approximately 80% in 2025, a figure that reflects the structural weight of cost drag on active strategies and reinforces why fee-level screening, rather than performance chasing, is the more durable portfolio construction approach.
The limitation of any absolute threshold is that a fee considered competitive in one category may be expensive in another. A 0.50% MER is high for an ASX 200 index tracker but may be competitive for an actively managed global equities fund. This is where category-relative comparison becomes more meaningful.
The Morningstar Price Score offers a structured approach. The score benchmarks a fund’s fee against competitors in the same investment category, producing a continuous measure of relative cost positioning. The formula is: Price Score = 5 x (1 – fee percentile rank) – 2.5, which generates a scale from -2.5 (most expensive relative to peers) to +2.5 (least expensive). A fund at the 72nd fee percentile, for example, receives a Price Score of -1.10.
The Price Score carries meaningful weight in Morningstar’s overall Medalist Rating: 40% for passive funds and 30% for active funds, reflecting the reality that costs are a primary determinant of index-tracking outcomes.
A practical screening sequence combines both approaches:
Finder’s three-factor framework, evaluating products across performance (trailing returns), fees (MER), and ESG credentials, offers another structured entry point for cost-conscious Australian investors.
| Approach | How It Works | Best Suited For | Limitation |
|---|---|---|---|
| Absolute cost ceiling | Exclude all ETFs above a set MER threshold | First-pass screening; passive-only portfolios | Does not account for category norms |
| Category-relative (Price Score) | Benchmarks fee against peers in same category | Mixed portfolios; active and thematic inclusion | Requires access to category peer data |
The Vanguard Australian Shares ETF (VAS) is one of the most widely held ETFs on the ASX and provides a concrete illustration of how category-relative fee comparison works in practice.
VAS carries a management fee of approximately 0.07%. In isolation, that number is low. But the category-relative question is more specific: how does 0.07% compare to what other funds in the same investment category charge?
The median fee across the Australia Large Blend category is 0.93%. VAS, at 0.07%, sits well below that median, a gap of 0.86 percentage points that compounds in the investor’s favour every year the position is held.
That gap translates into a calculated Price Score of 2.37 out of a possible 2.50, placing VAS in the cheapest quintile of the Australia Large Blend category as of May 2026, according to Morningstar data.
| Fund | Management Fee | Category Median Fee | Price Score | Category Fee Ranking |
|---|---|---|---|---|
| Vanguard VAS | 0.07% | 0.93% | 2.37 / 2.50 | Cheapest quintile |
The lesson generalises beyond this single example. The question for any ETF under evaluation is not “is 0.50% cheap?” but “is 0.50% cheap relative to what else is available in this category?” Applying that framing to every fund on a shortlist converts fee comparison from a vague preference into a structured, repeatable decision.
International ETF flows overtook domestic ETFs as the most purchased category on at least one major ASX brokerage platform in Q1 2026, a shift that means the cost-screening framework described here applies with equal force to global equities funds, where fee ranges and category norms differ meaningfully from the Australia Large Blend category used as the VAS case study above.
Fees are knowable in advance, compound silently against the investor, and represent one of the few variables entirely within an investor’s control at the point of fund selection. That combination is why cost-aware screening is not a cynical elimination exercise but a durable, evidence-backed skill.
The framework is simple to state and repeatable to apply: set a personal cost ceiling, check surviving funds against their category peers using a relative measure such as the Price Score, then layer in returns and other criteria. Every year the investor uses this process, the compounding benefit works in their favour.
As the ASX ETF universe continues to grow beyond 470 funds, cost-aware screening becomes more valuable, not less. A larger universe amplifies the risk of selecting a high-cost option by default, simply because there are more of them to encounter. A structured approach eliminates that risk before it compounds.
Investors ready to move from framework to shortlist will find our deep-dive into ASX ETFs screened for the current inflation environment useful, as it applies cost and income criteria to six specific funds across Australian bonds, global equities, and cash categories, with management fees, distribution yields, and AUM included for each.
This article is for informational purposes only and should not be considered financial advice. Investors should conduct their own research and consult with financial professionals before making investment decisions.
An ETF management expense ratio (MER) is an annual percentage fee charged as a proportion of the fund's net asset value. It accrues daily and is reflected in the ETF's unit price rather than appearing as a separate charge, meaning it silently reduces returns over time.
Research from Morningstar has consistently found that lower-cost funds are significantly more likely to outperform higher-cost peers over time. Unlike past performance or market conditions, fees are known in advance and compound against the investor every single year with certainty.
The average management expense ratio across ASX-listed ETFs sits at approximately 0.53% per annum, with individual fund fees ranging from as low as 0.03% for passive index trackers to above 1% for active and thematic products.
A practical approach is to set a personal cost ceiling (such as 0.25% for passive funds), filter the 470-fund ASX universe by MER to remove products above that threshold, then apply a category-relative check such as the Morningstar Price Score to compare surviving funds against peers in the same investment category.
The Morningstar Price Score benchmarks a fund's fee against competitors in the same investment category, producing a scale from -2.5 (most expensive relative to peers) to +2.5 (least expensive). It carries a 40% weighting in Morningstar's overall Medalist Rating for passive funds, reflecting how central cost is to index-tracking outcomes.