Asian Chip Stocks Split: SK Hynix Falls 4.3%, Hon Hai Gains
4 mins ago

As of December 2025, the U.S. small-cap universe carried a quality factor exposure of approximately -0.64 per the Morningstar Risk Model. That single number, a significant negative quality tilt embedded in the most widely tracked small-cap benchmark, is the structural explanation that most macro-focused commentary on small-cap underperformance has missed.
Small-cap equities have trailed large-cap peers across most major global markets for the better part of a decade. The conventional explanation cycles through interest rates, growth fears, and sentiment. But the body of research running through late 2025 and into early 2026 points to something more durable: the companies inside small-cap indexes have genuinely deteriorated on the measures that drive long-term equity returns. Profitability is lower. Balance sheets are weaker. The best firms that would have listed a decade ago increasingly do not.
What follows explains how the composition of the publicly traded small-cap universe has shifted, why private capital markets are a structural accelerant of that shift, what the quality-adjusted evidence says about the real size premium, and what this means for investors assessing the asset class today.
The underperformance is not a U.S. story that gets extrapolated globally. It is a global story with a handful of exceptions that sharpen the analytical question.
The Morningstar Global ex-US Small Cap Target Market Exposure Index underperformed its large- and mid-cap equivalent by over 1 annualised percentage point across the 10-year period ending 30 January 2026.
That gap persisted across rate environments. The ECB and Bank of England both cut rates in 2025, yet European and UK small caps failed to rally. UK small caps, in fact, showed an even wider underperformance gap versus large-cap UK equities than was observed in the U.S. Japanese small caps lagged in 2021, a year of Japan’s strongest economic growth in multiple decades. The November 2024 post-election small-cap rally in the U.S. reversed within weeks.
If macro tailwinds were sufficient, at least one of these episodes would have produced a sustained catch-up. None did.
The regional scorecard tells the story:
India and Australia broke the pattern. That divergence makes the macro-only explanation harder to sustain and points toward something embedded in how small-cap indexes are constructed.
Quality, in the context of equity factor investing, refers to a cluster of financial characteristics: profitability, financial leverage, and balance sheet strength. Companies that generate high returns on equity with manageable debt loads and stable earnings score well on quality. Those that burn cash, carry heavy leverage, or operate without revenue score poorly.
Quality factor investing screens companies on return on equity, stable earnings growth, and financial leverage, prioritising financial discipline over size or brand recognition, and the distinction matters because two indexes can hold nominally similar companies while producing materially different quality exposures depending on how rigorously those screens are applied.
Over the decade spanning 2016-2025, Morningstar analysis found that profitability and financial leverage metrics deteriorated across both U.S. and international small-cap universes. Large-cap equities moved in the opposite direction, improving on quality measures in most regions over the same period. The divergence sharpened the relative picture considerably.
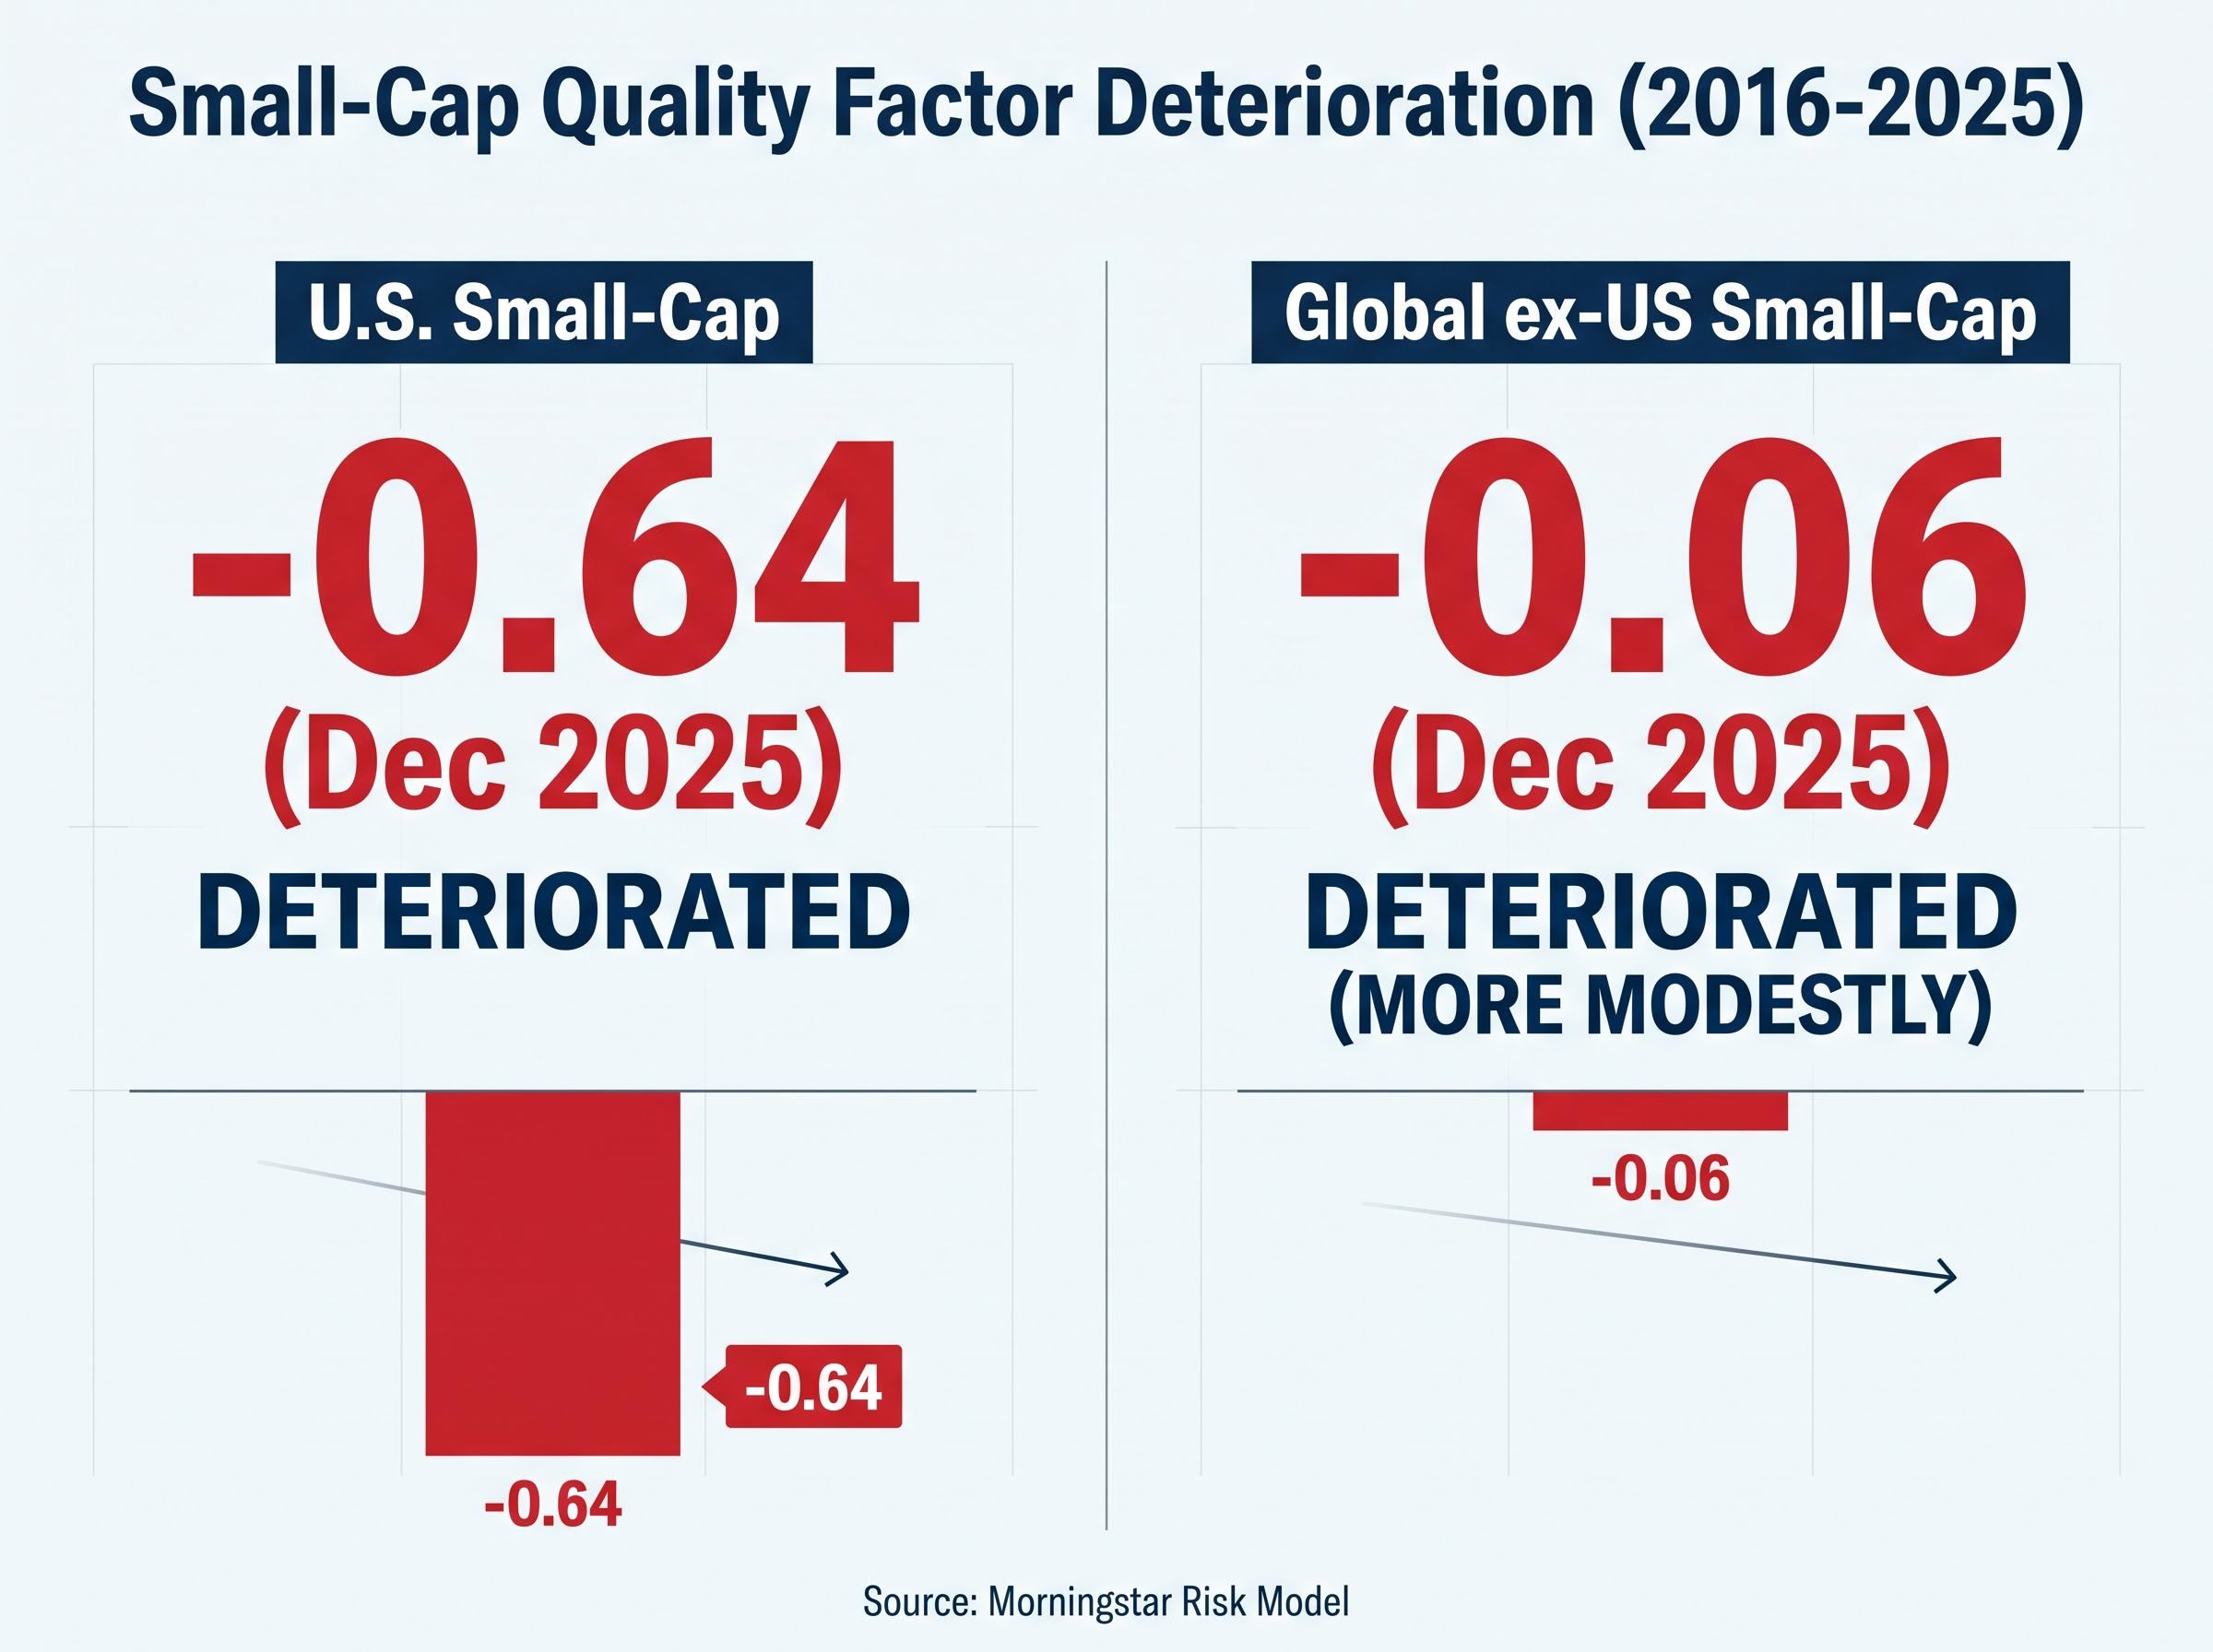
| Region | Quality Factor Score (Dec 2025) | Direction of Change (2016-2025) | Large-Cap Comparison |
|---|---|---|---|
| U.S. | -0.64 | Deteriorated | Improved over same period |
| Global ex-US | -0.06 | Deteriorated (more modestly) | Improved in most regions |
The U.S. figure, -0.64, is not marginal. It represents a meaningful structural tilt toward lower-quality companies baked into broad small-cap index exposure.
AQR’s Cliff Asness and co-authors established that higher-quality small-cap stocks outperform larger-cap stocks, while the broader small-cap premium appears questionable without controlling for quality. Their research, “Size Matters, If You Control Your Junk,” reframed the size premium as quality-dependent rather than size-dependent.
An investor buying a passive small-cap fund is, by the numbers, taking on a quality deficit that has widened over the past decade. The underperformance is not happening despite the fundamentals. It is happening because of them.
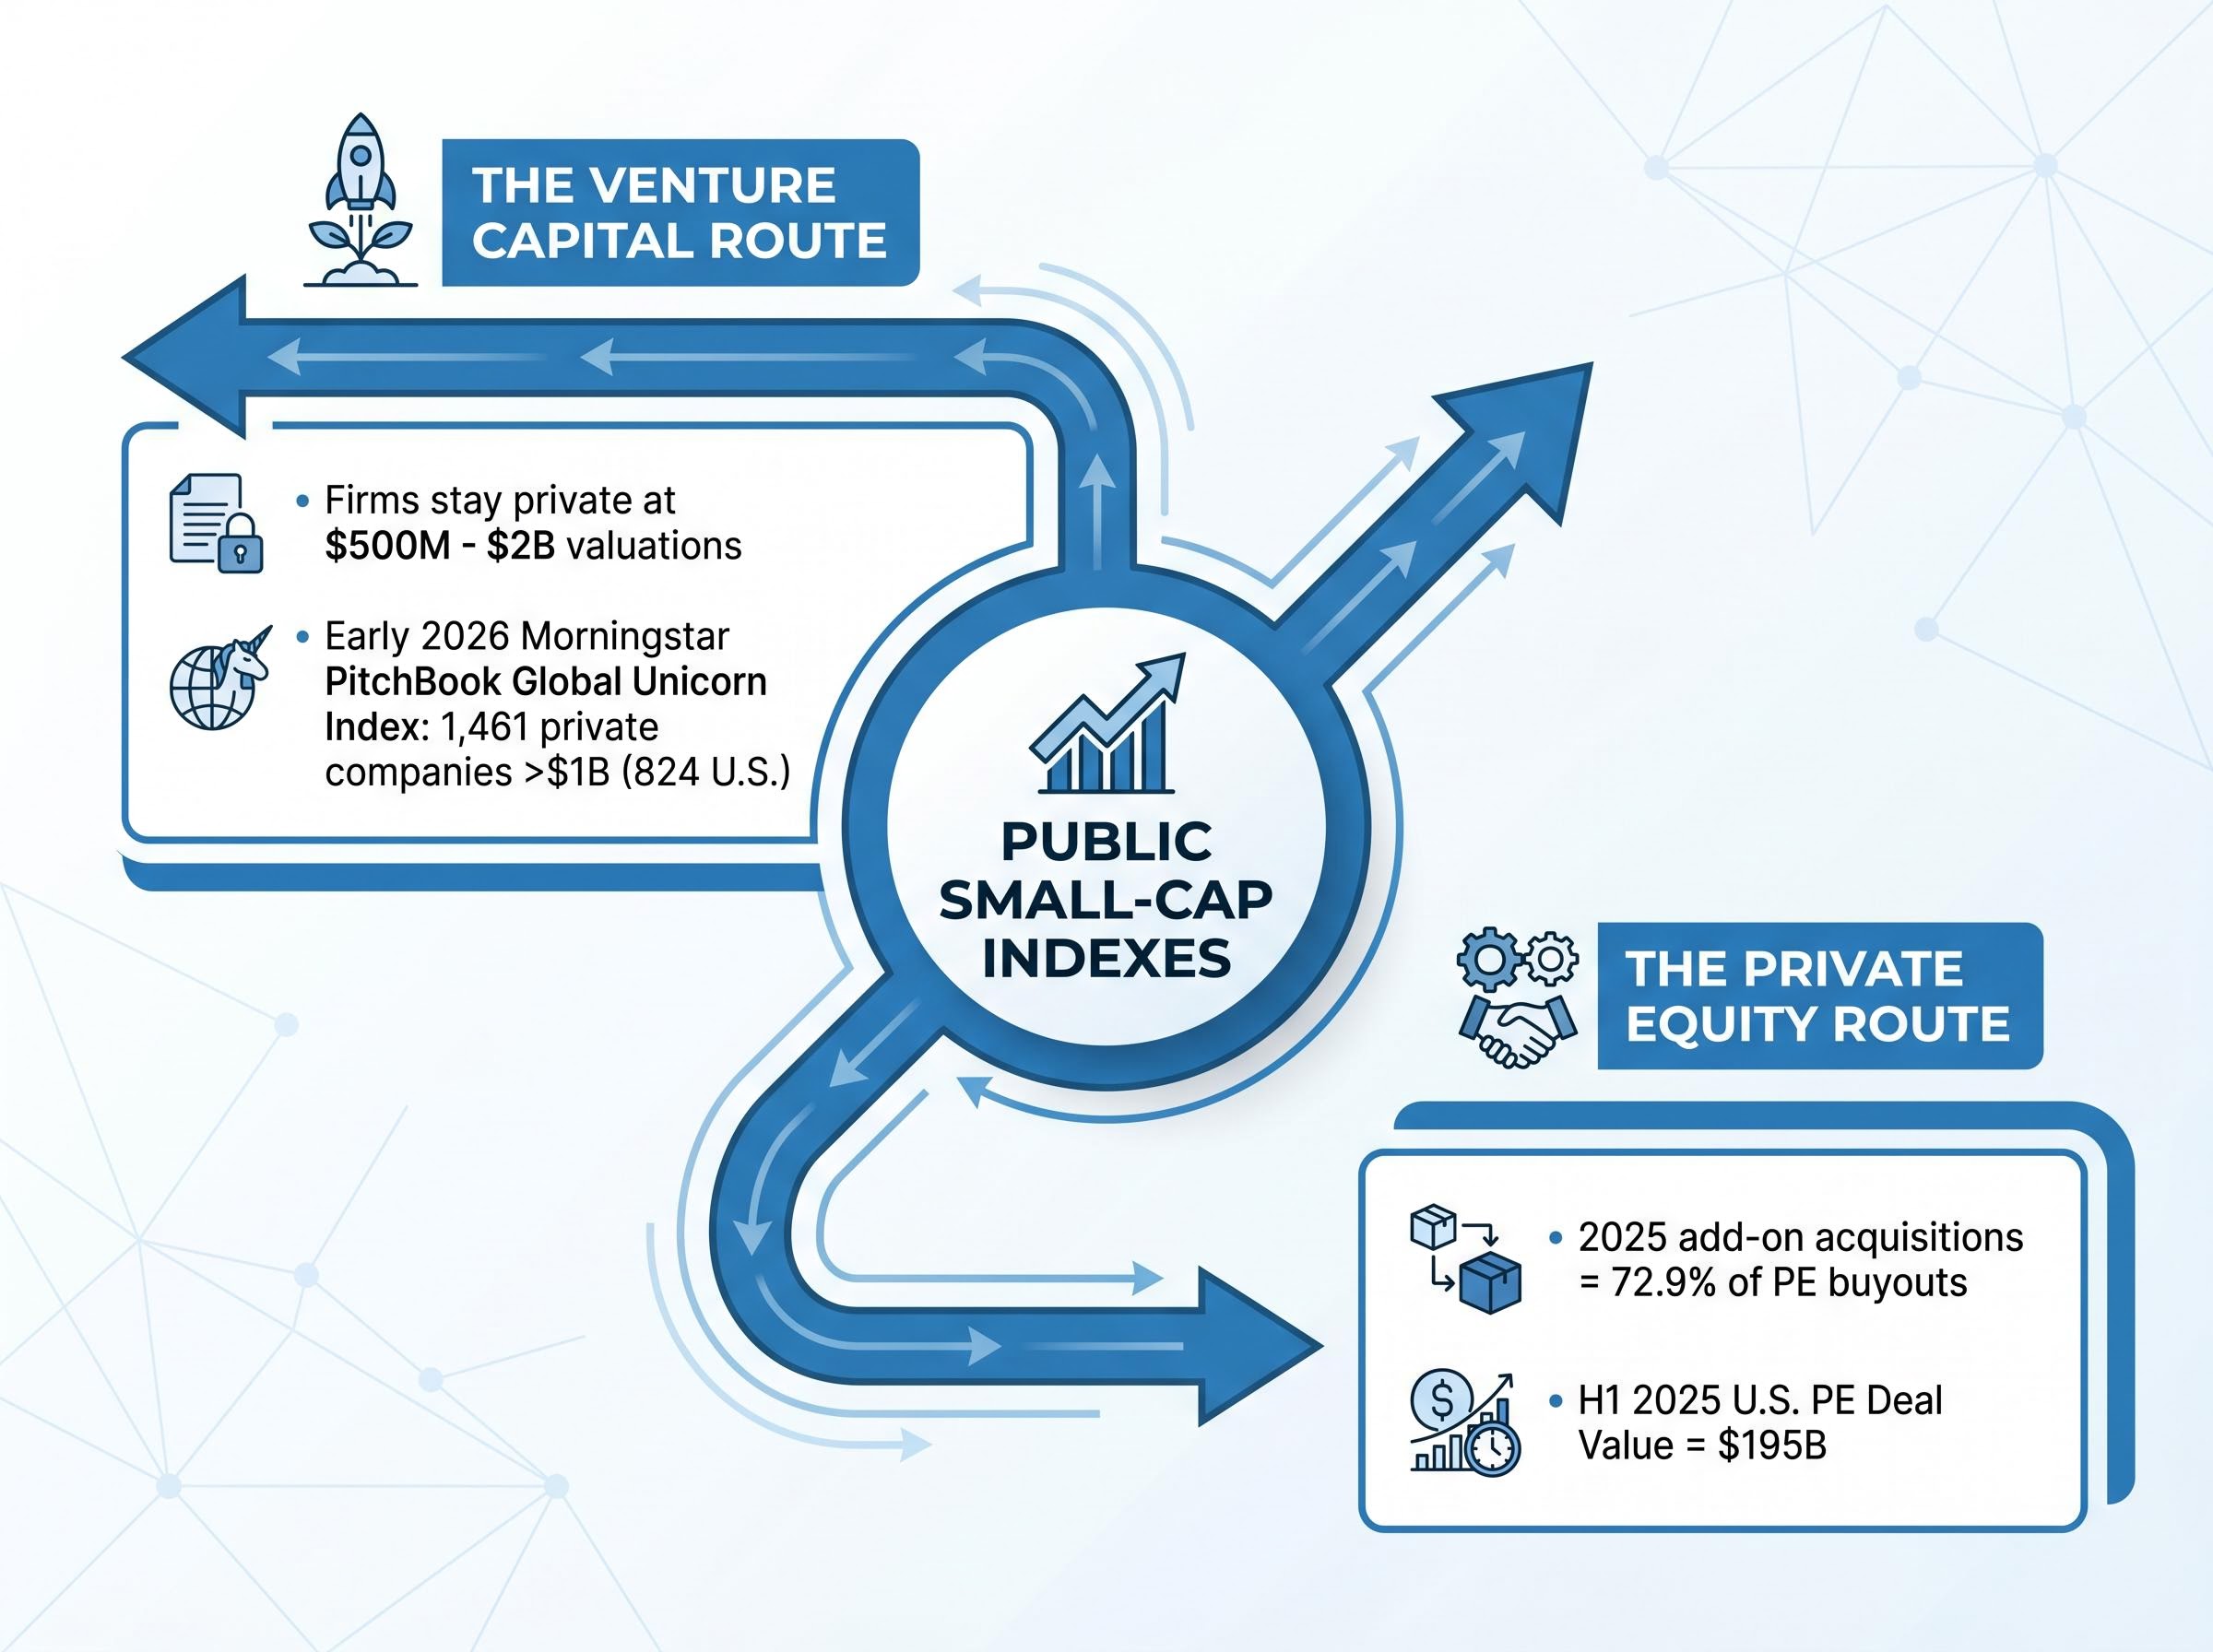
The quality deterioration did not occur in a vacuum. Two channels, both driven by the expansion of private capital, have actively drained higher-quality companies from the public small-cap universe.
Abundant venture capital funding has reduced the incentO for high-quality smaller firms to pursue an initial public offering. Companies that would have listed at $500 million to $2 billion valuations a decade ago now raise private rounds at those levels without the disclosure burden, quarterly scrutiny, or governance requirements of a public listing.
As of early 2026, the Morningstar PitchBook Global Unicorn Index included 1,461 private companies each valued above $1 billion, with 824 based in the U.S. Those are companies that, in a prior era, would have populated public small-cap and mid-cap indexes.
Private equity activity removes quality from the other direction, targeting existing public small-cap companies for platform expansions and bolt-on acquisitions. In 2025, add-on acquisitions accounted for 72.9% of all PE buyouts. Total U.S. PE deal value reached $195 billion in H1 2025 alone.
Morningstar’s Zachary Evens published work linking small-cap quality deterioration and relative underperformance directly to the expansion of private markets. Silvercrest Asset Management referenced 10 years of private equity dominance alongside large-cap equities as context for the erosion.
The mechanism is self-reinforcing. As quality firms choose to stay private or get acquired, the public small-cap universe becomes less attractive, which further reduces the incentive for high-quality firms to list.
Technology was the top-performing global equity sector over the preceding decade. U.S. small-cap portfolios carry meaningfully lighter technology exposure than the broader U.S. market, creating a structural headwind.
Global capital flows in 2026 have reinforced the technology concentration problem for small-cap investors, with the SOXX ETF gaining approximately 40% in April 2026 alone as AI infrastructure spending pulled institutional money toward large-cap semiconductor names that small-cap indexes structurally cannot access.
Internationally, the technology underweight is concentrated in Asia, where large-cap tech is heavily represented in Taiwan, South Korea, China, and Japan. Small-cap indexes in these markets carry a fraction of the tech weighting found in their large-cap equivalents.
| Region | Small-Cap Tech Weight vs Large-Cap | Direction of Relative Exposure | Outperformed Large Caps? |
|---|---|---|---|
| U.S. | Meaningfully lower | Underweight | No |
| Europe/UK | Higher than large-cap equivalent | Overweight | No |
| Asia | Significantly lower | Underweight | No |
The European case is the critical counterexample.
European and UK small-cap universes carry greater technology sector exposure than their respective large-cap counterparts, yet this has not translated into outperformance.
If tech underweight were the primary driver, European small caps should have outperformed. They did not. Sector composition is a real contributor, particularly in the U.S. and Asia, but it cannot carry the full explanatory weight. The quality and compositional issues documented in the research run deeper.
The past decade of broad small-cap underperformance does not refute the size premium. It confirms that the premium was never in the broad index to begin with.
AQR’s “Size Matters, If You Control Your Junk” thesis holds that the size premium is real but concentrated in higher-quality small-cap stocks. Strip out the unprofitable, heavily leveraged, and speculative names, and small caps outperform. Leave them in, as broad indexes do, and the premium disappears into noise.
AQR’s size premium research, authored by Cliff Asness and co-authors including Frazzini, Israel, Moskowitz, and Pedersen, established that small caps outperform when the sample is restricted to higher-quality firms, and that the apparent failure of the size premium in broad indexes is explained by the disproportionate weight of low-quality, speculative names those indexes carry.
The S&P 600 and Russell 2000 divergence offers a practical illustration. The S&P 600 applies profitability screens that exclude the lowest-quality companies. The Russell 2000 does not. StoneX Wealth’s Michael Lytle noted that 2025 was the fourth-worst year for small-cap quality relative to the broader universe since early 2022, with a widened valuation gap between the two indexes.
StoneX Wealth noted 2025 marked the fourth-worst year for small-cap quality relative to the broader universe since early 2022, with a widened valuation gap between the S&P 600 and Russell 2000.
Franklin Templeton/Royce reported that 2025 returns were driven by lower-quality, speculative, and AI-related stocks, including at least one company with a $15 billion market cap and no revenue. Low-quality cycles within small caps have historically averaged approximately 12 months in duration.
The Russell 2000 returned approximately 22.0% versus the S&P 500’s roughly 11.8% from July 2025 through 27 February 2026. That rally was broad and included speculative names, consistent with the early phase of a low-quality cycle.
The size premium is not dead; it is concentrated in a segment that passive broad-index exposure systematically dilutes.
The retrospective diagnosis matters because it shapes how to think about what comes next. As of May 2026, small caps are trading at significant P/E discounts near historical lows relative to large caps, supported by accelerating earnings growth and increased M&A activity.
Aberdeen Investments described U.S. small-cap valuations as “compelling” relative to large caps heading into 2026. European small caps were assessed as having an even wider valuation gap versus European large caps than the U.S. market. AllianceBernstein reported the Russell 2000 returned approximately 22.0% versus the S&P 500’s roughly 11.8% from July 2025 through 27 February 2026, with small-cap earnings growth outpacing large caps per consensus forecasts.
The small-cap rotation thesis has gained institutional momentum in 2026, with small-cap fund flows rising from approximately 8% of total equity inflows in 2025 to roughly 25% in 2026 and major banks including Goldman Sachs, Morgan Stanley, and JPMorgan recommending 10-15% portfolio shifts toward the segment.
Valuation alone has not been sufficient to trigger sustained outperformance in recent years. The quality rotation thesis provides a more specific catalyst: historical patterns show quality leadership tends to follow the initial speculative rally phase, and the 2025-2026 cycle timeline is consistent with a rotation setup. Silvercrest Asset Management expected a transition to quality-driven leadership after an approximately 8-month speculative rally through late 2025, driven by sustainable earnings.
Four practitioner signals point toward quality rotation:
For investors looking to implement the quality-adjusted framework, practitioners point to three screening criteria:
| Metric | What It Measures | Why It Matters for Small Caps |
|---|---|---|
| Return on Equity (ROE) | Profitability relative to shareholder capital | Filters out unprofitable firms that dilute broad index returns |
| Return on Invested Capital (ROIC) | Efficiency of total capital deployment | Identifies companies generating real economic value, not just revenue |
| Financial Leverage / Balance Sheet Strength | Debt levels relative to equity and cash flow | Screens out companies most vulnerable to rate sensitivity and refinancing risk |
Low-quality cycles have historically averaged approximately 12 months, and the data as of mid-2026 suggests a rotation toward quality leadership may already be underway.
Past performance does not guarantee future results. Financial projections are subject to market conditions and various risk factors.
Broad passive small-cap exposure embeds a structural quality deficit that is not a temporary market condition. It is the product of three interlocking forces: compositional deterioration within public indexes, a private capital ecosystem that actively drains the highest-quality firms from public markets, and a technology sector underweight that varies by region but compounds the drag in the U.S. and Asia.
The decade of underperformance is real. It is also the wrong frame for evaluating the size premium. The premium exists in the quality-adjusted segment of the small-cap universe, not in the broad index. Index selection and quality screening matter more than the macro call for investors considering the asset class.
For those who have avoided small caps after a decade of lagging returns, the question is not whether small caps will outperform. It is which small caps, and through which index construction, the exposure is taken.
This article is for informational purposes only and should not be considered financial advice. Investors should conduct their own research and consult with financial professionals before making investment decisions.
Small cap underperformance refers to the sustained lag of small-cap equities behind large-cap peers across most major global markets. Research through 2025-2026 attributes this primarily to a structural deterioration in the quality of companies within small-cap indexes, not just interest rates or macro conditions.
The quality factor measures profitability, financial leverage, and balance sheet strength. U.S. small-cap indexes carried a quality factor score of -0.64 as of December 2025, meaning broad passive exposure systematically tilts investors toward lower-quality, less profitable companies that drag down returns.
Private capital drains quality from the public small-cap universe through two channels: venture capital funding keeps high-quality smaller firms private longer, while private equity buyouts remove the best-performing public small caps from indexes, leaving a less profitable residual universe.
The S&P 600 applies profitability screens that exclude the lowest-quality companies, while the Russell 2000 does not, resulting in materially different quality exposures and return profiles over time.
Practitioners highlight three key metrics: return on equity (ROE) to filter unprofitable firms, return on invested capital (ROIC) to identify companies generating real economic value, and financial leverage ratios to screen out companies most vulnerable to rate sensitivity and refinancing risk.