
Barclays Flags Structural Bond Reset With 4.65% Yield Call
54 mins ago

Growth stocks are trading at a 21% discount to fair value, a valuation gap that has occurred less than 5% of the time since 2011, according to Morningstar data. The Q1 2026 selloff, amplified by the US-Iran conflict and persistent AI disruption fears in the software sector, pushed growth and technology equities to discounts not seen since the 2022 market bottom. At the same time, mega-cap earnings reported on 29-30 April came in broadly strong, creating a tension between compelling valuations and unresolved macro risks.
What follows is an examination of what the 21% discount number actually means, why it got there, what the historical precedents suggest, and what conditions would need to materialise before a rotation into growth equities can be made with conviction rather than hope.
Morningstar’s price-to-fair-value ratio compares a stock’s current market price to an analyst-derived intrinsic value estimate, calculated through discounted cash flow models across more than 700 US-listed equities. A reading below 1.0 means the market is pricing a stock, or a category, below what fundamental analysis suggests it is worth.
Morningstar’s price-to-fair-value ratio compares a stock’s current market price to an analyst-derived intrinsic value estimate, calculated through discounted cash flow models across more than 700 US-listed equities, a process detailed in the Morningstar equity research methodology, which formalises how fair value estimates, economic moat ratings, and uncertainty adjustments combine to produce the Star Rating system underlying these discount calculations.
As of 23 March 2026, the growth style box carried an implied price-to-fair-value of 0.79, meaning the average growth stock traded at 21% below its estimated intrinsic value. The broader US market sat at 0.88 (a 12% discount) on the same date. Technology, which dominates the growth category, showed an even steeper 23% discount.
Historical rarity: A discount of this magnitude in the growth style box has occurred less than 5% of the time since 2011. The only comparable episodes were the 2022 market bottom and the 2011 European sovereign debt crisis.
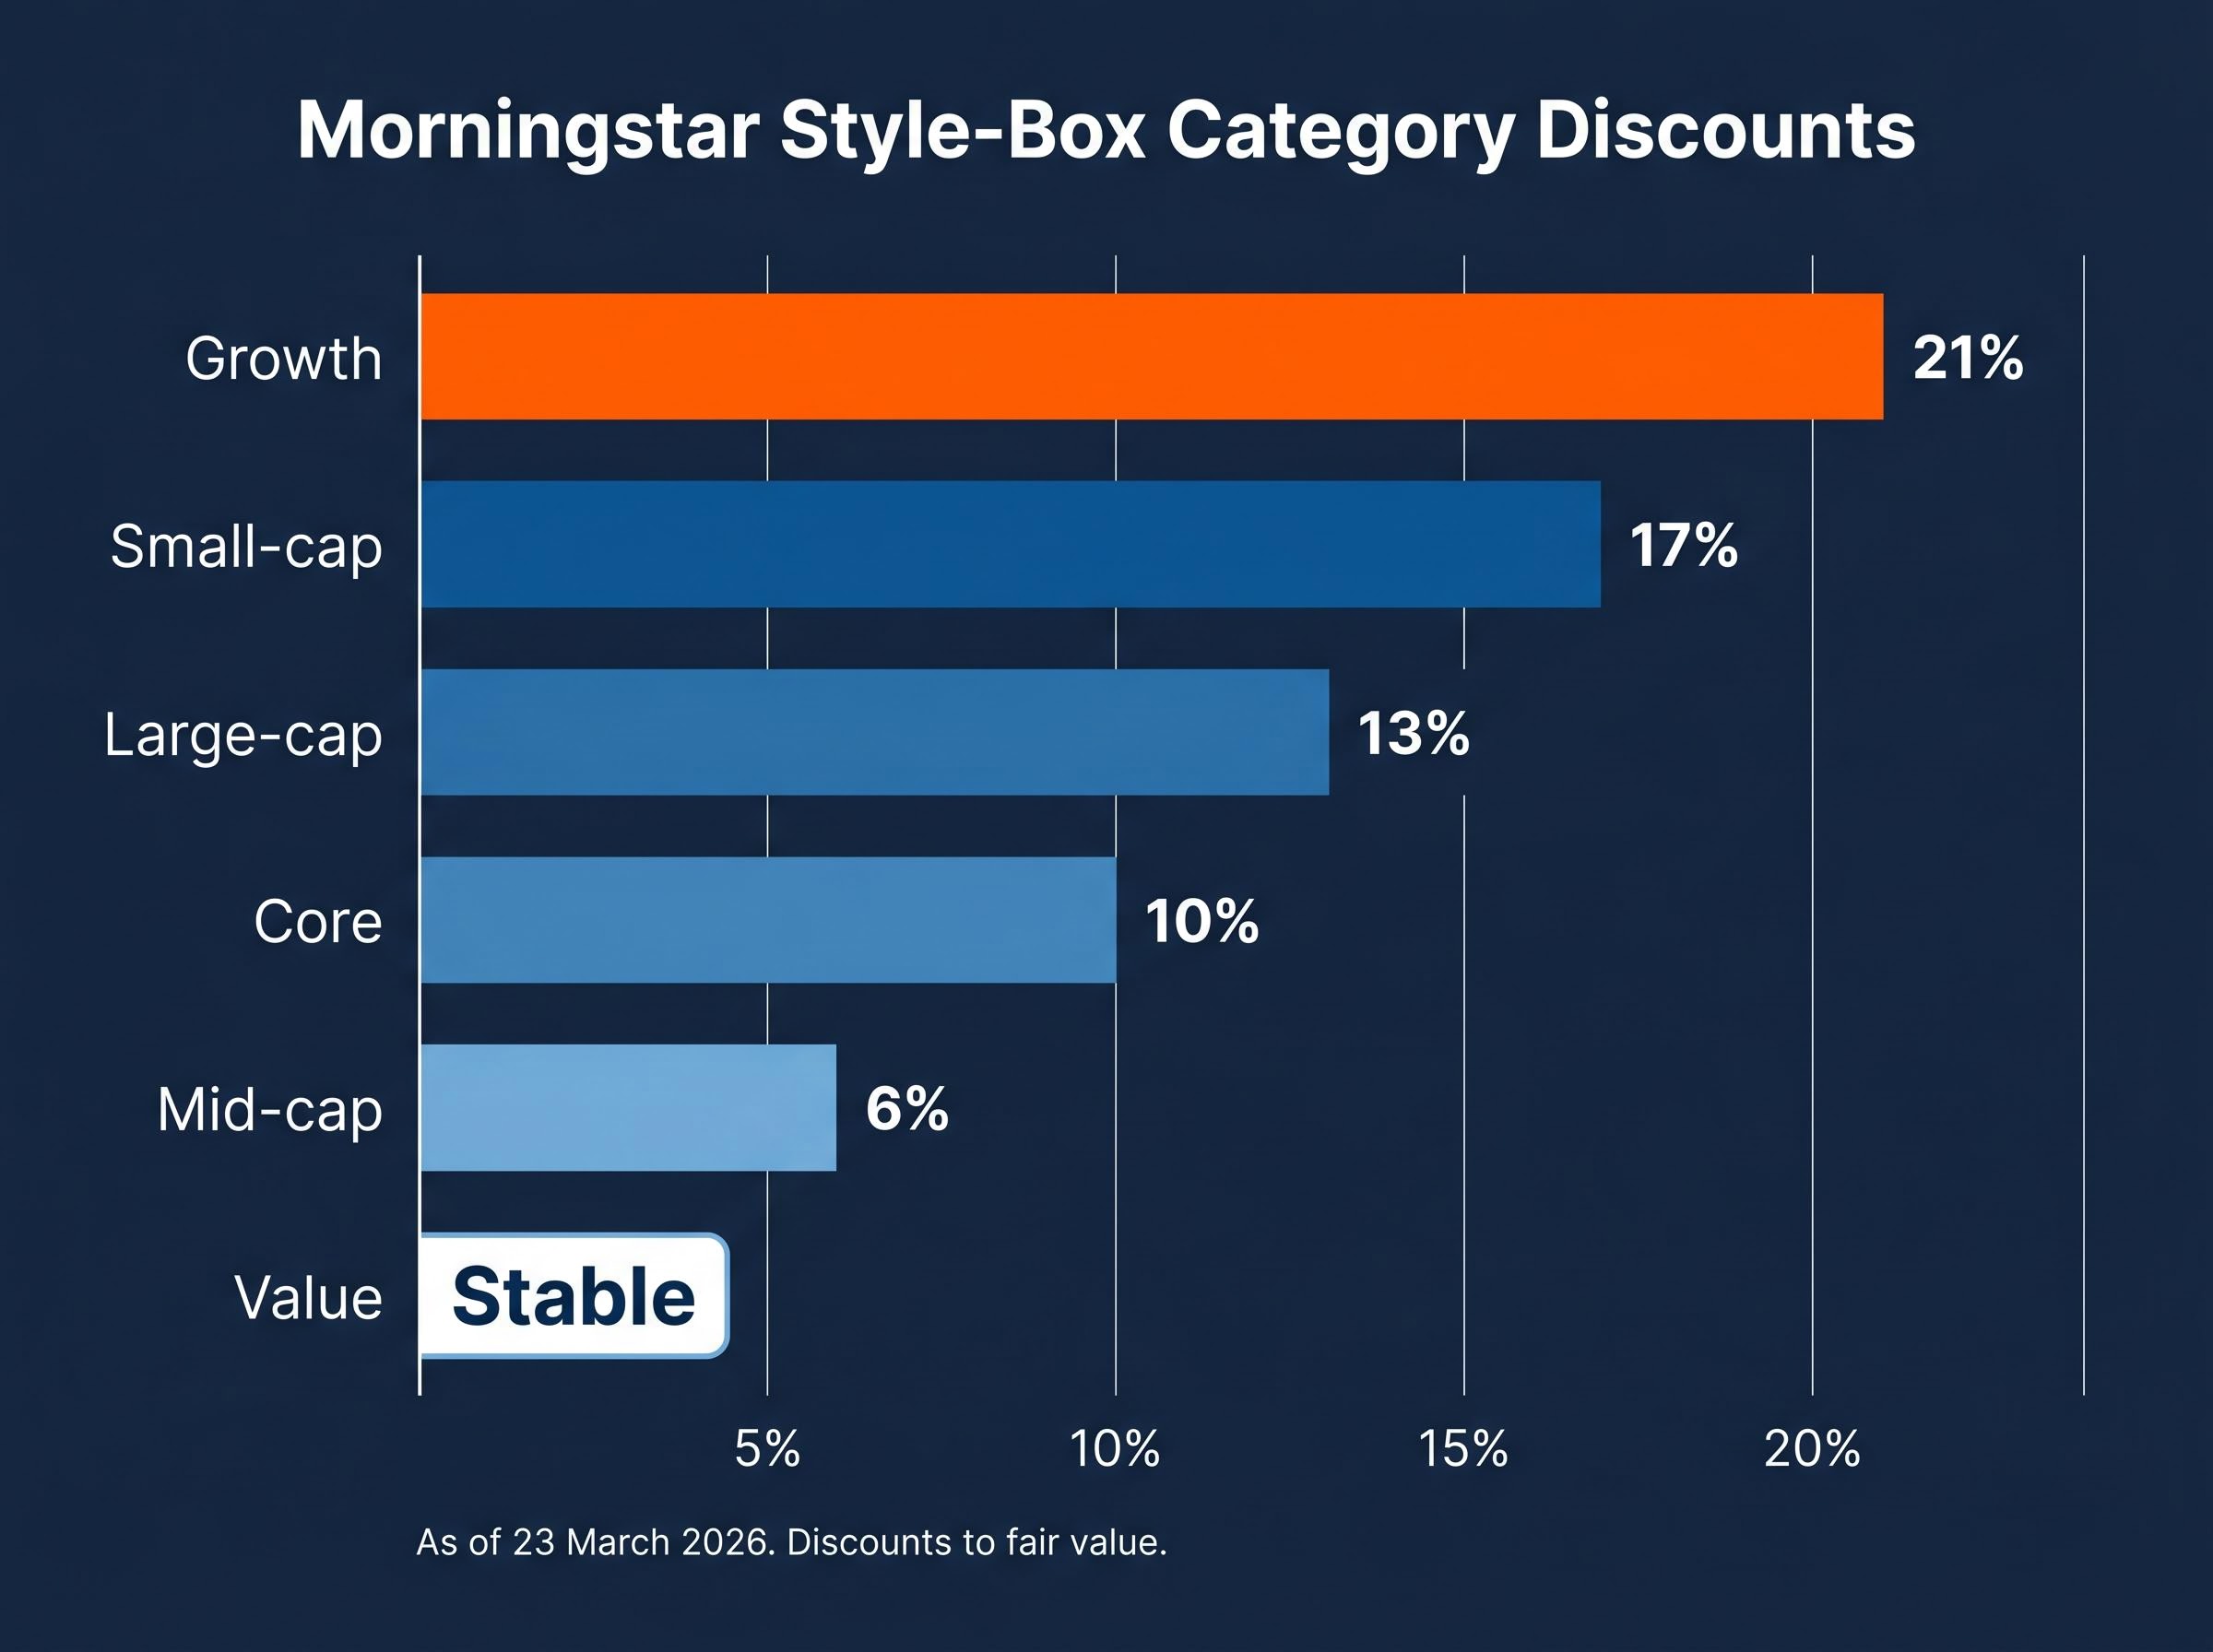
The following table shows how discounts varied across Morningstar’s style-box categories at the time of measurement:
| Style-Box Category | Discount to Fair Value |
|---|---|
| Growth | 21% |
| Small-cap | 17% |
| Large-cap | 13% |
| Core | 10% |
| Mid-cap | 6% |
| Value | Stable |
The dispersion is significant. Growth equities are carrying more than double the discount of mid-cap stocks and roughly triple that of value names, a gap that reflects a selloff concentrated in specific sectors rather than broad market weakness.
Technology equities represented approximately 42% of the growth category’s composition entering 2026. That weighting made the sector both the engine of the category’s prior outperformance and the primary source of its Q1 losses.
The names that drove the drawdown were not obscure. The largest growth-category detractors included:
In the large-cap space, Microsoft, Apple, Nvidia, Amazon, and Tesla bore disproportionate weight. Microsoft’s decline alone accounted for approximately 38% of the total core category loss, a figure that illustrates how a single name’s weighting can define an entire style box’s performance.
The Nasdaq fell 2.38% on 26 March alone. The S&P 500 declined approximately 6.8% through March 2026. Yet during the same period, analyst fair value estimates for several of these technology names were revised upward, which had the effect of widening the discount further as prices fell while estimated intrinsic values rose.
The same index-weighting dynamics that amplified returns in 2023 and 2024 mechanically amplified losses when those heavily weighted names sold off. A 42% technology weighting in the growth category means that a 15% decline in tech equities produces roughly a 6.3% hit to the category before any other holdings are counted.
The AI hardware and software divergence running through 2026 has been so extreme that semiconductor equipment indices gained over 47% year-to-date while software application indices fell nearly 23%, a spread of more than 70 percentage points that explains why the growth category’s technology weighting simultaneously created winners and accelerated the sector’s overall discount.
Mid-cap equities outperformed during the same period precisely because they carried lower mega-cap technology exposure and benefited from energy and AI hardware holdings. The concentration effect, in other words, was not a market-wide phenomenon. It was a structural feature of how the growth category is composed.
A price-to-fair-value ratio below 1.0 indicates that a stock is trading below its analyst-estimated intrinsic value. Unlike trailing price-to-earnings ratios, which look backward at reported earnings, the fair value estimate is constructed from forward-looking discounted cash flow models. These models incorporate expected revenue growth, margin trajectories, and capital allocation over multi-year forecast horizons.
Morningstar’s fair value estimates are built on discounted cash flow models that project revenue growth, margin trajectories, and capital allocation across multi-year horizons, a methodology that differs structurally from trailing price-to-earnings ratios because it prices future earning power rather than historical results.
In practice, the ratio translates directly into an implied discount. A reading of 0.62 for Microsoft means the stock trades at 38% below its estimated fair value. A reading of 0.31 for Klarna Group or Atlassian implies a 69% discount.
The current environment provides a range of examples across the technology and growth universe:
| Company | Sector | Price-to-Fair-Value | Implied Discount |
|---|---|---|---|
| Klarna Group | Fintech | 0.31 | 69% |
| Atlassian | Software | 0.31 | 69% |
| Fiserv | Financial Technology | 0.44 | 56% |
| Salesforce | Software | 4-5 star territory | >40% |
| Microsoft | Software / Cloud | 0.62 | 38% |
| Adobe | Software | ~0.668 | ~33% |
Morningstar analyst Dave Sekera has characterised Salesforce at its current discount as sitting in 4-5 star buy territory ahead of a potential growth rebound.
A low price-to-fair-value ratio does not, however, constitute a buy signal on its own. The ratio measures the magnitude of the discount, not the timing of the recovery. Discounts can persist or widen further if the conditions that created them remain unresolved.
The valuation case for growth equities is clear on the numbers. The complication is that three distinct macro risk channels are actively working against the recovery.
The April 29 FOMC dissent, where four committee members publicly split on the rate hold decision in the broadest internal fracture in over 30 years, illustrates how far the Fed’s hands are tied: PCE inflation running at 3.5% against a 2% target while unemployment rises to 4.3% creates a dual-mandate conflict that interest rate tools are structurally unable to resolve simultaneously.
Morningstar research has characterised the current environment as carrying stagflationary risk, where elevated energy costs simultaneously constrain growth and prevent the monetary policy accommodation that high-duration assets like growth stocks typically require to re-rate.
The energy sector’s 34% advance through 23 March 2026 captures the scale of the geopolitical shock. Capital has flowed into the beneficiaries of the disruption, not away from risk entirely, which is why the growth discount has widened while the broader market discount remains more moderate.
The 29-30 April mega-cap earnings reports provided a genuine counterforce to the macro headwinds. AI-driven revenue growth is now materialising in reported numbers rather than remaining a forward promise.
The key results across the largest growth names:
Earnings growth projections of approximately 14-16% remain intact for the broader market despite the Q1 drawdown, according to available estimates.
Strong reported results prompt analyst model updates. When actual revenue and margins exceed the assumptions embedded in fair value estimates, analysts revise those estimates upward, which widens the gap between the new (higher) fair value and the current (depressed) price.
Several technology fair value estimates were already revised upward during Q1 even as prices fell, widening the discount from both directions. A second round of upward revisions following these earnings beats could amplify that dynamic further. Morningstar senior analyst Dan Romanoff has pointed to long-term AI and cloud tailwinds in software as supporting the case for sustained fair value expansion despite near-term disruption fears.
The tension is genuine. Strong earnings support the rotation thesis on fundamentals, but geopolitical resolution or Fed signalling would be additional conditions needed to close the discount fully.
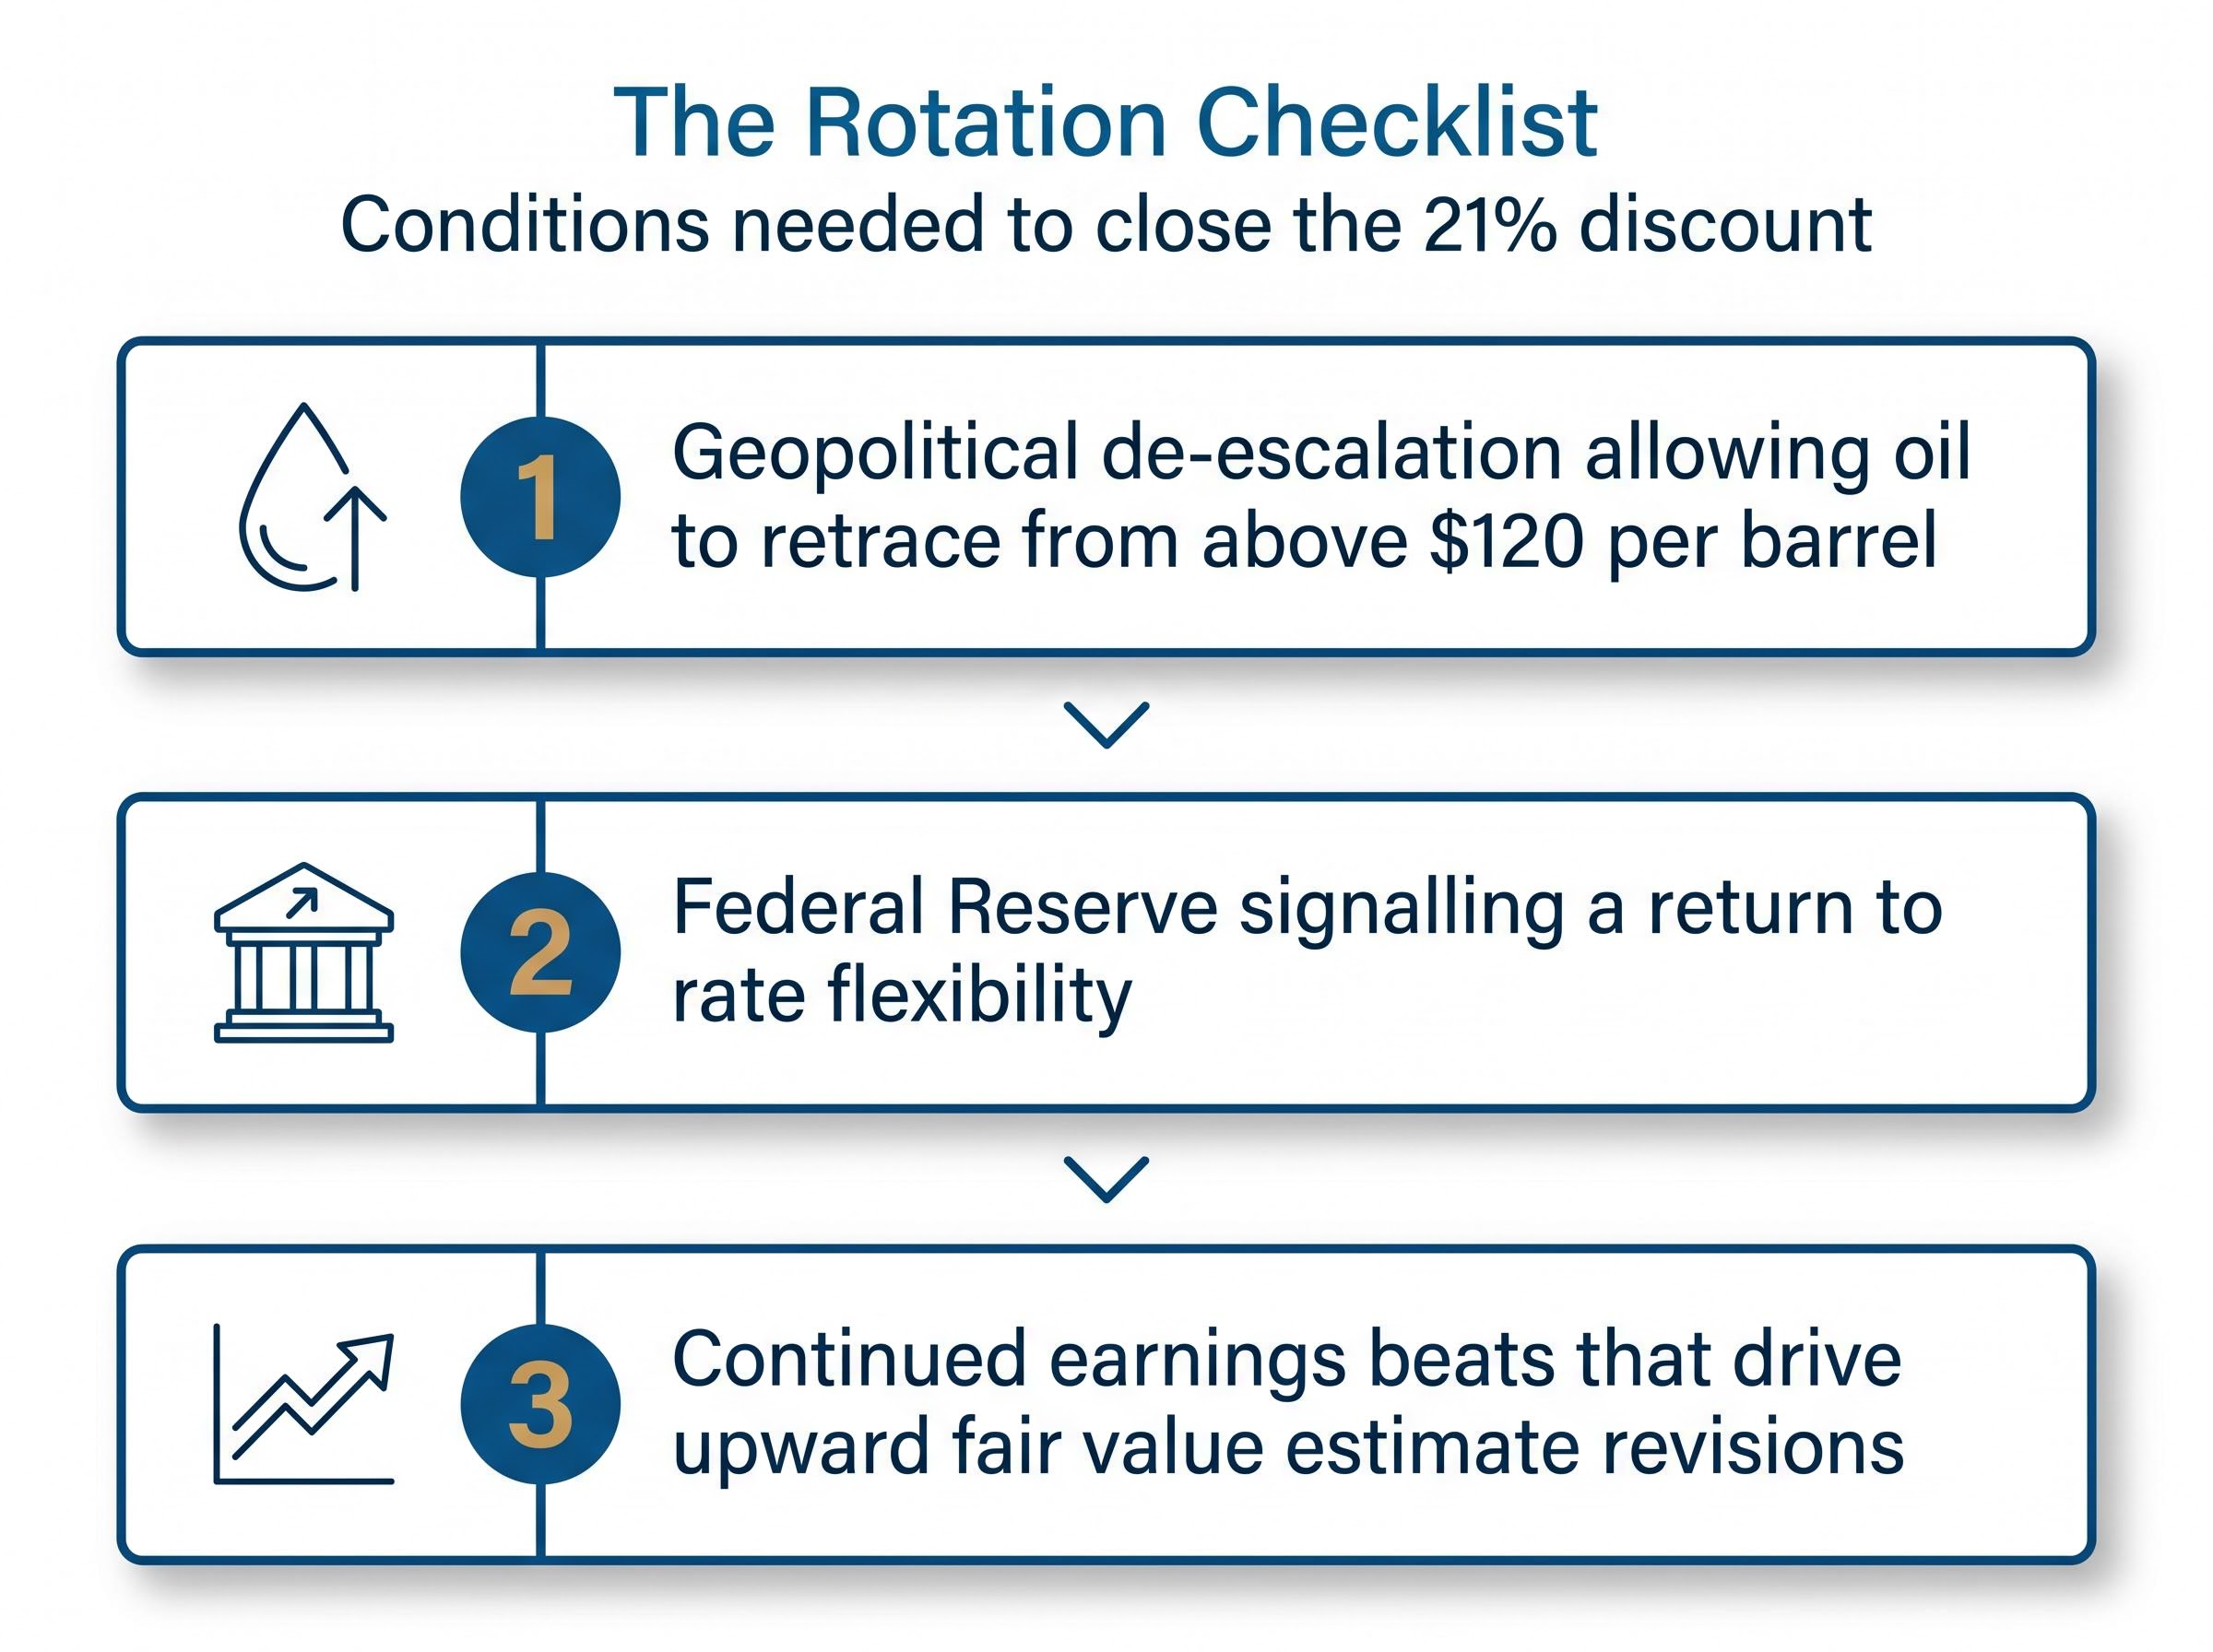
Converting the preceding analysis into a practical framework, three conditions would need to materialise for the 21% discount to close in a sustained way:
Morningstar has recommended harvesting profits from the energy sector, which shifted from undervalued to the most overvalued sector after its 34% advance in 2026, and redeploying capital into oversold growth equities. The prior barbell structure of AI/tech combined with high-quality value is now considered ripe for rebalancing.
A risk-calibrated approach matters here. Partial rotation, rather than a full reallocation, acknowledges that discounts can persist or widen further before they close. If oil remains elevated through Q2 earnings, corporate guidance may disappoint even if Q1 results beat. Monitoring guidance language as earnings season continues (which began 13 April 2026) is the near-term signal to watch.
Small-cap equities, trading at a 17% discount entering 2026, represent the most attractively priced segment outside of growth for investors considering relative positioning decisions.
A sub-5% historical frequency discount combined with strong Q1 earnings and a specific set of identifiable conditions creates a materially different risk-reward environment than a typical growth stock pullback. The valuation case is supported by data, not sentiment.
The honest uncertainty remains: geopolitical resolution timelines cannot be forecast with precision, and the Fed’s hands are tied by energy-driven inflation until the oil market provides relief. These are not risks that valuation alone can offset.
The practical framework is straightforward. Monitor the three macro conditions: oil prices, Fed signalling, and earnings guidance. Use the price-to-fair-value framework to track individual name discounts as analyst models update. Size any rotation to reflect the uncertainty rather than the valuation alone.
Investors weighing the risk-reward case for partial rotation will find our deep-dive into the gasoline price signal, which documents the 44 weeks since 1993 when US gasoline surpassed $4.00 per gallon and the average 11% S&P 500 decline that followed each instance, a historical base rate that sits in direct tension with the 21% discount thesis and should inform position sizing decisions.
This article is for informational purposes only and should not be considered financial advice. Investors should conduct their own research and consult with financial professionals before making investment decisions. Past performance does not guarantee future results. Financial projections are subject to market conditions and various risk factors.
A 21% discount to fair value means the average growth stock is priced at 79 cents for every dollar of analyst-estimated intrinsic value, based on Morningstar's discounted cash flow models across more than 700 US-listed equities. This level has occurred less than 5% of the time since 2011, making it a historically rare valuation reading.
The price-to-fair-value ratio compares a stock's current market price to an analyst-derived intrinsic value estimate built from forward-looking discounted cash flow models that incorporate expected revenue growth, margin trajectories, and capital allocation. A reading below 1.0 means the stock is trading below its estimated intrinsic value, with the implied discount equal to one minus the ratio.
The Q1 2026 selloff was driven by the US-Iran conflict and closure of the Strait of Hormuz pushing Brent Crude above $120 per barrel, persistent AI disruption fears weighing on software names, and the mechanical amplification of losses caused by the growth category's roughly 42% technology weighting. The S&P 500 declined approximately 6.8% through March 2026, with concentrated losses in mega-cap names like Nvidia, Meta, and Microsoft.
According to the article's rotation framework, three conditions are required: geopolitical de-escalation that allows oil to retrace from above $120 per barrel, Federal Reserve signalling of a return to rate flexibility, and continued earnings beats that drive upward fair value estimate revisions. All three conditions remain unresolved as of the article's publication date.
The 29-30 April earnings reports from Meta, Microsoft, Amazon, Alphabet, and Nvidia came in broadly strong, with Meta advertising revenue growing approximately 30% and Nvidia guiding for around $43 billion in Q1 fiscal 2026 revenue. These results support upward fair value estimate revisions, which could widen the discount further from the fundamentals side even as prices remain depressed.


