Fed Holds at 3.75% as Warsh’s First Press Conference Begins
3 hrs ago
In 2026, owning the wrong half of the technology sector has cost investors roughly 30 cents on every dollar. Owning the right half has more than tripled it in some cases. The S&P 500 is up approximately 4.24% year-to-date through late April 2026, and the Nasdaq has gained 6.16%. Those headline numbers flatter a market that is doing two radically different things at once. Beneath the surface, the gap between AI infrastructure beneficiaries and AI-threatened software incumbents has become one of the widest sector-level divergences in recent memory, making the index return nearly meaningless as a guide to what is actually happening inside technology. What follows maps the specific AI stock winners and losers of this divide, names the companies behind each move, explains the structural logic driving the divergence, and frames what it signals for investors assessing where AI’s economic benefits actually accrue.
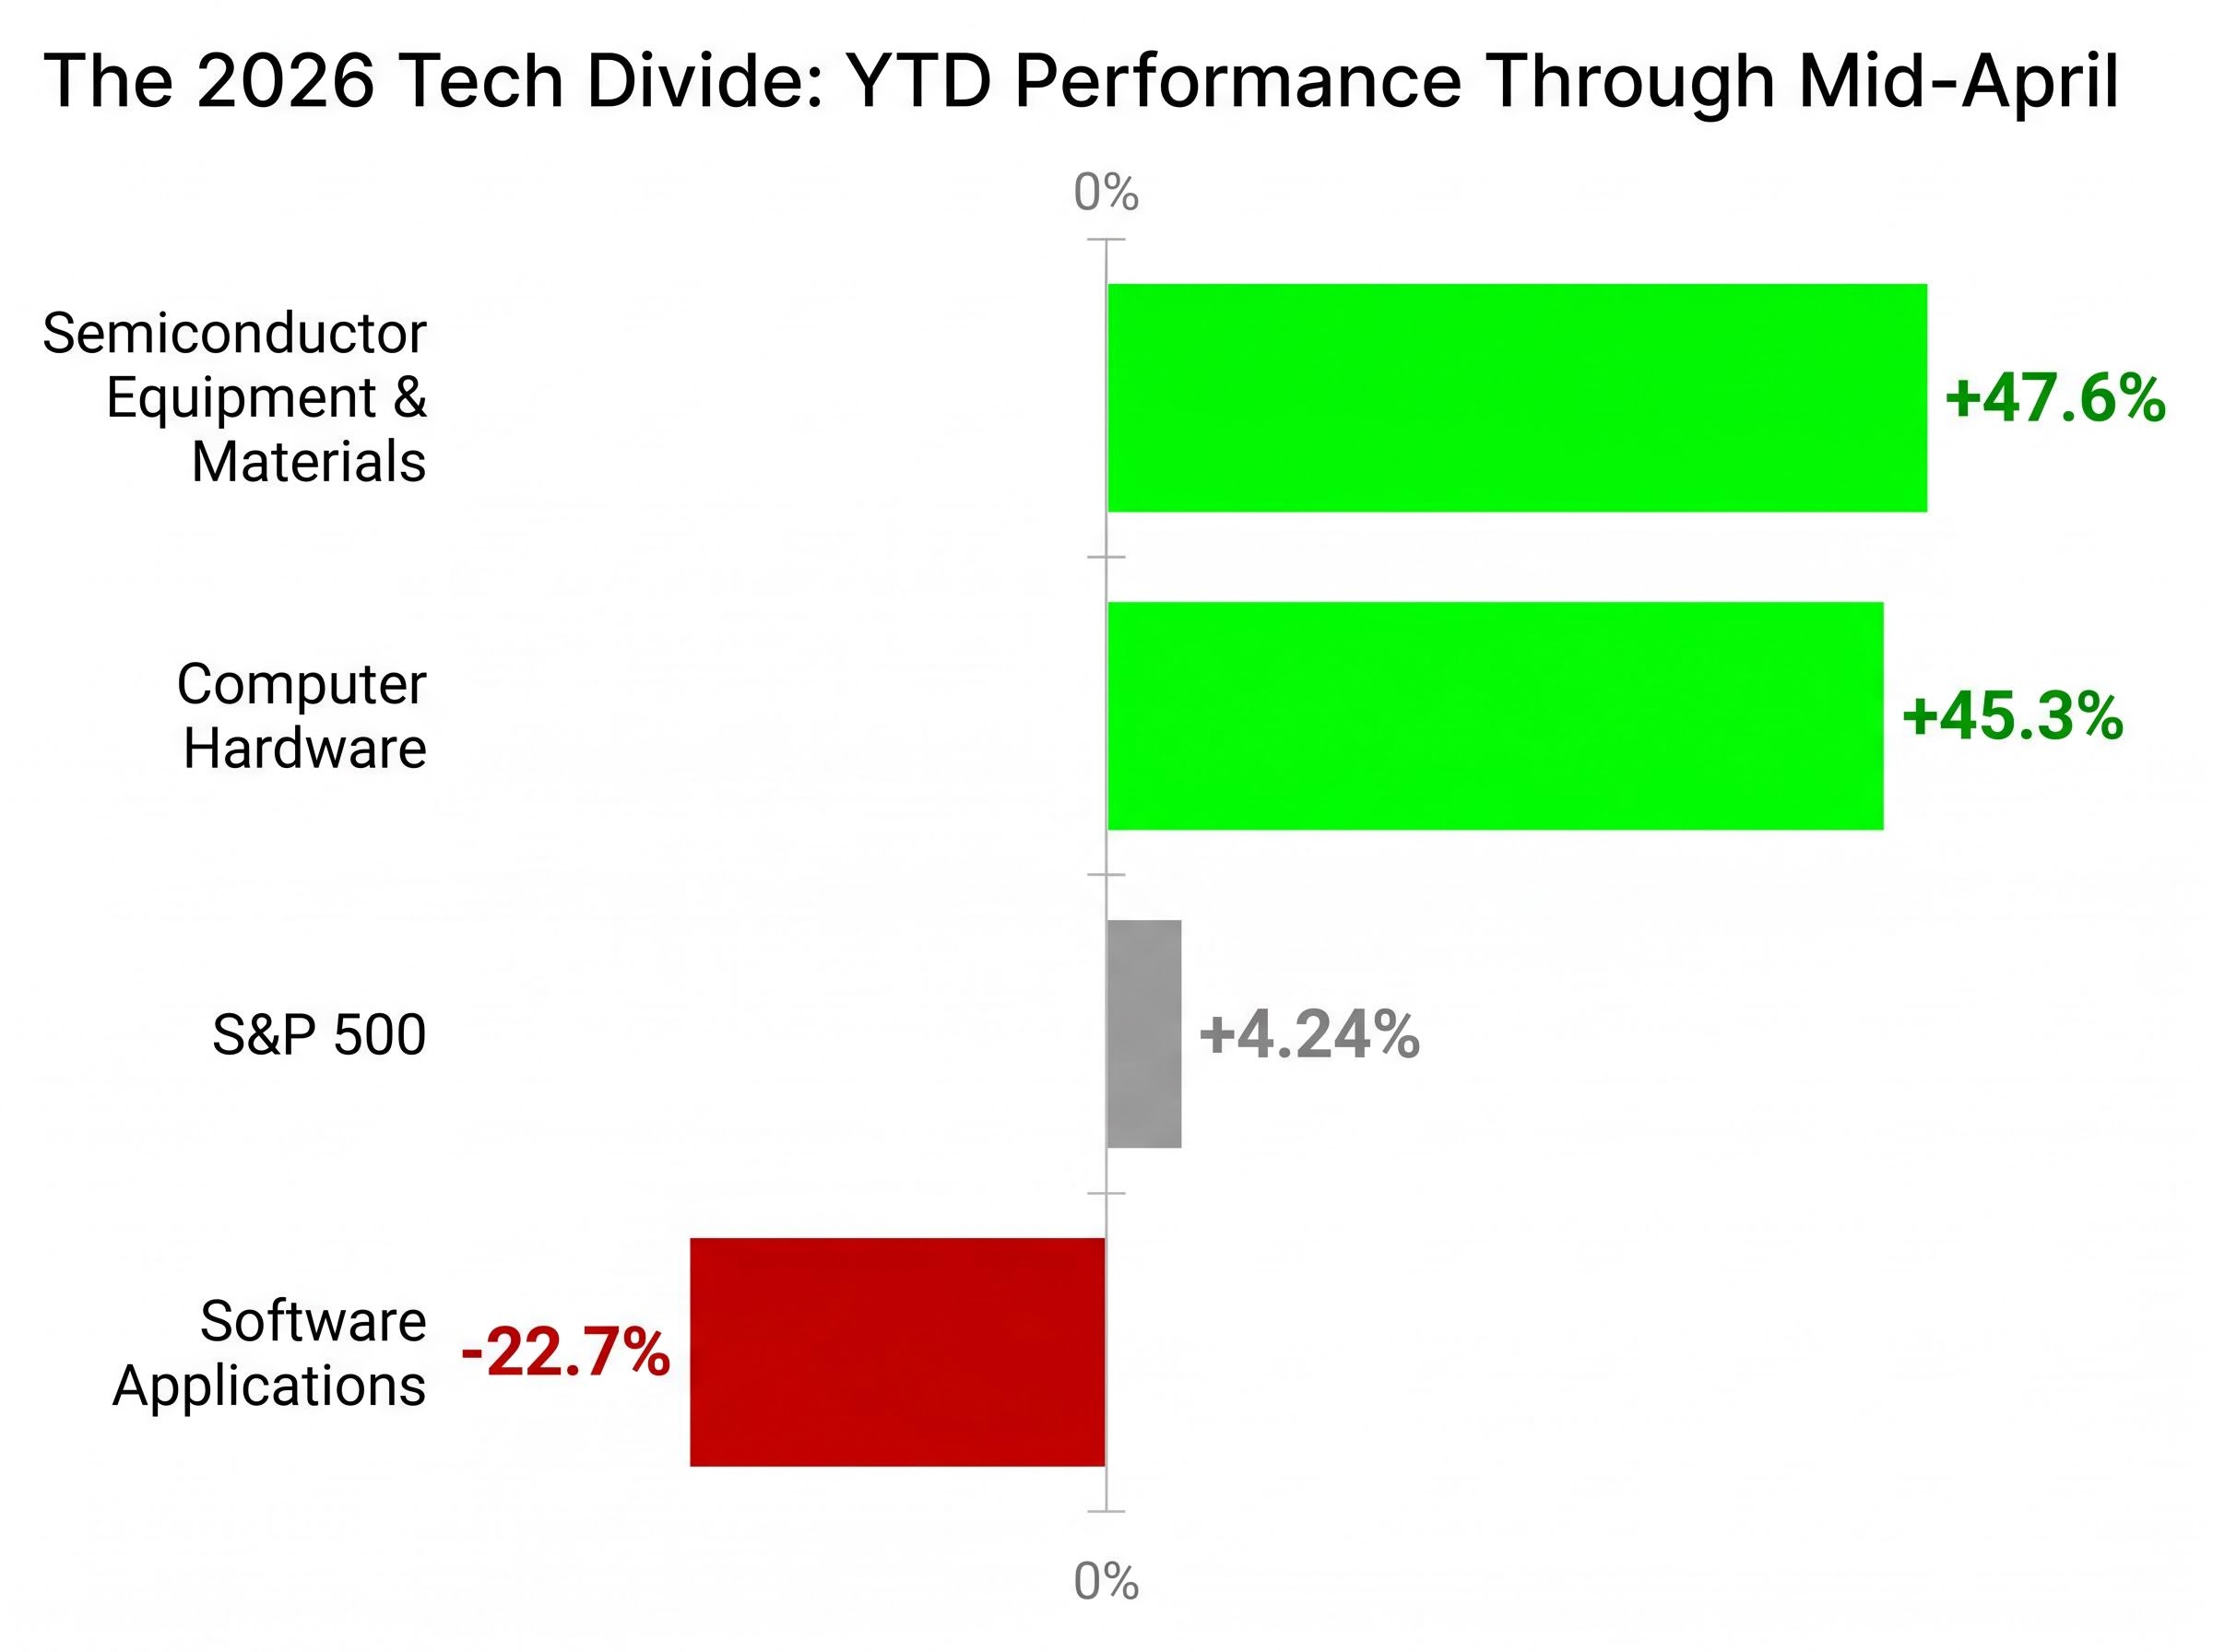
The numbers tell the story before any explanation is needed. Through mid-April 2026, the Morningstar Global Semiconductor Equipment and Materials index has gained 47.6% year-to-date. The Morningstar Global Computer Hardware index is up 45.3%. The Morningstar Global Software Applications index has fallen 22.7%.
The Semiconductor Equipment index’s 47.6% year-to-date gain is not a single-stock anomaly. It reflects a sector-wide repricing of where AI’s economic value concentrates.
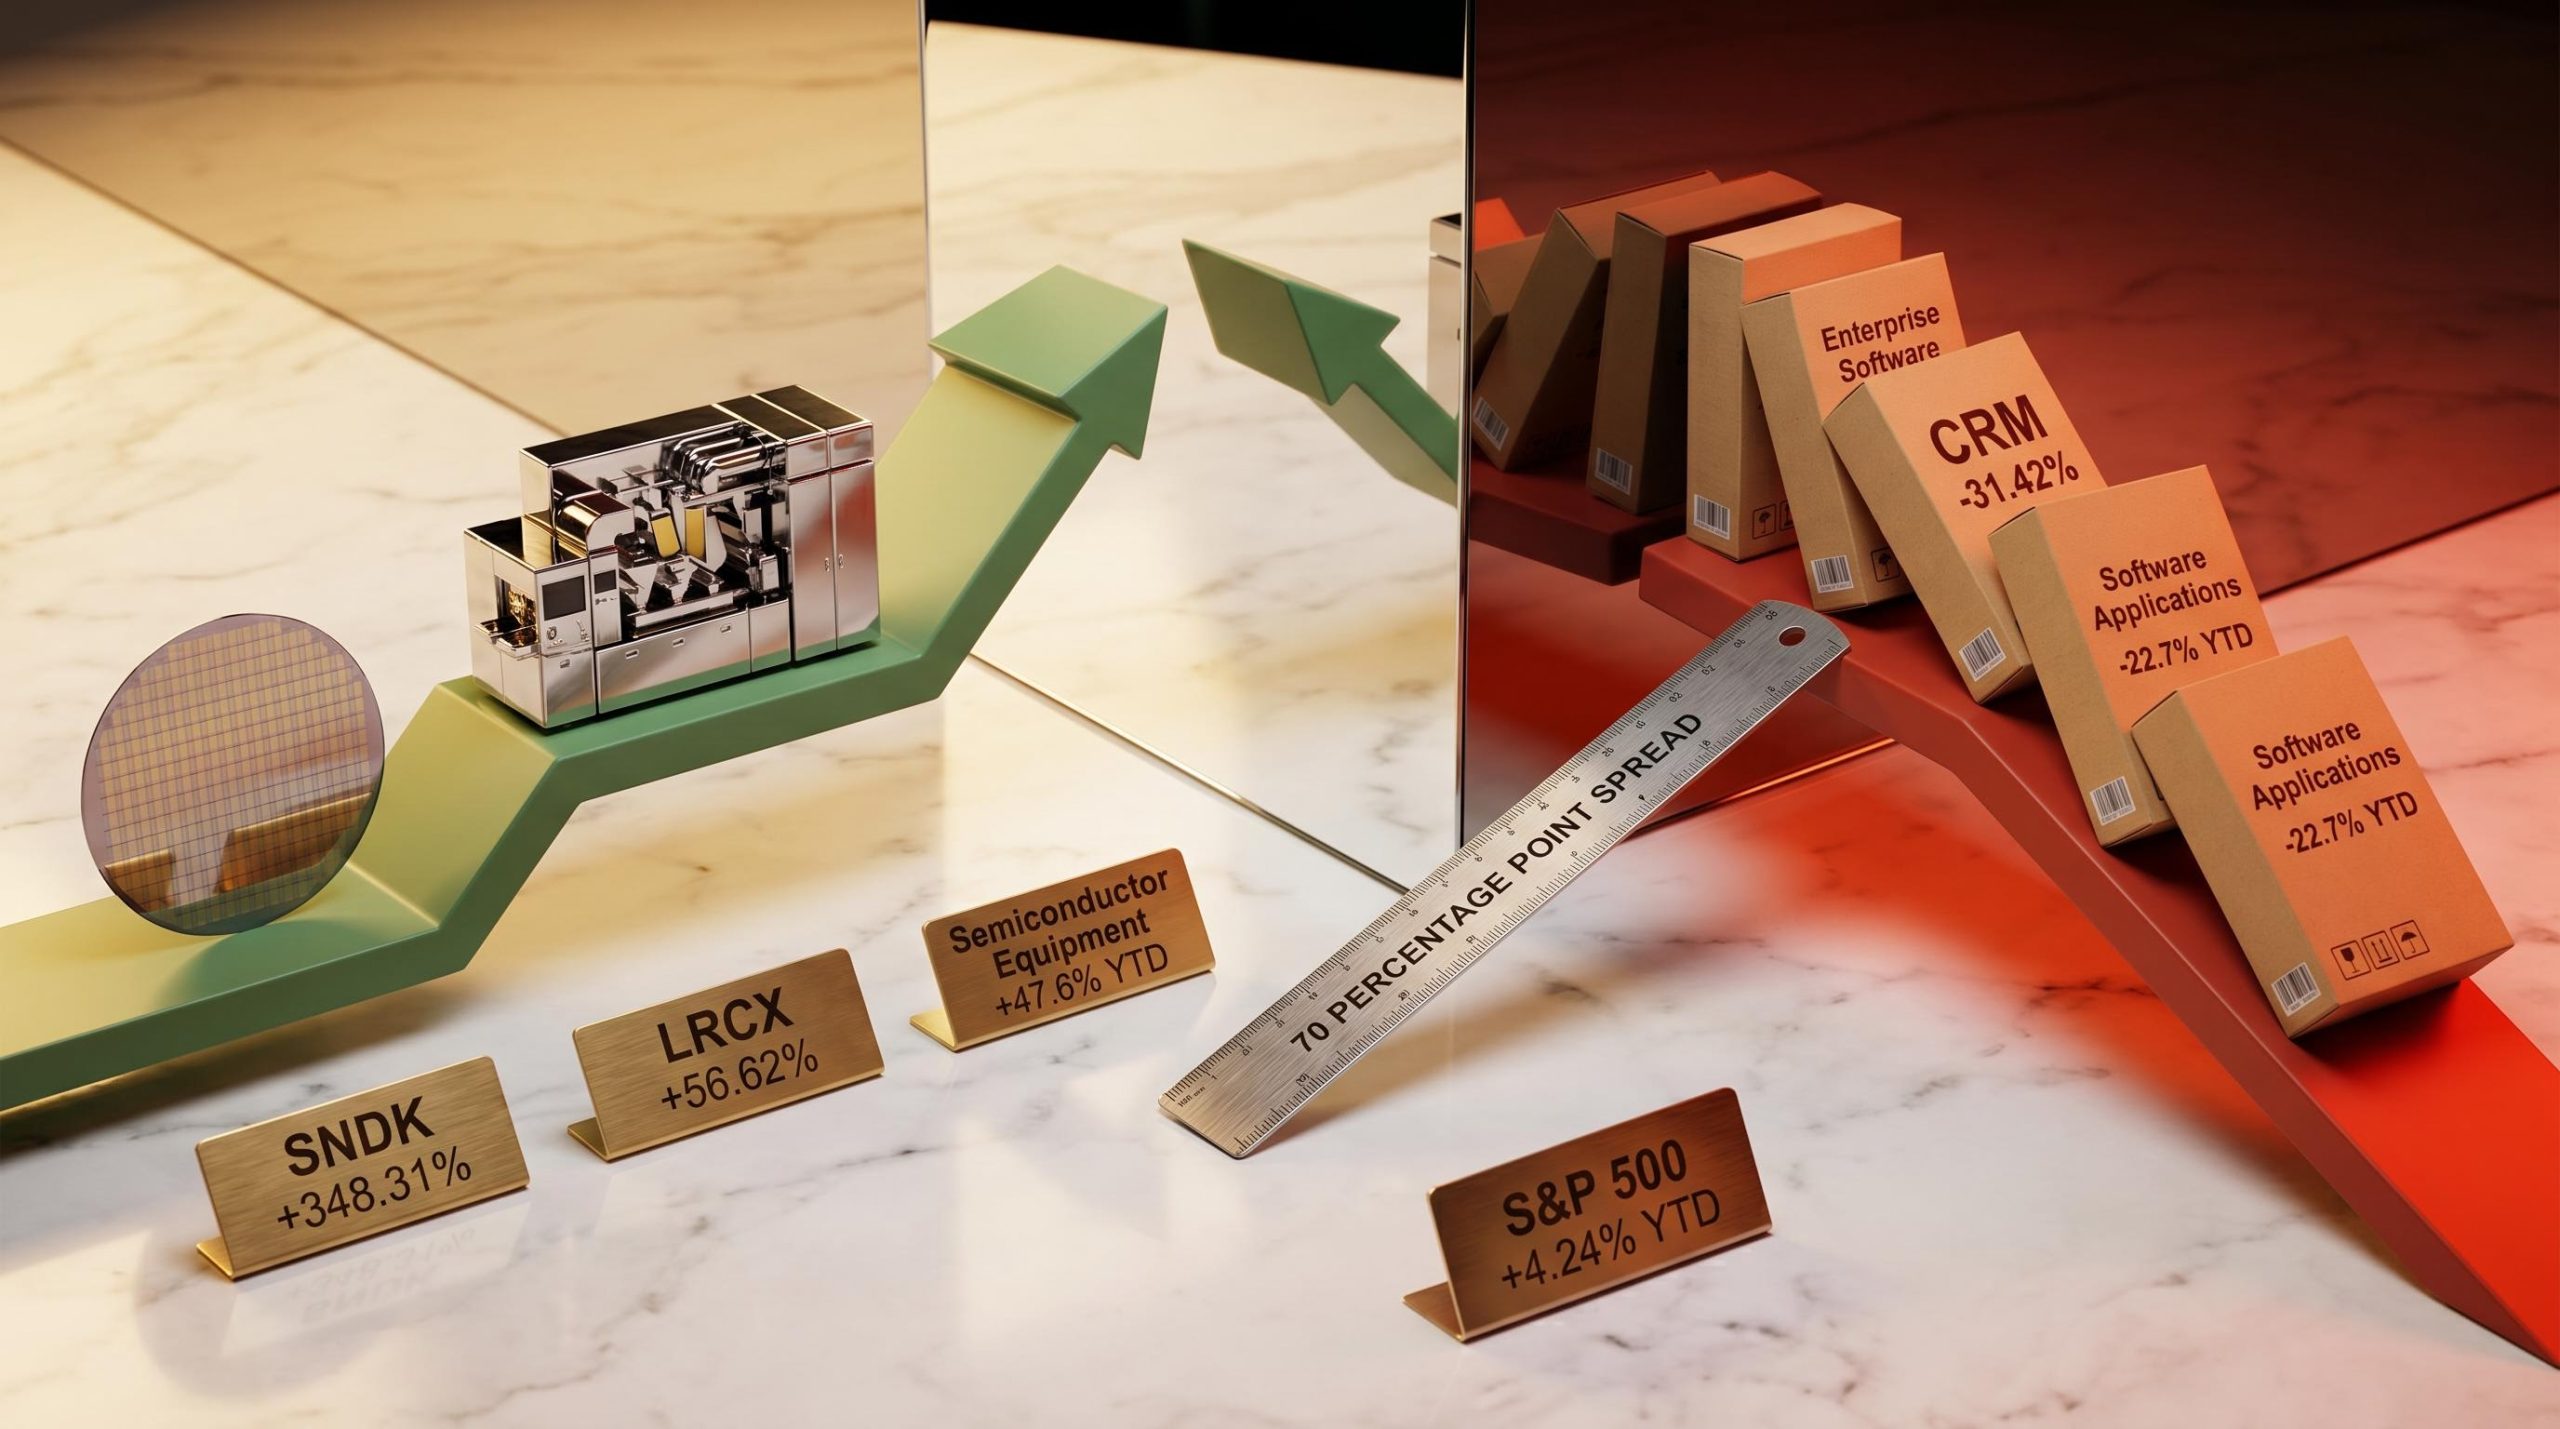
That is a spread of more than 70 percentage points between the best and worst performing technology industry groups in the same calendar year. The S&P 500’s modest 4.24% gain sits almost exactly in the middle, obscuring both the euphoria and the destruction happening underneath.
| Industry Group | YTD Performance | Direction |
|---|---|---|
| Semiconductor Equipment & Materials | +47.6% | Winner |
| Computer Hardware | +45.3% | Winner |
| Software Applications | -22.7% | Loser |
| S&P 500 (Benchmark) | +4.24% | Benchmark |
Technology contributed approximately 1.6 percentage points of the market’s roughly 4.7-point year-to-date gain through mid-April, accounting for about 34% of total market appreciation. The sector’s internal split is not a sideshow. It is the most consequential performance story in the US market right now.
Each company on the winning side of the AI divide occupies a different chokepoint in the chip supply chain. That distinction matters because it determines how durable each stock’s gain is likely to be.
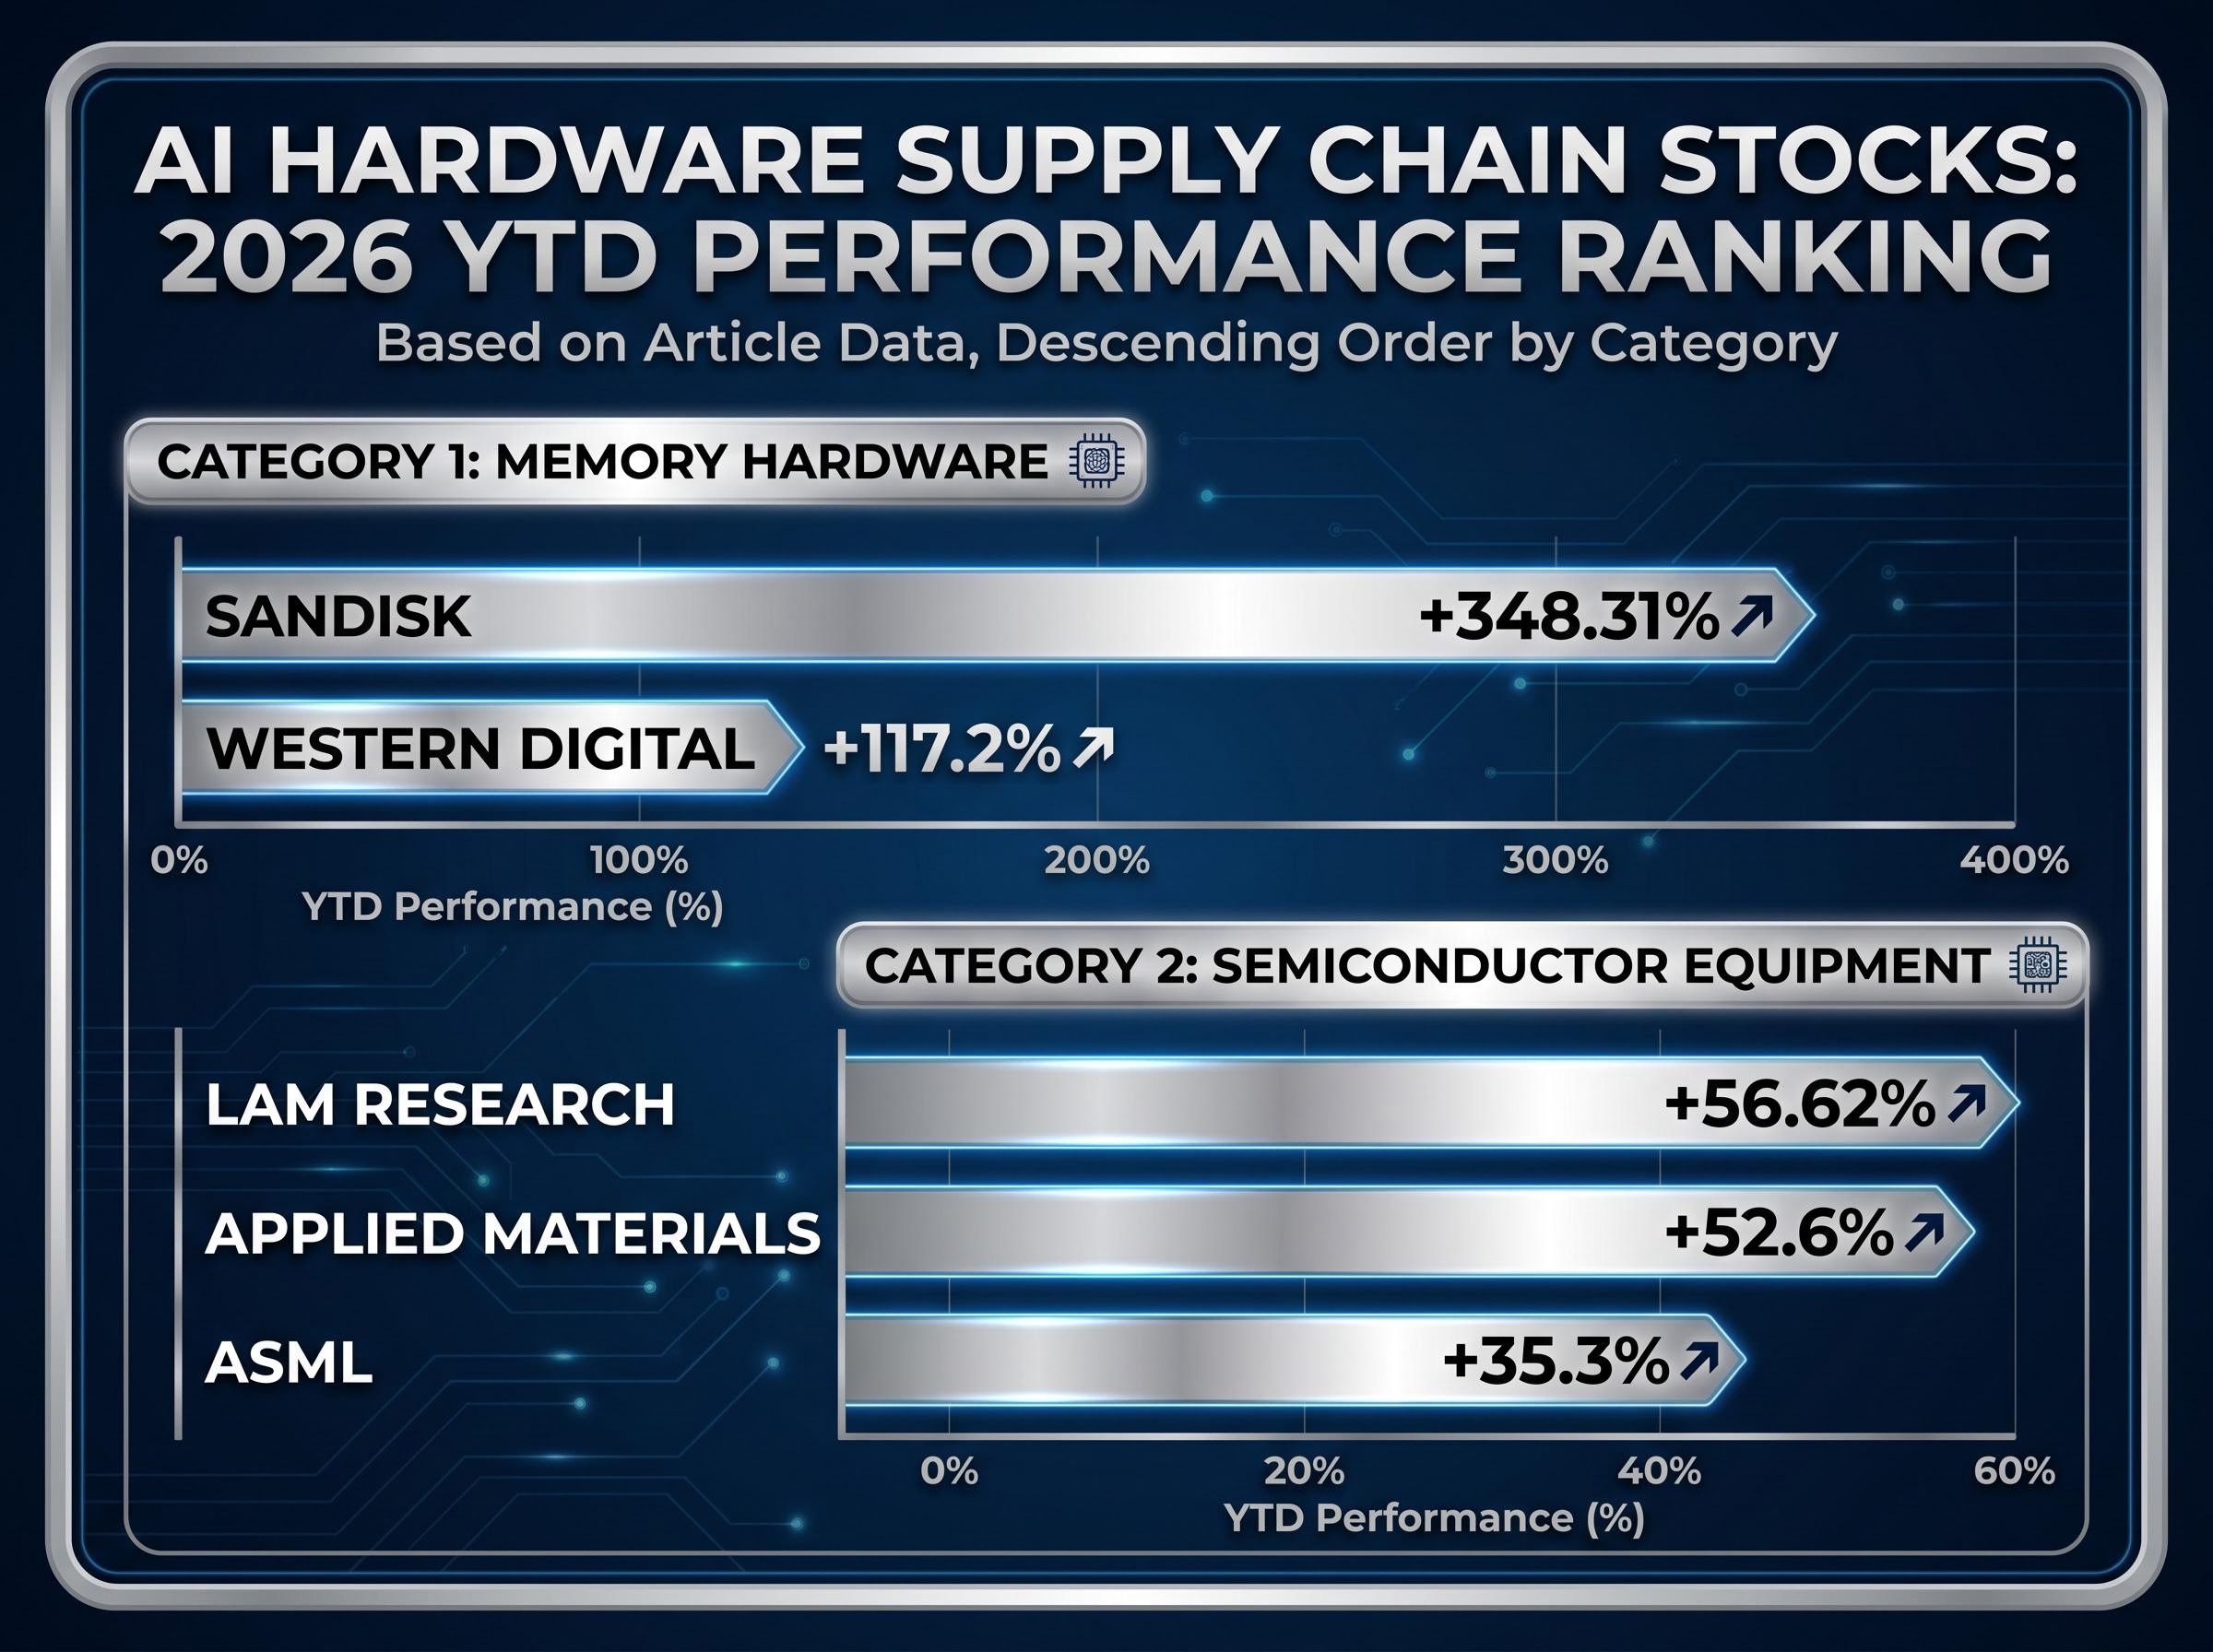
SanDisk (SNDK) has gained 348.31% year-to-date, a figure that looks like a misprint until the mechanism behind it is understood. AI model training and inference require massive volumes of fast-access storage, and that demand has created what S&P Global described in March 2026 research as an AI-driven memory squeeze. NAND flash prices have surged as hyperscale data centre operators compete for storage capacity, and SanDisk, as a pure-play memory name, has captured the full force of that repricing.
Western Digital (WDC) has followed a similar trajectory, gaining year-to-date. The memory layer sits at the base of the AI infrastructure stack, making it a direct derivative of AI capital expenditure rather than a bet on any single application’s success.
Lam Research (LRCX), up 56.62%, dominates AI-related etch and deposition equipment. Applied Materials (AMAT), up 52.6%, serves the same manufacturing layer through a complementary equipment portfolio. Both companies benefit from the sustained buildout of chip fabrication capacity needed to produce AI accelerators.
ASML, up 35.3%, occupies a category of its own. As the sole supplier of extreme ultraviolet (EUV) lithography machines required for leading-edge chip production, ASML holds a monopoly position that makes its AI exposure uniquely defensible. The company raised its 2026 revenue and earnings outlook in April, citing stronger AI-driven lithography demand.
ASML’s raised 2026 revenue outlook, reported by Reuters in April 2026, cited stronger-than-expected AI-driven lithography demand as the primary driver, reinforcing why the company’s monopoly position in EUV equipment translates directly into earnings upside when AI capital expenditure accelerates.
| Stock | Ticker | YTD Performance | AI Supply Chain Role |
|---|---|---|---|
| SanDisk | SNDK | +348.31% | NAND flash memory |
| Western Digital | WDC | +117.2% | Storage / memory |
| Lam Research | LRCX | +56.62% | Etch & deposition equipment |
| Applied Materials | AMAT | +52.6% | Semiconductor manufacturing equipment |
| ASML | ASML | +35.3% | EUV lithography (monopoly supplier) |
The Semiconductor Equipment index’s three-year annualised return of 47.4% confirms this is not a 2026 phenomenon alone. These companies have been compounding gains for years as AI infrastructure spending accelerated.
The AI infrastructure supercycle driving these gains represents approximately 2% of US GDP in 2026, a concentration of capital deployment with few historical parallels in peacetime corporate spending and one that helps explain why semiconductor equipment indices have compounded at nearly 50% annually over three years.
The phrase comes from the California Gold Rush. The miners who dug for gold had wildly variable outcomes; most failed. The merchants who sold picks, shovels, and provisions to those miners profited reliably regardless of who struck gold. The people who supplied the tools captured value with far less risk than the people who used them.
In the AI context, semiconductor equipment companies are the toolmakers. AI application developers and software incumbents are the miners, with highly variable success rates that depend on adoption, competition, and whether their products survive contact with AI-native alternatives.
The Wall Street Journal reported in February 2026 that semiconductor chips represent “the durable AI trade,” framing infrastructure suppliers as the more reliable beneficiaries of AI spending.
The analogy holds most cleanly when three conditions are met:
Where the analogy breaks down is in the assumption that all infrastructure plays carry equal risk. Memory is more cyclical than lithography equipment; NAND prices can reverse when supply catches demand. Federal Reserve economists noted in an April 2026 research paper that they are actively monitoring AI adoption across the US economy, a signal that the macro environment surrounding this trade is still evolving. The picks-and-shovels frame is the most useful heuristic for sorting the AI trade, but applying it mechanically without understanding its limits would miss those nuances.
The software side of the divide is not primarily a story about poor execution. It is a structural repricing of business model risk.
Salesforce (CRM) has fallen 31.42% year-to-date. According to Yahoo Finance coverage from April 2026, the decline reflects growing concern that AI-native competitors and large language model-based tools can replicate core CRM functionality at a fraction of the cost, eroding pricing power and growth expectations. The market is discounting Salesforce not because its current revenue has collapsed, but because the forward assumptions about how much customers will pay for traditional SaaS products are being revised downward.
SAP has dropped approximately 30% year-to-date. Yahoo Finance reported in February 2026 that a cloud revenue slowdown renewed fears about AI-driven workflow automation that could bypass enterprise software licensing models entirely. The vulnerability is different from Salesforce’s: where Salesforce faces AI-native CRM alternatives that commoditise its core product, SAP faces the possibility that AI-powered automation removes the need for certain enterprise software layers altogether.
The Morningstar Global Software Applications index’s five-year annualised return stands at -2.4%, suggesting the market has been sceptical of this sector’s growth thesis for years before 2026’s AI disruption narrative intensified.
| Industry Index | YTD Return | 3-Year Annualised | 5-Year Annualised |
|---|---|---|---|
| Software Applications | -22.7% | +6.8% | -2.4% |
| IT Services | -17.1% | N/A | -0.7% |
| Health Information Services | -16.2% | N/A | -14.6% |
These declines reflect a repricing of long-term growth assumptions. Even a near-term revenue beat is unlikely to reverse the trend if the structural AI disruption thesis remains intact.
Investors wanting to understand the precise mechanism behind these declines will find our full explainer on the SaaS model collapse, which examines how autonomous AI agents are dismantling per-seat pricing logic, how institutional capital rotated out of established software providers in February 2026, and what the wide forecast spread for the generative AI market signals about near-term commercial predictability.
The rotation narrative, the idea that money fleeing technology concentration would spread gains more evenly, has not materialised as expected. The rotation that occurred moved within technology, not away from it.
In Q1 2026, the Morningstar US Market Index fell 4.2%. The technology sector accounted for roughly 3 percentage points of that decline, approximately 70% of the total loss. Financial services, communication services, consumer cyclical, and technology each fell more than 8%. The energy sector’s exceptional 38% Q1 gain was the counter-narrative, but it could not offset technology’s sheer index weight.
Market concentration remained structurally elevated throughout. The five largest stocks, Nvidia (NVDA), Apple (AAPL), Microsoft (MSFT), Amazon (AMZN), and Alphabet (GOOGL), represented approximately 23% of the Morningstar US Market Index as of mid-April, down only marginally from 25% at end-2025.
In April 2026, technology gained 15% in a single month, contributing 4.9 percentage points of the market’s 9.2-point monthly advance, more than half the total gain. The energy sector, which had surged 38% in Q1, fell 10% in April, confirming the rotation into energy was tactical rather than structural.
The same stocks that dragged the market down in Q1 led the recovery in April. That compression of the opportunity window reframes the software losers story: capital did not flee technology broadly. It rotated within technology from software to hardware, which is precisely why the divergence has been so extreme and so persistent.
The data supports three forward-looking questions that should now shape how investors approach the AI trade:
Inference cost unprofitability adds a further dimension to the capex durability question: if generative AI applications remain structurally unprofitable at scale, hyperscalers may decelerate their 2027 procurement commitments even while 2026 spending remains elevated, creating a potential earnings cliff for semiconductor equipment companies whose valuations have been priced for continuation of the current cycle.
The Yale Budget Lab tariff projections, released 8 April 2026, estimate the current tariff regime will raise approximately $1.3 trillion over 2026-2035, a fiscal drag with direct implications for semiconductor equipment companies whose revenue and supply chains span multiple tariff-affected jurisdictions.
US tariffs projected to raise $1.3 trillion over 2026-2035 represent a supply chain headwind that could erode margins for semiconductor equipment companies reliant on cross-border manufacturing.
Federal Reserve economists are actively monitoring AI’s macroeconomic impact on productivity, labour markets, and inflation dynamics, according to FEDS Notes published 3 April 2026. If AI-driven productivity shifts eventually influence interest rate conditions, a further macro dimension gets added to an already complex trade.
The 2026 divergence between AI infrastructure beneficiaries and software incumbents is not a short-term sentiment swing. It reflects a genuine repricing of where AI’s economic value concentrates in the near term. Semiconductor equipment indices have compounded at 47% annually for three years. Software applications have delivered negative five-year returns. This is a multi-year structural repositioning, not its opening chapter.
The tension worth watching is that the same AI buildout currently compressing software incumbents will eventually produce AI-native software challengers. The losers column will keep rotating even as the winners column evolves.
For investors, the actionable takeaway is to examine technology exposure not at the sector level but at the industry group level, using the infrastructure-versus-software-incumbent distinction as the primary sorting criterion. The S&P 500’s 4.24% year-to-date return says almost nothing about what has actually happened inside the market’s most influential sector.
Investors wanting to stress-test these positions against adverse scenarios will find our deep-dive into AI capex concentration risk, which examines the record 13% weighting of semiconductor companies in the US equity market, compares current valuations against dot-com era concentration levels, and provides a framework for identifying companies with proven cash flow versus those reliant on speculative infrastructure demand.
This article is for informational purposes only and should not be considered financial advice. Investors should conduct their own research and consult with financial professionals before making investment decisions. Past performance does not guarantee future results. Financial projections are subject to market conditions and various risk factors.
The biggest winners are semiconductor equipment and hardware companies such as SanDisk (up 348%), Lam Research (up 57%), and ASML (up 35%), while the biggest losers are software incumbents like Salesforce (down 31%) and SAP (down 30%), reflecting a structural repricing of where AI's economic value concentrates.
Semiconductor equipment companies sit upstream of AI application uncertainty, supplying the tools needed to build chips regardless of which AI applications succeed, while software incumbents face direct competition from AI-native alternatives that can replicate their core functionality at lower cost.
The picks-and-shovels strategy means investing in companies that supply the infrastructure and tools enabling AI development, such as chip equipment makers, rather than betting on which AI applications will succeed, because the suppliers capture value more reliably regardless of which end-products win.
The article frames Salesforce's 31% year-to-date decline as a structural repricing driven by AI-native CRM competitors, and argues the key question for investors is whether Salesforce can embed AI into its platform before challengers displace it, making the answer dependent on competitive adaptation rather than near-term earnings.
The two primary risks highlighted are tariff exposure, with US tariffs projected to raise $1.3 trillion over 2026-2035 affecting semiconductor supply chains, and capex cycle durability, since if generative AI applications remain unprofitable at scale, hyperscalers may reduce 2027 procurement and create an earnings cliff for equipment companies.