Why AI Is Splitting Semiconductor Stocks From the Rest of Tech
2 hrs ago
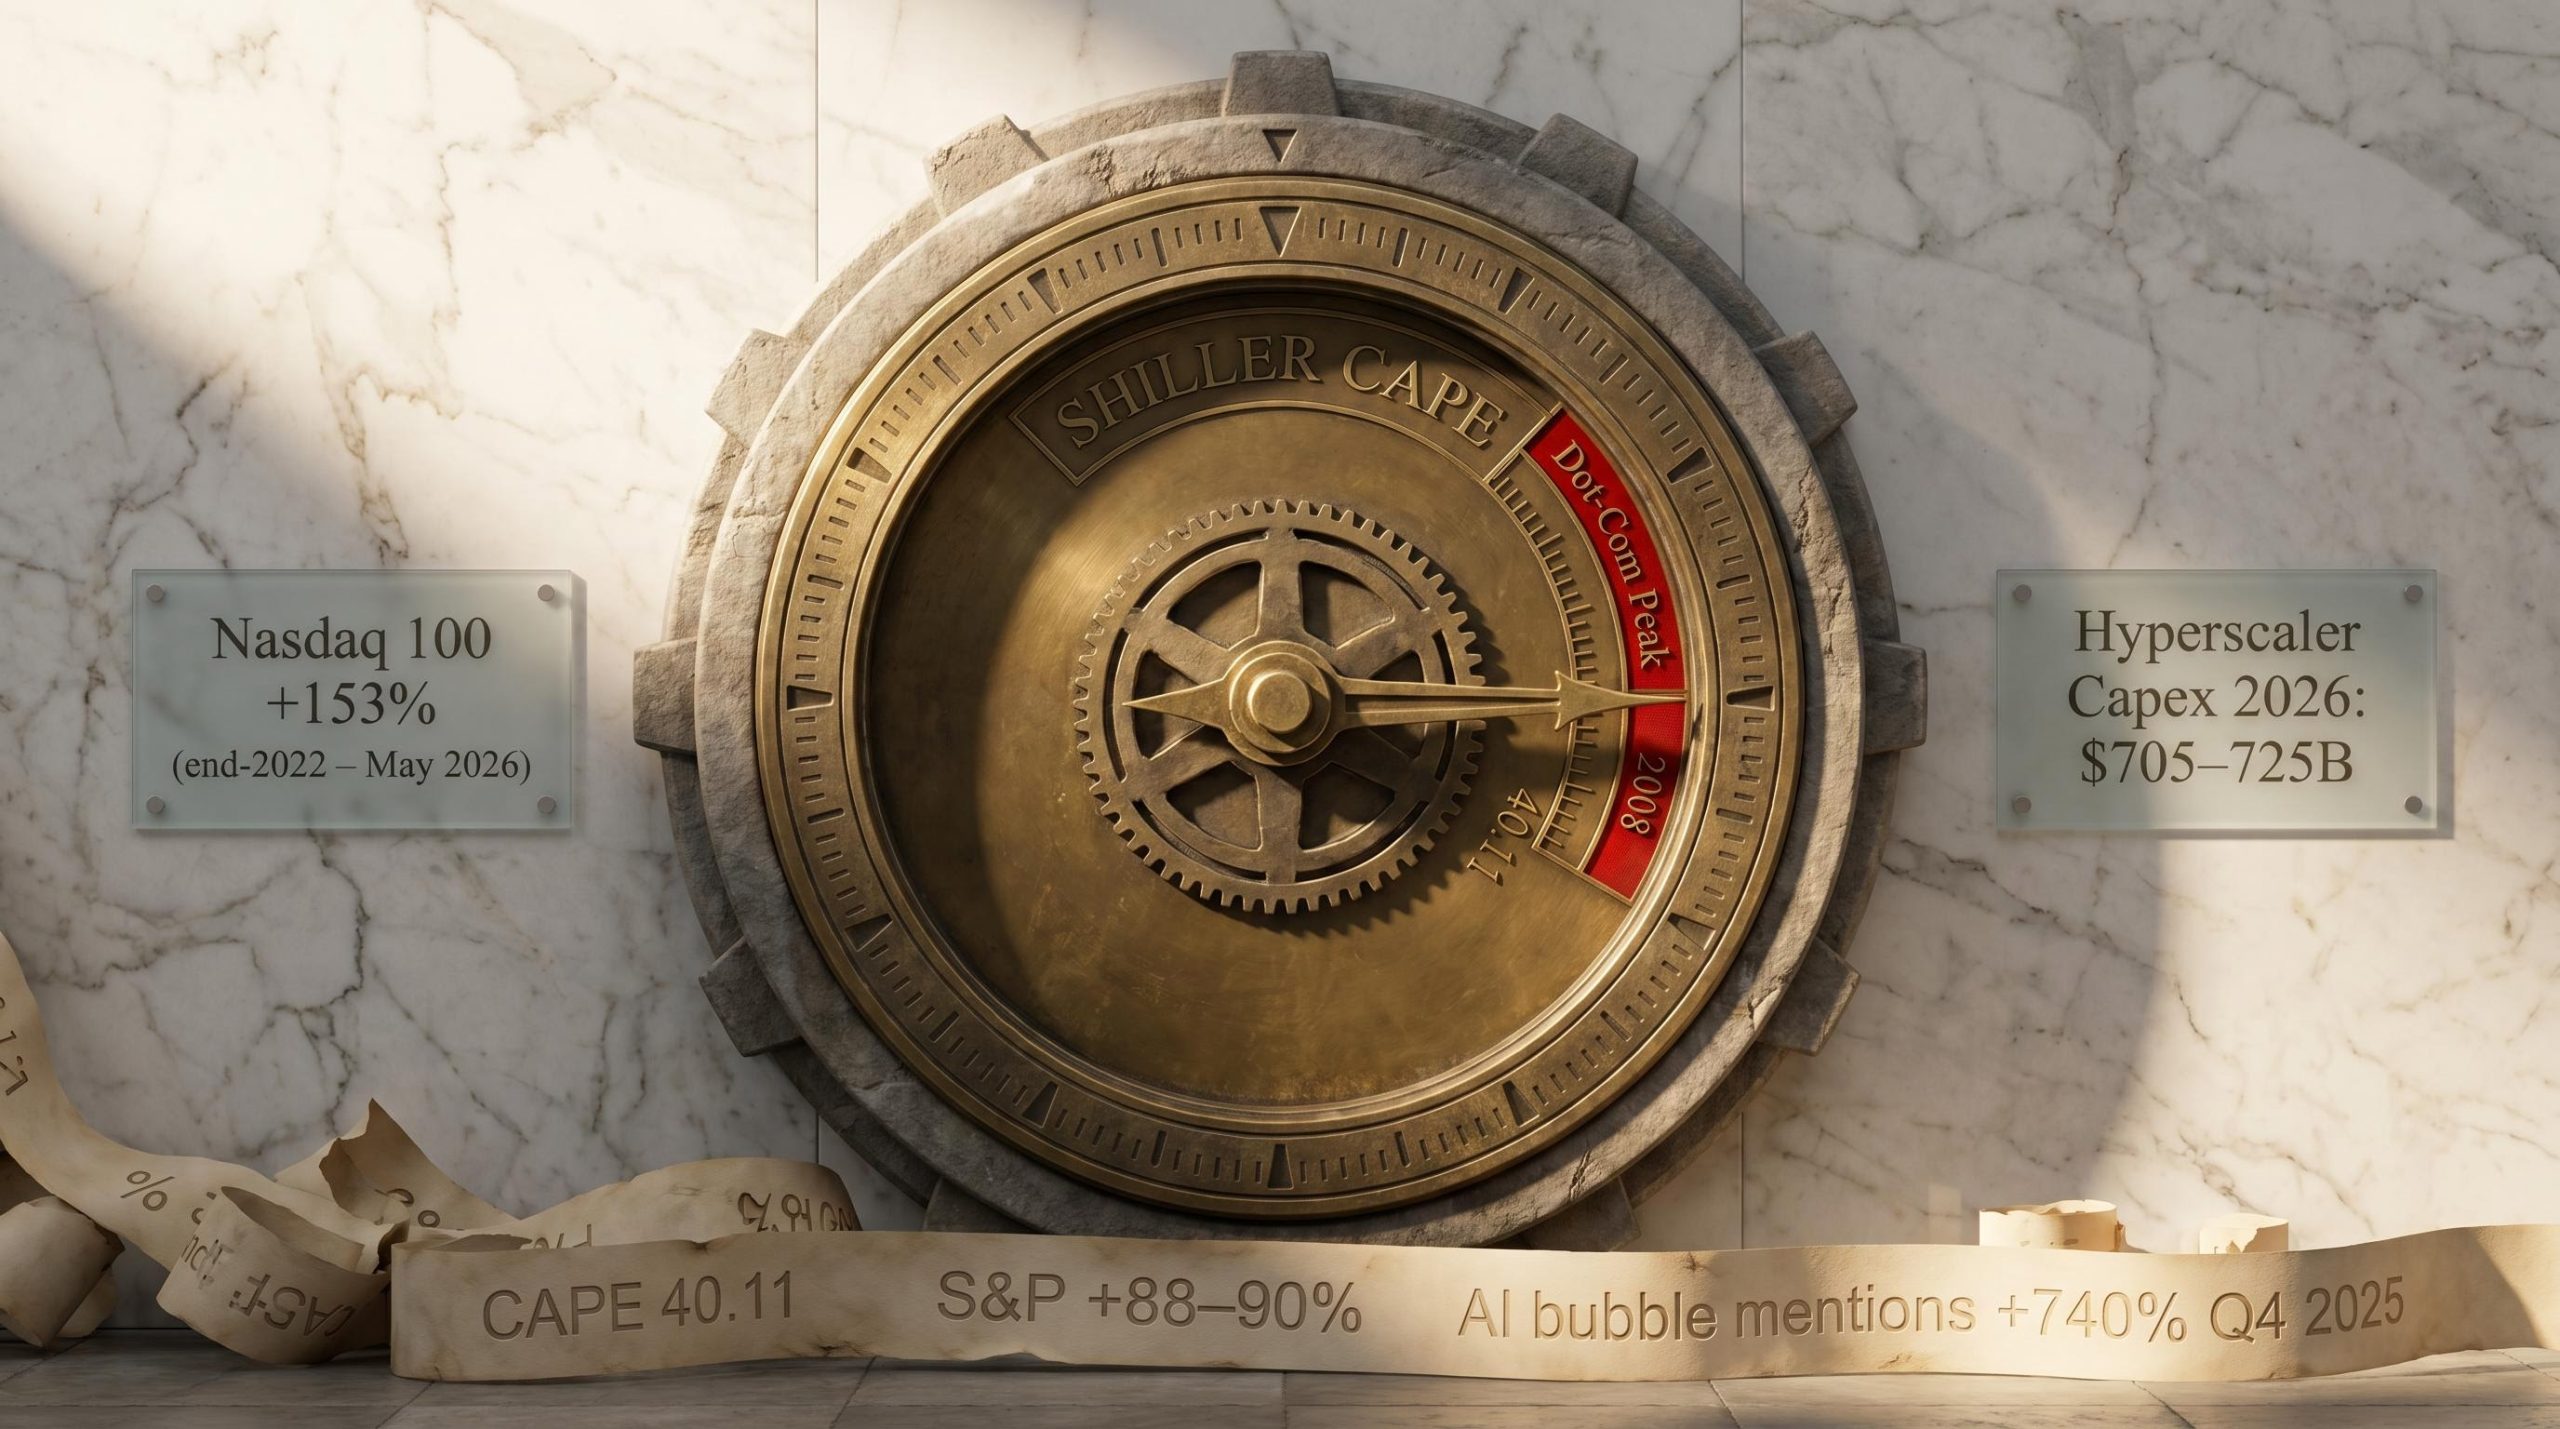
The Shiller CAPE ratio stood at 40.11 as of 1 May 2026, a level historically reached only during the dot-com peak and briefly before the 2008 financial crisis. That single number does not settle the AI stock bubble debate, but it opens it.
Three consecutive years of equity gains anchored by AI sector leadership have produced a Nasdaq 100 return of approximately 153% from end-2022 through May 2026. Economists, central bank officials, and fund managers remain publicly divided on whether this represents rational pricing of a transformative technology or a speculative inflation that established frameworks would recognise as a bubble forming in real time.
What follows applies four of those frameworks, Minsky’s instability hypothesis, Shiller’s CAPE diagnostics, Ruchir Sharma’s four O’s, and Kindleberger’s bubble stage model, to current AI market conditions. The aim is not a binary verdict. It is a structured, theory-grounded method for evaluating where conditions stand as of mid-2026, and what observable signals would resolve the debate from here.
A bubble is only verifiable in retrospect. But the frameworks designed to diagnose one in progress each ask a different question of the same market, using different inputs, and can therefore reach different verdicts simultaneously. Understanding which question each one answers is the prerequisite for evaluating any expert claim about AI valuations.
Hyman Minsky’s financial instability hypothesis tracks the structure of debt. It identifies three financing stages (hedge, speculative, and Ponzi) and looks for the moment when borrowers rely entirely on asset appreciation to service their obligations. Charles Kindleberger’s five-stage model maps where a market sits in its lifecycle, from displacement through euphoria to panic. Ruchir Sharma’s four O’s framework measures overinvestment, overvaluation, over-ownership, and over-leverage as concurrent indicators. Robert Shiller’s CAPE ratio and John Hussman’s Market Cap to Gross Value Added (GVA), a measure comparing total stock market value to the economy’s output, provide the quantitative anchors for structural valuation distortion.
These frameworks are pattern-recognition tools, not prediction engines. Their value lies in telling readers which specific variables to monitor rather than offering a date on a calendar.
| Framework | Variable measured | Bubble signal | Current AI market read |
|---|---|---|---|
| Minsky instability hypothesis | Debt financing structure | Shift from speculative to Ponzi financing | Speculative stage; Ponzi threshold not confirmed |
| Kindleberger five-stage model | Market lifecycle position | Transition from euphoria to profit-taking | Between boom and euphoria; no panic signals |
| Sharma’s four O’s | Investment, valuation, ownership, leverage | All four O’s triggered simultaneously | All four declared fully triggered (December 2025) |
| Shiller CAPE / Hussman GVA | Long-cycle valuation multiples | Readings at or above historical bubble peaks | CAPE at 40.11; GVA directionally bearish |
This is why JPMorgan and Sharma reached opposite conclusions from the same underlying market. They were measuring different variables.
The bearish case starts with the numbers that are hardest to argue away. The Shiller CAPE, which smooths earnings over a 10-year cycle to filter out short-term noise, read 40.11 on 1 May 2026, up from approximately 39 in March 2026. These levels have historically appeared only twice: at the dot-com peak and briefly before the 2008 financial crisis.
Hussman’s Market Cap to GVA metric, which compares total equity market capitalisation to the economy’s gross value added, remained elevated through at least April 2026. Its directional signal is consistent with CAPE: bearish.
A third valuation metric reinforces the directional alignment: the Buffett Indicator, which measures total market capitalisation against GDP, stood at 223.6% as of 1 May 2026, approximately 2.4 standard deviations above its long-run trend and well above dot-com bubble peaks of 150-190%.
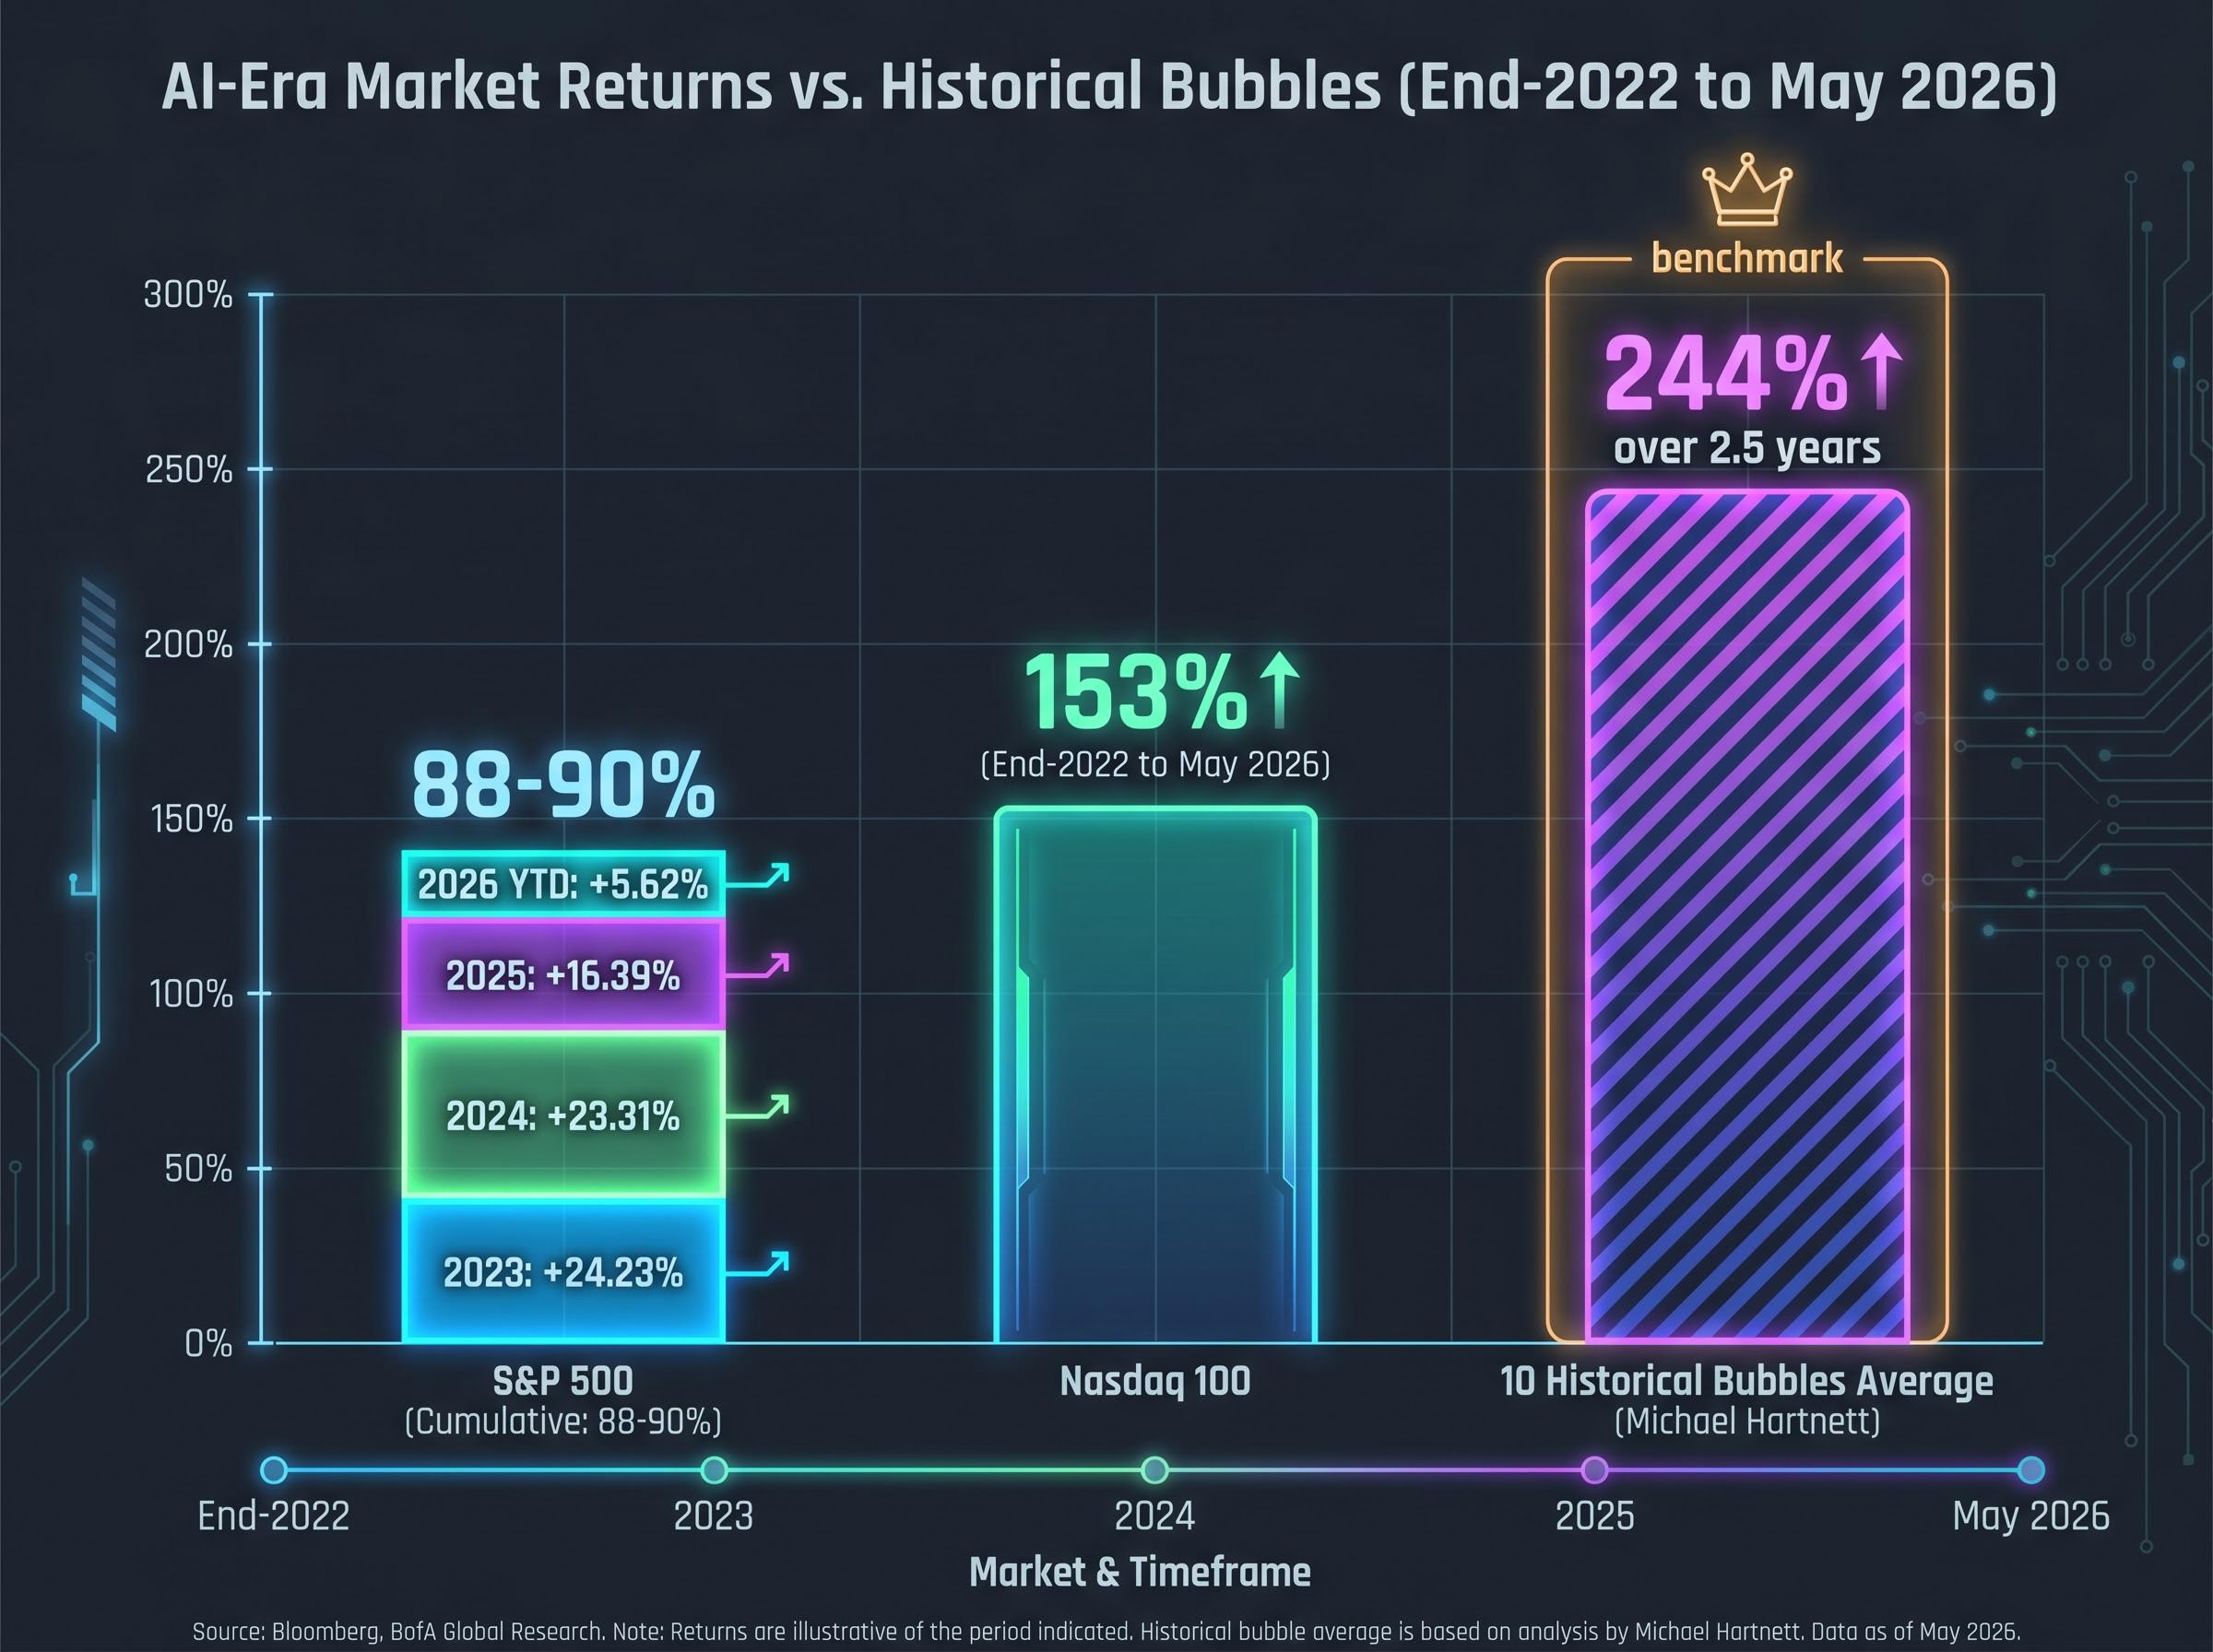
The S&P 500 has delivered a cumulative return of approximately 88-90% since end-2022 (2023: +24.23%, 2024: +23.31%, 2025: +16.39%, 2026 YTD: +5.62%). The Nasdaq 100’s 153% cumulative gain over the same period is steeper still.
Bank of America strategist Michael Hartnett compared the current AI rally to 10 historical bubbles that averaged a 244% gain over 2.5 years. The S&P 500’s 88-90% cumulative run is shorter but steep relative to those prior trajectories.
The metrics are directionally aligned. But the question they leave open is whether this cycle’s earnings base justifies the elevation, or whether the multiples are pricing in revenues that have not yet materialised.
JPMorgan rejected the bubble characterisation in December 2025, arguing that AI investment is linked to real enterprise revenue rather than the speculative projections that defined the dot-com era. Federal Reserve Chair Jerome Powell reinforced this distinction, pointing to measurable data centre growth contributions to GDP as evidence that AI revenues are tangible rather than theoretical.
Individual stock performance through early May 2026 offers partial support. Nvidia gained +25% YTD (approximately $1,250 per share), Meta +15%, Alphabet +12%, Amazon +10%, and Microsoft +8%. These returns reflect ongoing earnings growth, not pure multiple expansion.
The dot-com reference point matters here. That era produced triple-digit revenue multiples for companies with negative operating margins. That threshold has not been reached in the current cycle.
Minsky’s framework describes how financial systems move from stability to fragility through three stages of borrower behaviour. Each stage represents a progressively weaker relationship between an investment’s income and the debt taken on to finance it. Applied to the AI sector, the three stages look like this:
The diagnostic evidence places the AI sector in the speculative financing stage as of early 2026. OpenAI’s internal loss projection of approximately $44 billion cumulative from 2023-2028 (with analyst estimates reaching $143 billion from 2024-2029) illustrates how far some participants are from self-sustaining economics. Ruchir Sharma warned in December 2025 that rising rates in 2026 could trigger the valuation contraction that accelerates the transition from speculative to Ponzi dynamics.
Greg Jensen of Bridgewater stated in late 2025 that “the bubble is ahead of us,” suggesting the most acute phase had not yet arrived.
The shift from speculative to Ponzi financing, where major AI borrowers can no longer service debt from operations and depend entirely on asset appreciation, is the specific threshold that would confirm Minsky’s framework as triggered. That shift has not occurred yet.
The valuation debate often remains abstract. The capex numbers do not.
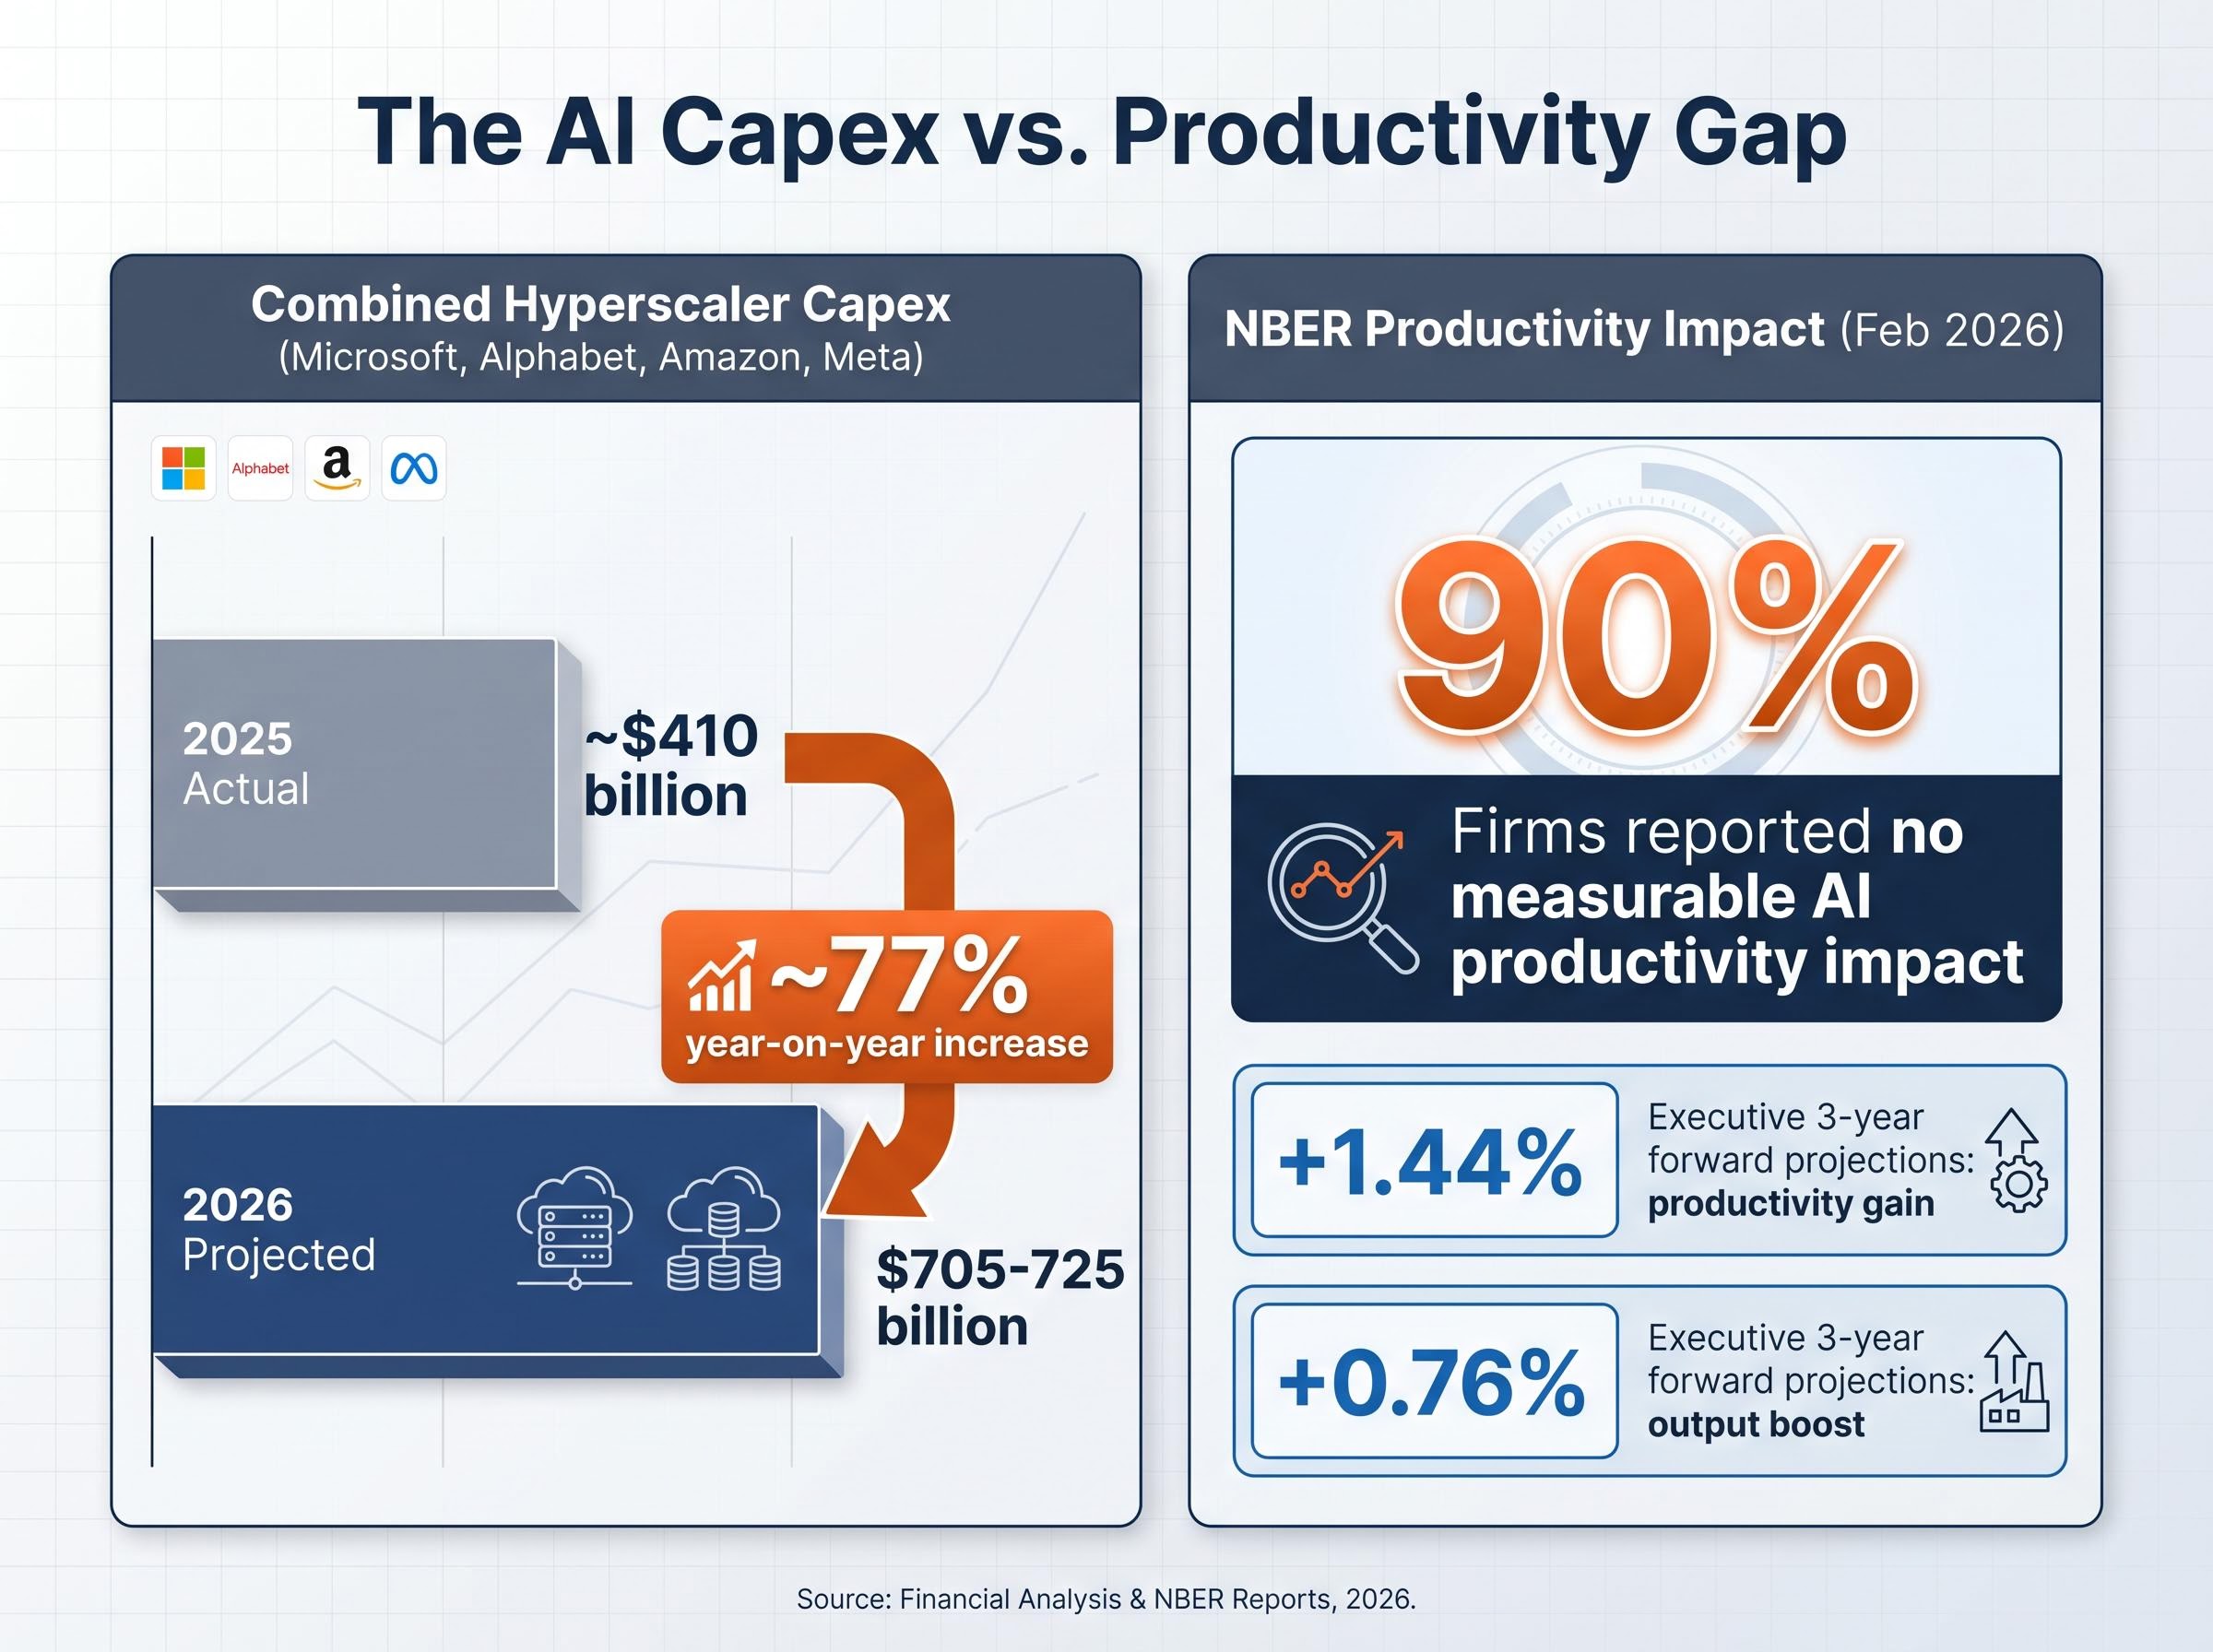
Combined capital expenditure projections from Microsoft, Alphabet, Amazon, and Meta for 2026 stand at approximately $705-725 billion, up roughly 77% from 2025’s approximately $410 billion. A portion of this buildout is being financed through corporate bond issuance, with Meta, Amazon, and Microsoft among the period’s largest debt issuers.
The financing structure behind these commitments has its own escalation logic: hyperscaler debt issuance reached $121 billion in 2025, approximately four times the five-year average, with a further $100 billion projected in 2026, creating the debt-roll dependency that Minsky’s speculative financing stage describes.
| Metric | 2025 (actual) | 2026 (projected) | Key finding |
|---|---|---|---|
| Combined hyperscaler capex | ~$410 billion | $705-725 billion | ~77% year-on-year increase |
| NBER productivity impact | Feb 2026 study | 90% of firms reported no measurable AI productivity impact | |
| Executive productivity expectation | 3-year forward projection | +1.44% productivity gain; +0.76% output boost | |
The gap between investment commitment and measured productivity is where the overinvestment argument finds its most concrete evidence. A February 2026 National Bureau of Economic Research (NBER) study found that 90% of firms surveyed reported no measurable AI impact on workplace productivity, even as executives projected a +1.44% productivity increase and a +0.76% output boost over three years.
If all major AI competitors rise proportionally in valuation, the implied aggregate earnings expansion would need to exceed the economy’s total addressable demand for AI services, a condition that is mathematically bounded. The dot-com parallel is instructive here: the internet was genuine technology, but genuine technology did not validate prevailing valuations of the infrastructure built to serve it.
Mel Williams of TrueBridge described the likely outcome as “a lot of carnage” playing out over a 10-year horizon, with both winners and widespread failures.
Historical analogues are the most commonly misapplied tool in market commentary. The value lies not in the scare story but in the structural diagnostic: which specific features of past episodes are present today, and which are absent.
Two cases offer the most relevant comparison:
Features present in 2026:
Features absent in 2026:
John Templeton observed that bull markets end in euphoria. AI sentiment as of mid-2026 has not reached that threshold.
Barclays’ Venu Krishna drew a similar distinction, contrasting the “complete excitement” of the dot-com era with rising questions about whether current AI investments will deliver returns. Earnings call data reinforces this reading: mentions of “AI bubble” on corporate earnings calls rose 740% in Q4 2025. Widespread acknowledgment of risk may itself be a counter-signal; genuine mania tends to dismiss scepticism rather than broadcast it.
Sharma declared all four O’s fully triggered. JPMorgan rejected the label entirely. The historical parallels suggest both are partially right: the structural conditions are present, but the behavioural conditions that have historically marked the final stage are not.
The frameworks do not deliver a binary answer as of May 2026. They deliver a conditional one. The debate resolves based on observable signals that have not yet arrived.
Conditions that would confirm bubble progression:
Conditions that would validate the bull case and weaken the bubble thesis:
The hardware and software divergence within the technology sector sharpens this reading: semiconductor equipment indices gained 47.6% year-to-date through April 2026 while software applications indices fell 22.7%, a spread of more than 70 percentage points that reflects capital flowing within the AI trade rather than out of it.
Roger Montgomery’s portfolio observation applies here as a structural note: if equities have grown from 60% to 70% of a portfolio during this rally, the structural logic favours reducing back to the 60% target regardless of one’s view on whether a bubble has formed. Hartnett’s nuance is complementary: stay invested to capture the final rally, but recognise the pattern.
Q2 2026 earnings from the major hyperscalers represent the next data point that will sharpen the reading. The revenue-versus-capex gap is where the frameworks converge.
This article is for informational purposes only and should not be considered financial advice. Investors should conduct their own research and consult with financial professionals before making investment decisions. Past performance does not guarantee future results. Financial projections are subject to market conditions and various risk factors.
The four frameworks identify conditions consistent with late-cycle speculative financing. None of the criteria for a confirmed Minsky Moment have been triggered as of May 2026. Sharma’s four O’s read as fully activated. Kindleberger’s model places the market somewhere between boom and euphoria but not yet at panic. CAPE and GVA are at levels that have historically preceded corrections, but “historically preceded” is not the same as “currently confirms.”
The 740% surge in AI bubble mentions on earnings calls is itself an analytical data point. Preceding episodes of genuine mania were characterised by the absence of widespread risk acknowledgment, not its presence. The fact that the bubble debate is this loud may indicate the most acute phase has not yet formed.
AI as a technology with generational implications is not in question. What is in question is whether current equity prices reflect a return horizon that public markets, structured around quarterly earnings cycles and annual performance benchmarks, are not built to price. That is the gap the frameworks measure. It remains open.
The Shiller CAPE ratio smooths corporate earnings over a 10-year cycle to filter short-term noise, giving a long-run valuation reading. At 40.11 as of May 2026, it has historically appeared only at the dot-com peak and briefly before the 2008 financial crisis, making it a key data point in assessing whether AI stocks are overvalued.
Four major analytical frameworks give a split verdict: Sharma's four O's declared all bubble indicators fully triggered in December 2025, while JPMorgan rejected the bubble label, arguing AI investment is tied to real enterprise revenue. Minsky's framework places the market in speculative but not yet Ponzi financing, and Kindleberger's model locates it between boom and euphoria with no panic signals yet.
A Minsky Moment occurs when borrowers can no longer service debt from operations and depend entirely on rising asset prices to stay solvent, causing the financial system to break. As of early 2026, major AI infrastructure investors such as Meta, Amazon, and Microsoft are in the speculative financing stage, where they can cover interest but rely on future revenue growth to repay principal, meaning the Ponzi threshold that would confirm a Minsky Moment has not yet been reached.
Bank of America strategist Michael Hartnett compared the AI rally to 10 historical bubbles that averaged a 244% gain over 2.5 years. The S&P 500 has returned approximately 88-90% cumulatively since end-2022, while the Nasdaq 100 gained around 153% over the same period, a steep but shorter run relative to those prior bubble trajectories.
Confirmation signals include a shift from speculative to Ponzi financing among major AI borrowers, earnings disappointments from hyperscalers where capex outpaces revenue, and sentiment moving toward genuine euphoria where scepticism is dismissed. The bull case would be strengthened by firms reporting measurable AI productivity gains, revenue growth outpacing capital expenditure commitments, and multiple compression absorbed without earnings deterioration.