Private fixed investment in information processing equipment rose 24% year-over-year in inflation-adjusted terms in Q1 2026, yet most investors scanning the Bureau of Economic Analysis (BEA) headline release on 30 April 2026 would not have found the phrase “AI spending” anywhere on the official GDP ledger. The advance estimate showed 2.0% annualised growth, a rebound from 0.5% in Q4 2025, and consensus coverage focused on the topline number. The more consequential story sat one layer beneath it: a concentrated technology infrastructure surge that the standard GDP release does not tell cleanly. This analysis explains how AI infrastructure investment is being measured, and arguably mismeasured, in official US economic data, what the Q1 2026 figures actually show, why the trade deficit complicates the accounting, and what the resulting picture means for investors evaluating high-tech equities right now.
The GDP number everyone cited missed the most important detail
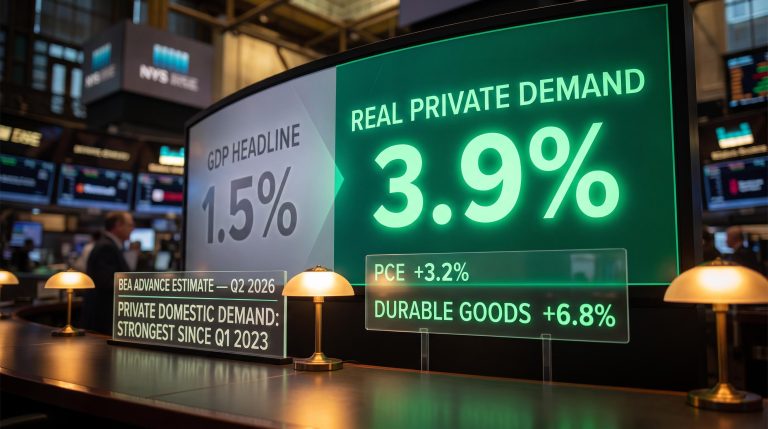
The 2.0% annualised print landed below the Reuters analyst consensus of approximately 2.3%, and initial coverage framed it as a modest recovery. That framing missed the composition.
The broader GDP composition of the Q1 2026 print tells a more complete story than the headline: domestic demand actually grew at 2.5% annualised, with the gap driven by a tariff-related import surge that mechanically reduced the topline figure rather than signalling any underlying demand weakness.
Private fixed investment in equipment, specifically information processing equipment, was a primary driver of the rebound. Intellectual property products, led by software, reinforced it. Together, these high-tech categories carried the headline number.
- Q1 2026 GDP growth: 2.0% annualised (BEA advance estimate, 30 April 2026)
- Q4 2025 comparison: 0.5% annualised
- High-tech contribution: approximately 1 percentage point of Q1 2026 GDP growth, per Morningstar Senior US Economist Preston Caldwell
- Information processing equipment: an estimated 0.5 percentage points of that total
High-tech categories, including IT equipment, data centres, software, and R&D, contributed approximately 1 percentage point to Q1 2026 GDP growth, according to Morningstar’s Preston Caldwell.
The rebound was not broad-based consumer or government spending growth. It was a concentrated technology investment surge. Investors who only read the headline figure missed the structural signal embedded in its composition.
When big ASX news breaks, our subscribers know first
Why the Bureau of Economic Analysis cannot give you a clean AI number
AI does not exist as a line item in BEA releases. The spending shows up, but it is scattered across broader categories, and the accounting conventions that govern those categories introduce a systematic undercount.
How BEA categorises AI spending
The BEA measures AI-related investment under two headings: “information processing equipment” (servers, semiconductors, data centre hardware) and “intellectual property products” (software, research and development). Hedonic pricing index deflators adjust the equipment figures for quality improvements, per 2025 BEA handbook revisions. Neither heading isolates AI from non-AI technology spending.
This means an investor reading the official release cannot determine how much of the equipment surge reflects AI-specific infrastructure versus broader IT replacement cycles.
The import offset problem
BEA methodology subtracts the cost of imports from GDP contributions. AI hardware purchases that originate from Asian semiconductor supply chains, chips fabricated in Taiwan and assembled in South Korea, reduce the net GDP credit for that investment, even when the hardware is installed in US-based data centres.
The result is a paradox. The same AI hardware build-out that stimulates domestic economic activity simultaneously widens the trade deficit, partially cancelling itself in the official accounts.
Two distinct channels of measurement distortion are at work:
- Hardware (import-offset): Imported semiconductors and data centre components do not count positively toward GDP under standard accounting, suppressing the net contribution of equipment investment.
- Software (clean measurement): Software and R&D outlays, categorised under intellectual property products, carry no import offset and register more completely in GDP.
Where software investment escapes the undercount
Because software and R&D are primarily domestic expenditures, BEA data shows intellectual property products as a cleaner positive contributor to growth even when equipment data is complicated by trade flows. This is why the software side of AI infrastructure spending appears more fully in GDP releases than the hardware side.
Caldwell has argued that BEA may underestimate IT equipment investment by 20-30% due to unoffset semiconductor imports. If that estimate holds, investors relying on GDP as a direct read of AI’s economic momentum are working with an inherently conservative figure.
What the St. Louis Fed’s custom tracking reveals that BEA releases do not
The Federal Reserve Bank of St. Louis addressed the aggregation problem directly. In a January 2026 publication, the St. Louis Fed constructed custom categories tracking cloud servers, GPUs, and related software to isolate AI’s GDP contribution, a granularity that BEA’s standard release does not offer.
The St. Louis Fed’s January 2026 GDP tracking methodology constructed custom categories for cloud servers, GPUs, and AI-related software specifically because BEA’s standard release aggregates these expenditures into broader headings that obscure the technology-specific investment signal.
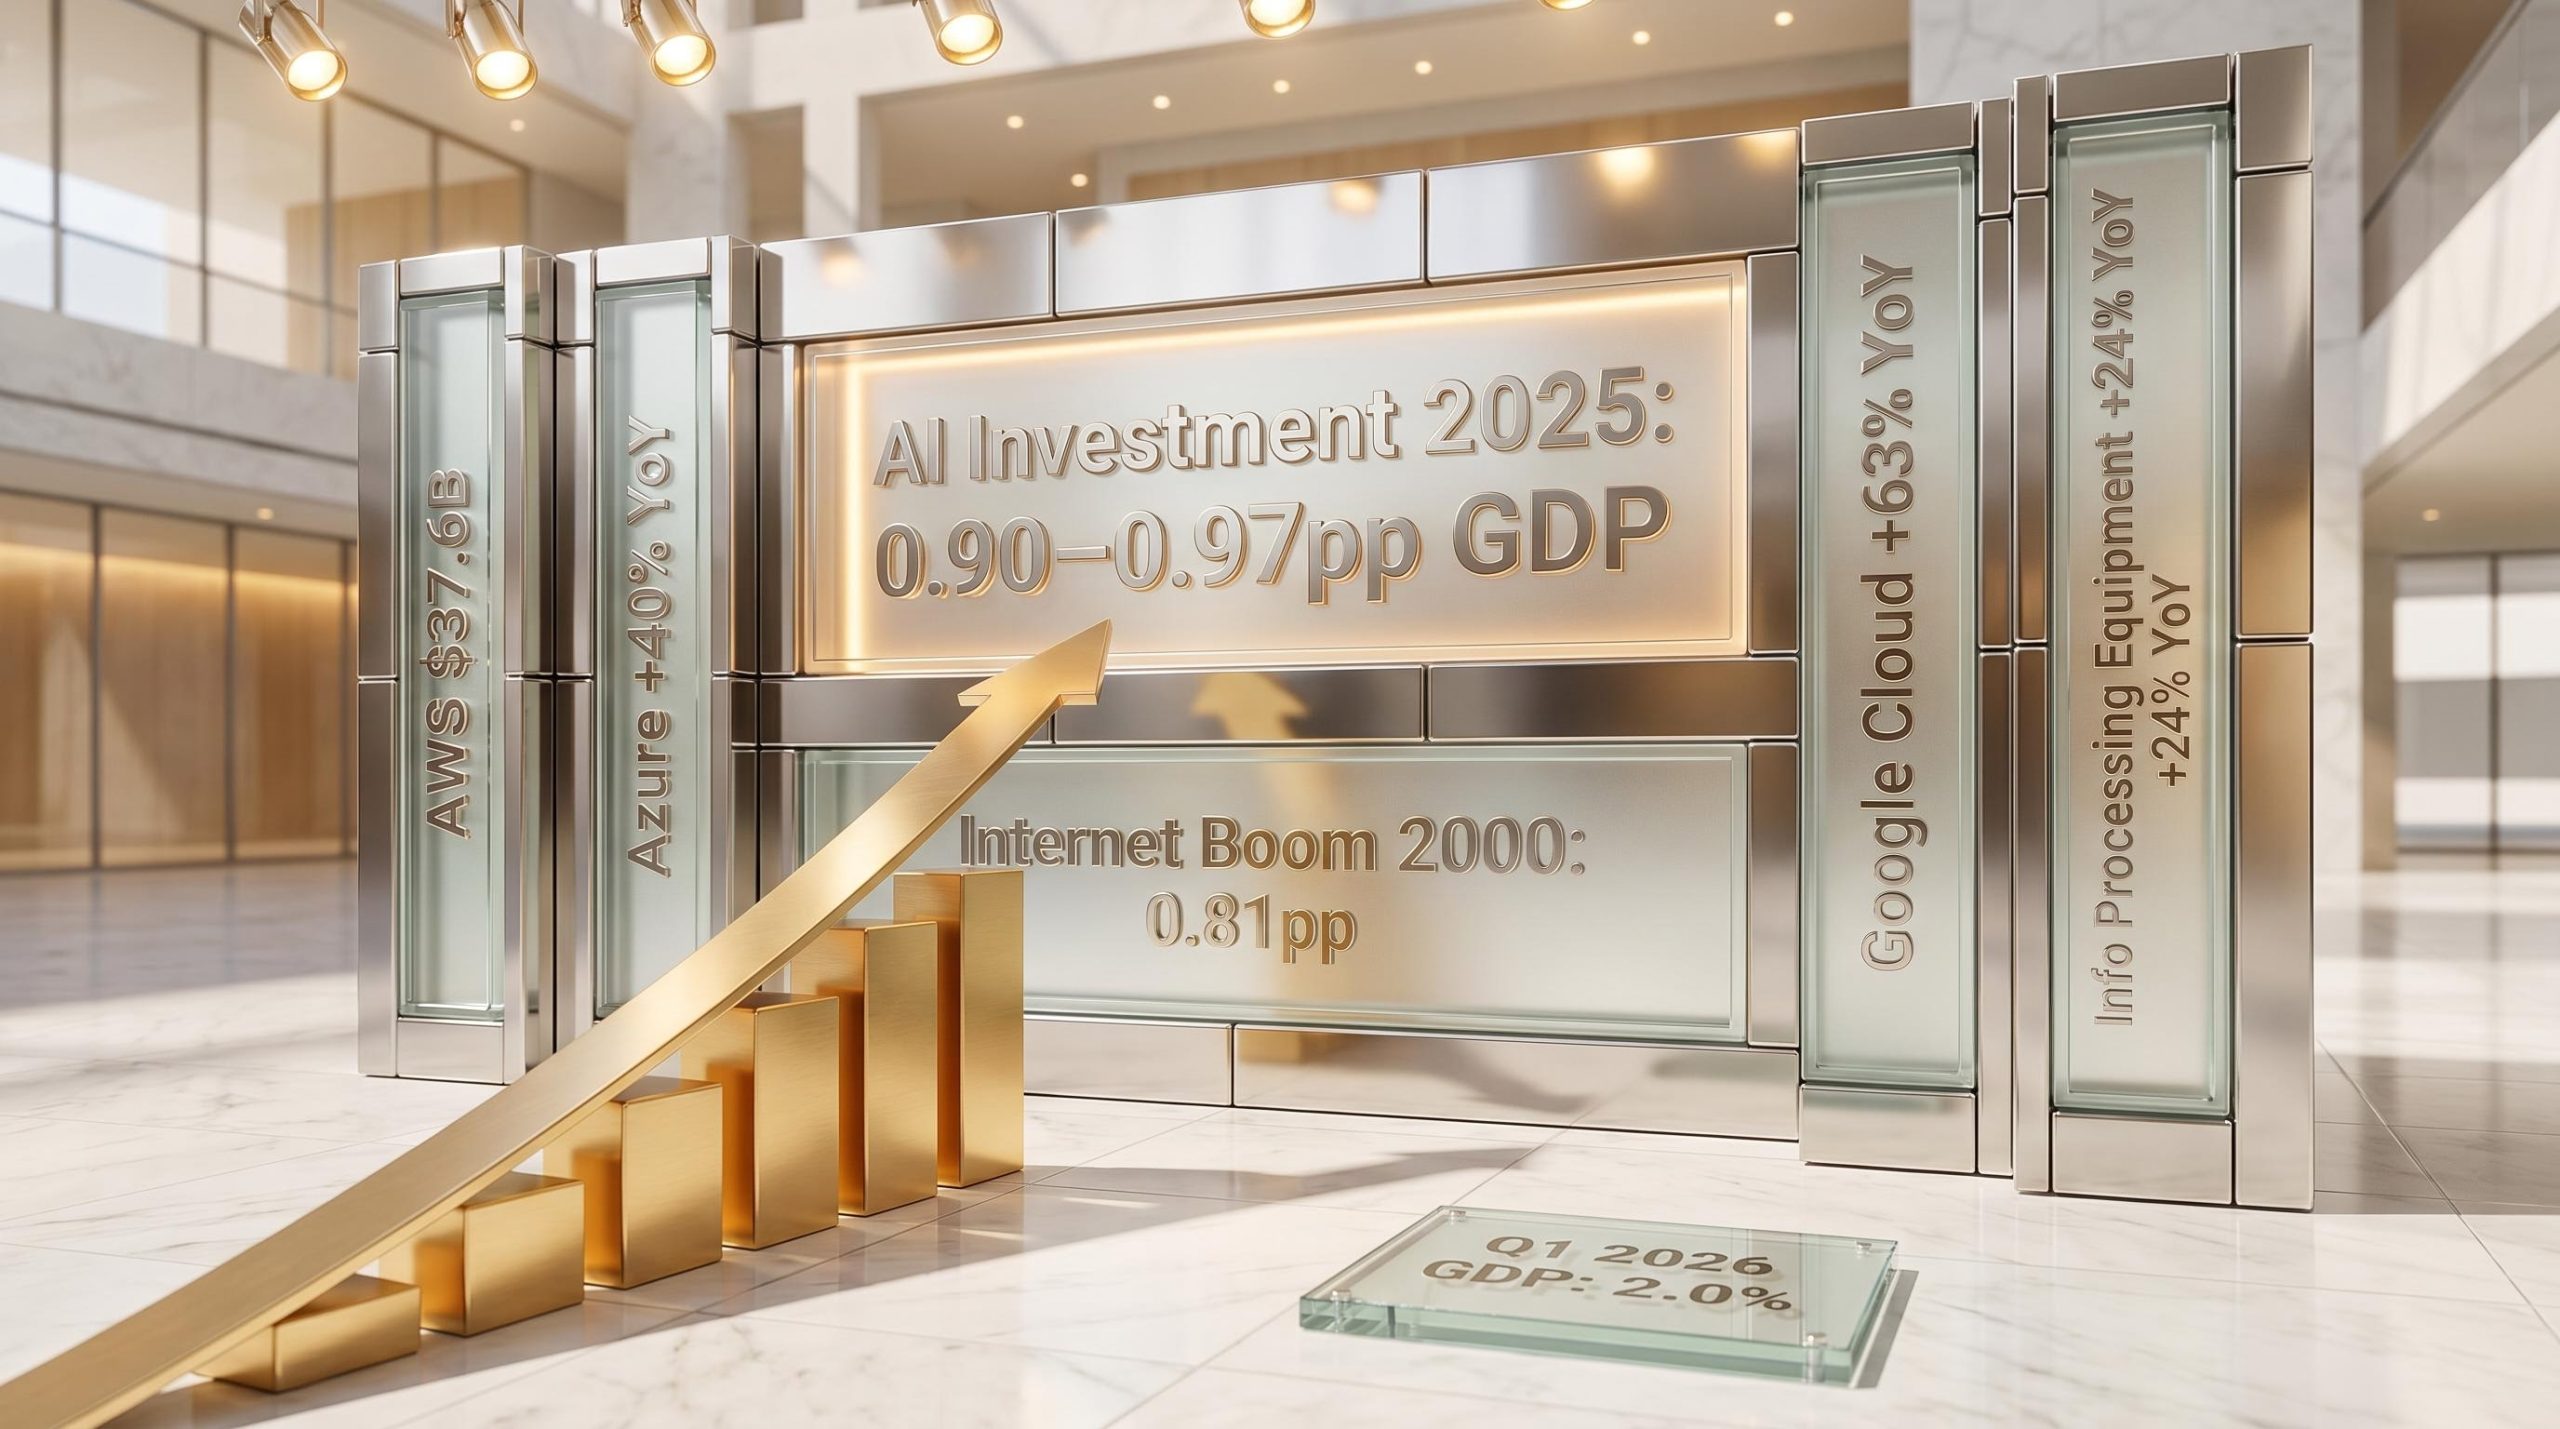
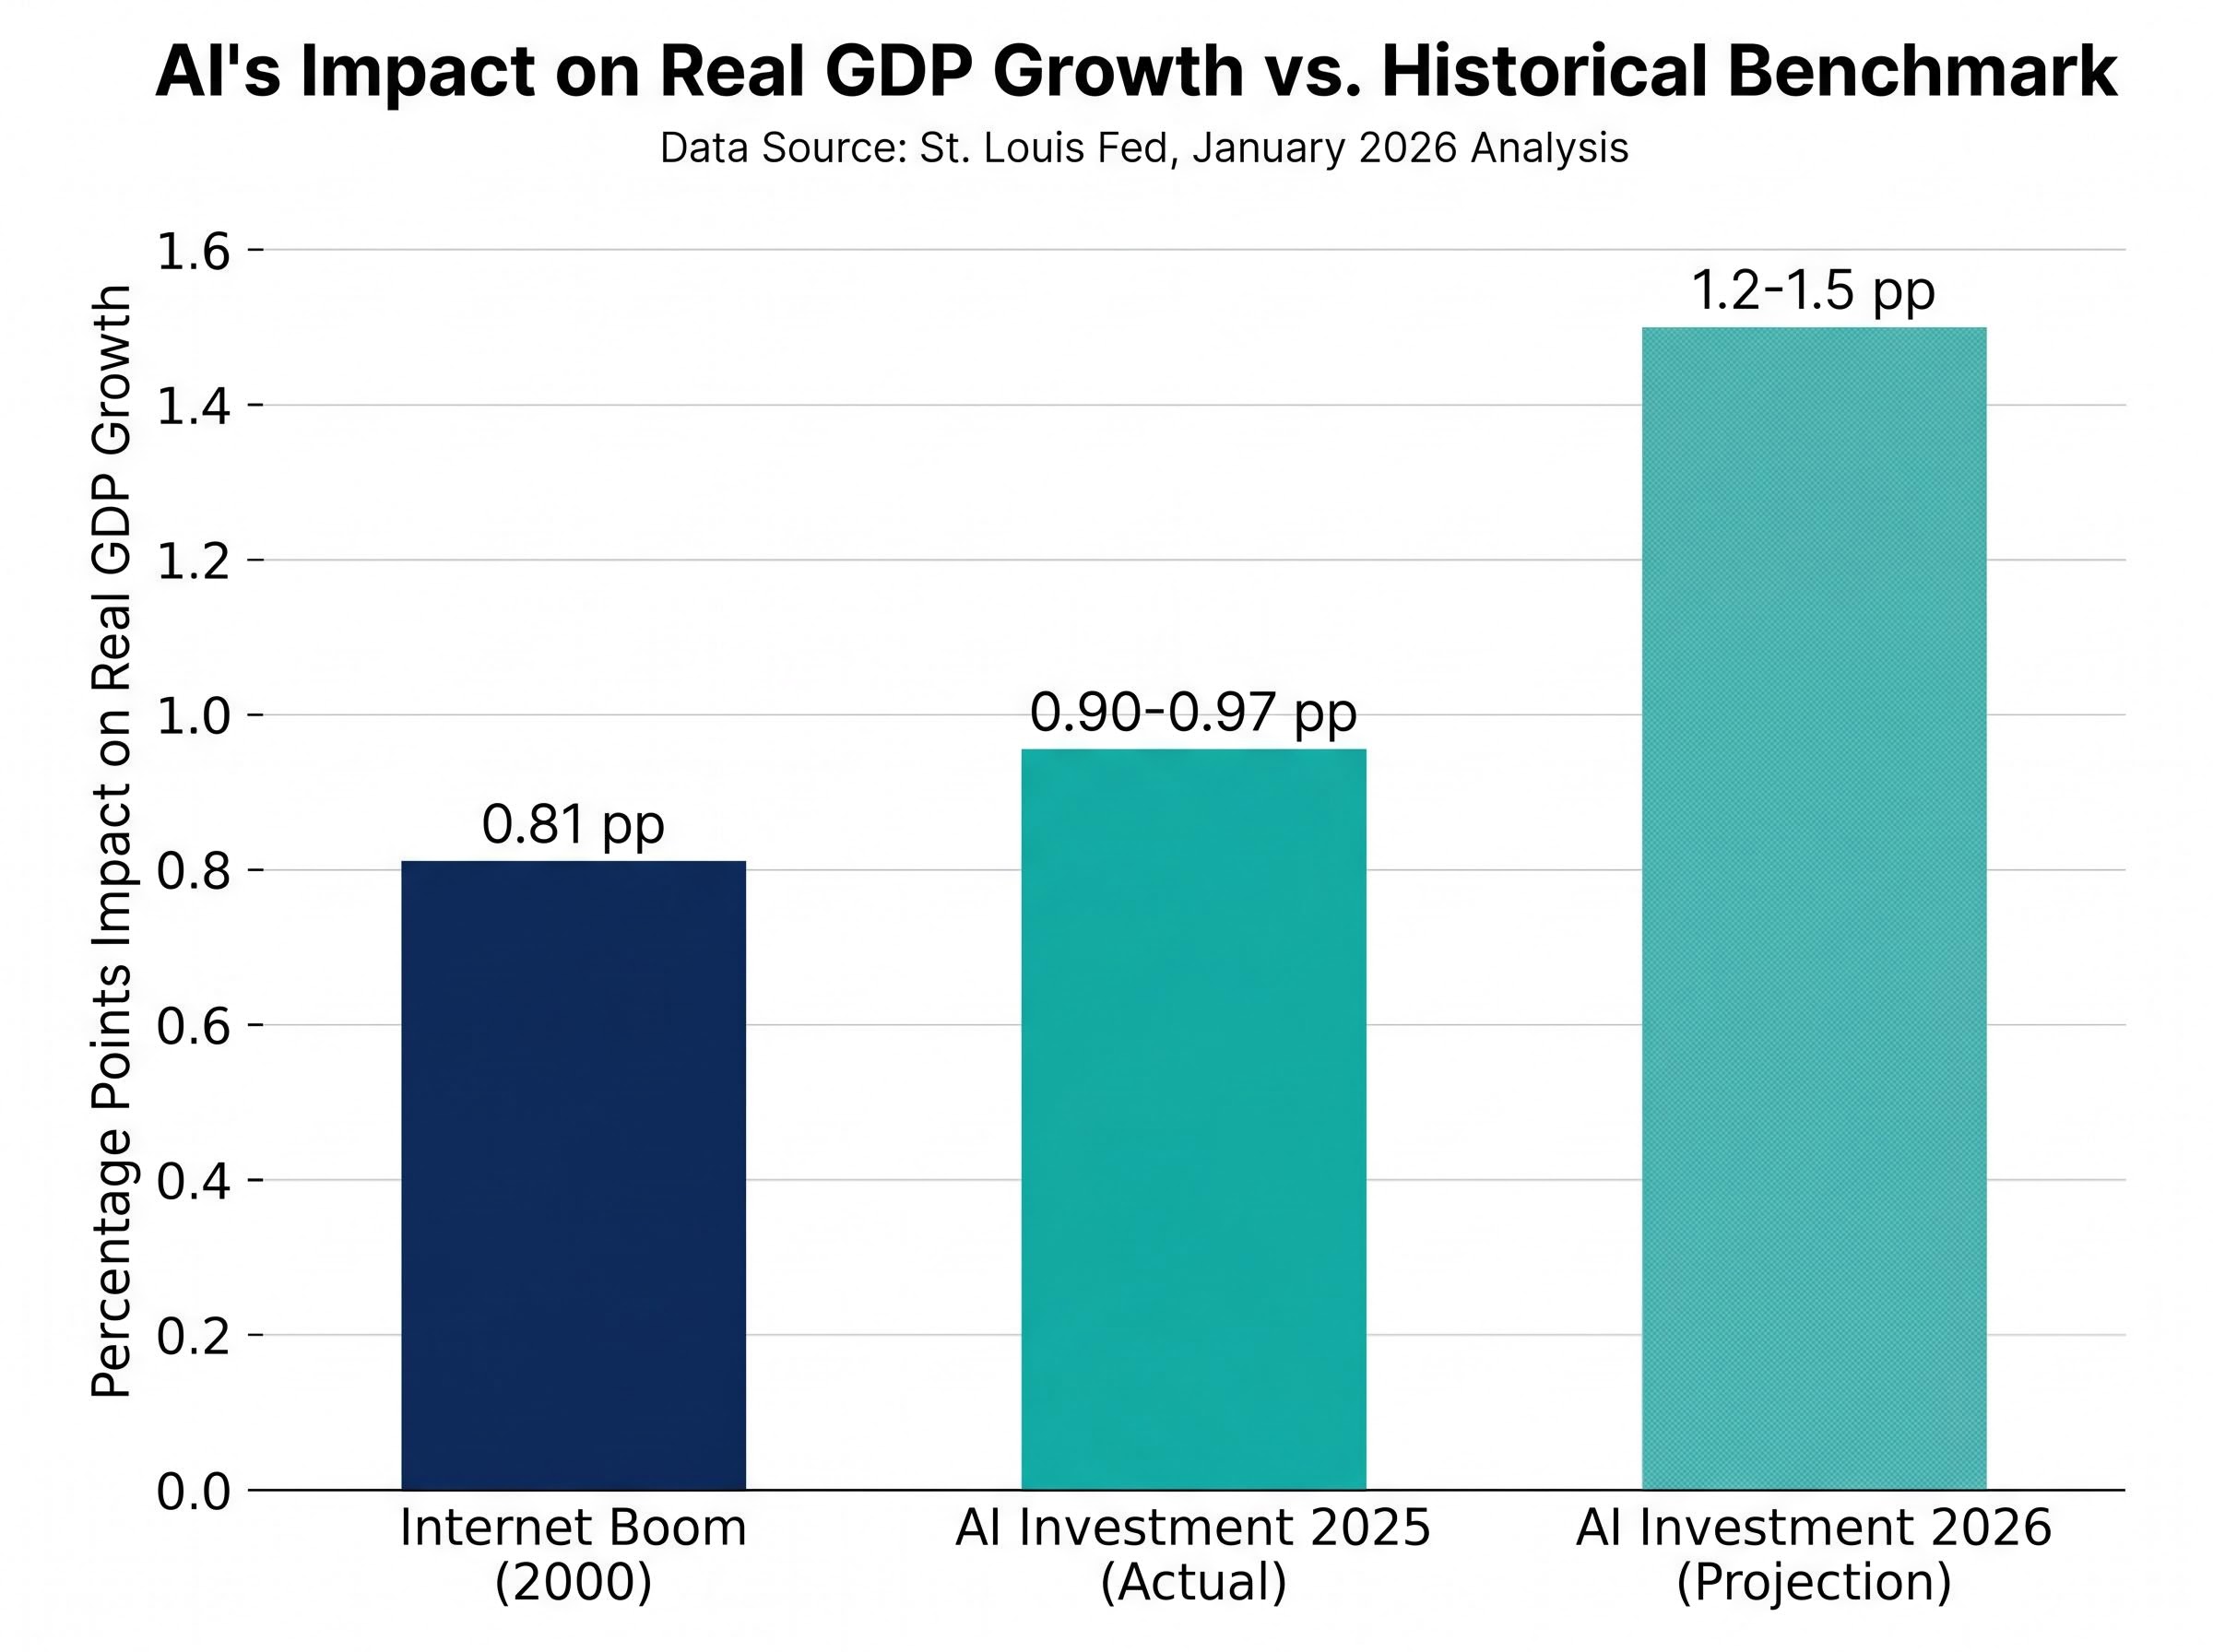
The finding was striking. AI-category investments contributed an estimated 0.90-0.97 percentage points to real GDP growth across the first three quarters of 2025. That figure exceeds the internet boom era’s estimated 0.81 percentage point contribution around 2000.
The St. Louis Fed’s January 2026 analysis found that AI-category investments already exceed the internet boom era’s estimated GDP contribution, a benchmark that had stood for over two decades.
Looking forward, the St. Louis Fed projects a 1.2-1.5 percentage point contribution for full-year 2026 if capital expenditure growth sustains at current levels. Gartner forecasts global AI spending at $2.52 trillion in 2026, representing 44% year-over-year growth. With the US share at approximately 40% (over $1 trillion), the implied direct GDP addition via investment multiplier effects sits in the 1-1.5 percentage point range, consistent with the St. Louis Fed’s projection.
| Era | Estimated GDP contribution (pp) | Key investment category |
|---|---|---|
| Internet boom 2000 | 0.81 | Internet infrastructure |
| AI investment 2025 (actual) | 0.90-0.97 | Cloud servers, GPUs, software |
| AI investment 2026 (projection) | 1.2-1.5 | Data centres, AI hardware, software |
The internet boom comparison is not rhetorical. It is the closest historical analogue for an infrastructure investment wave of this scale, and the St. Louis Fed’s data confirms the current wave has already passed that benchmark.
How hyperscaler earnings validated the investment thesis in real time
The macro accounting framework tells one story. Corporate revenue tells another, and in Q1 2026, they converged.
Hyperscaler earnings reports delivered broad beats across all four major cloud and AI infrastructure platforms, with revenue acceleration indicating that AI infrastructure investment is supply-constrained rather than demand-constrained, the distinction that separates a sustainable build-out from an overcapacity scenario.
| Company | Cloud/AI segment | Q1 2026 result | vs. estimate |
|---|---|---|---|
| Microsoft | Azure | +40% YoY growth | Beat |
| Alphabet | Google Cloud | +63% YoY growth | Beat |
| Amazon | AWS revenue | $37.6B (+28% YoY) | Beat ($36.64B est.) |
| Meta | Total revenue | $56.31B (+33% YoY) | Beat ($55.45B est.) |
Alphabet CEO Sundar Pichai stated that demand outstrips supply. Microsoft management noted explicit capacity constraints on Azure. Alphabet’s Gemini API reached an estimated annualised revenue of approximately $15 billion, up from approximately $9 billion the prior quarter, according to Morningstar estimates. Meta posted its fastest revenue growth since 2021.
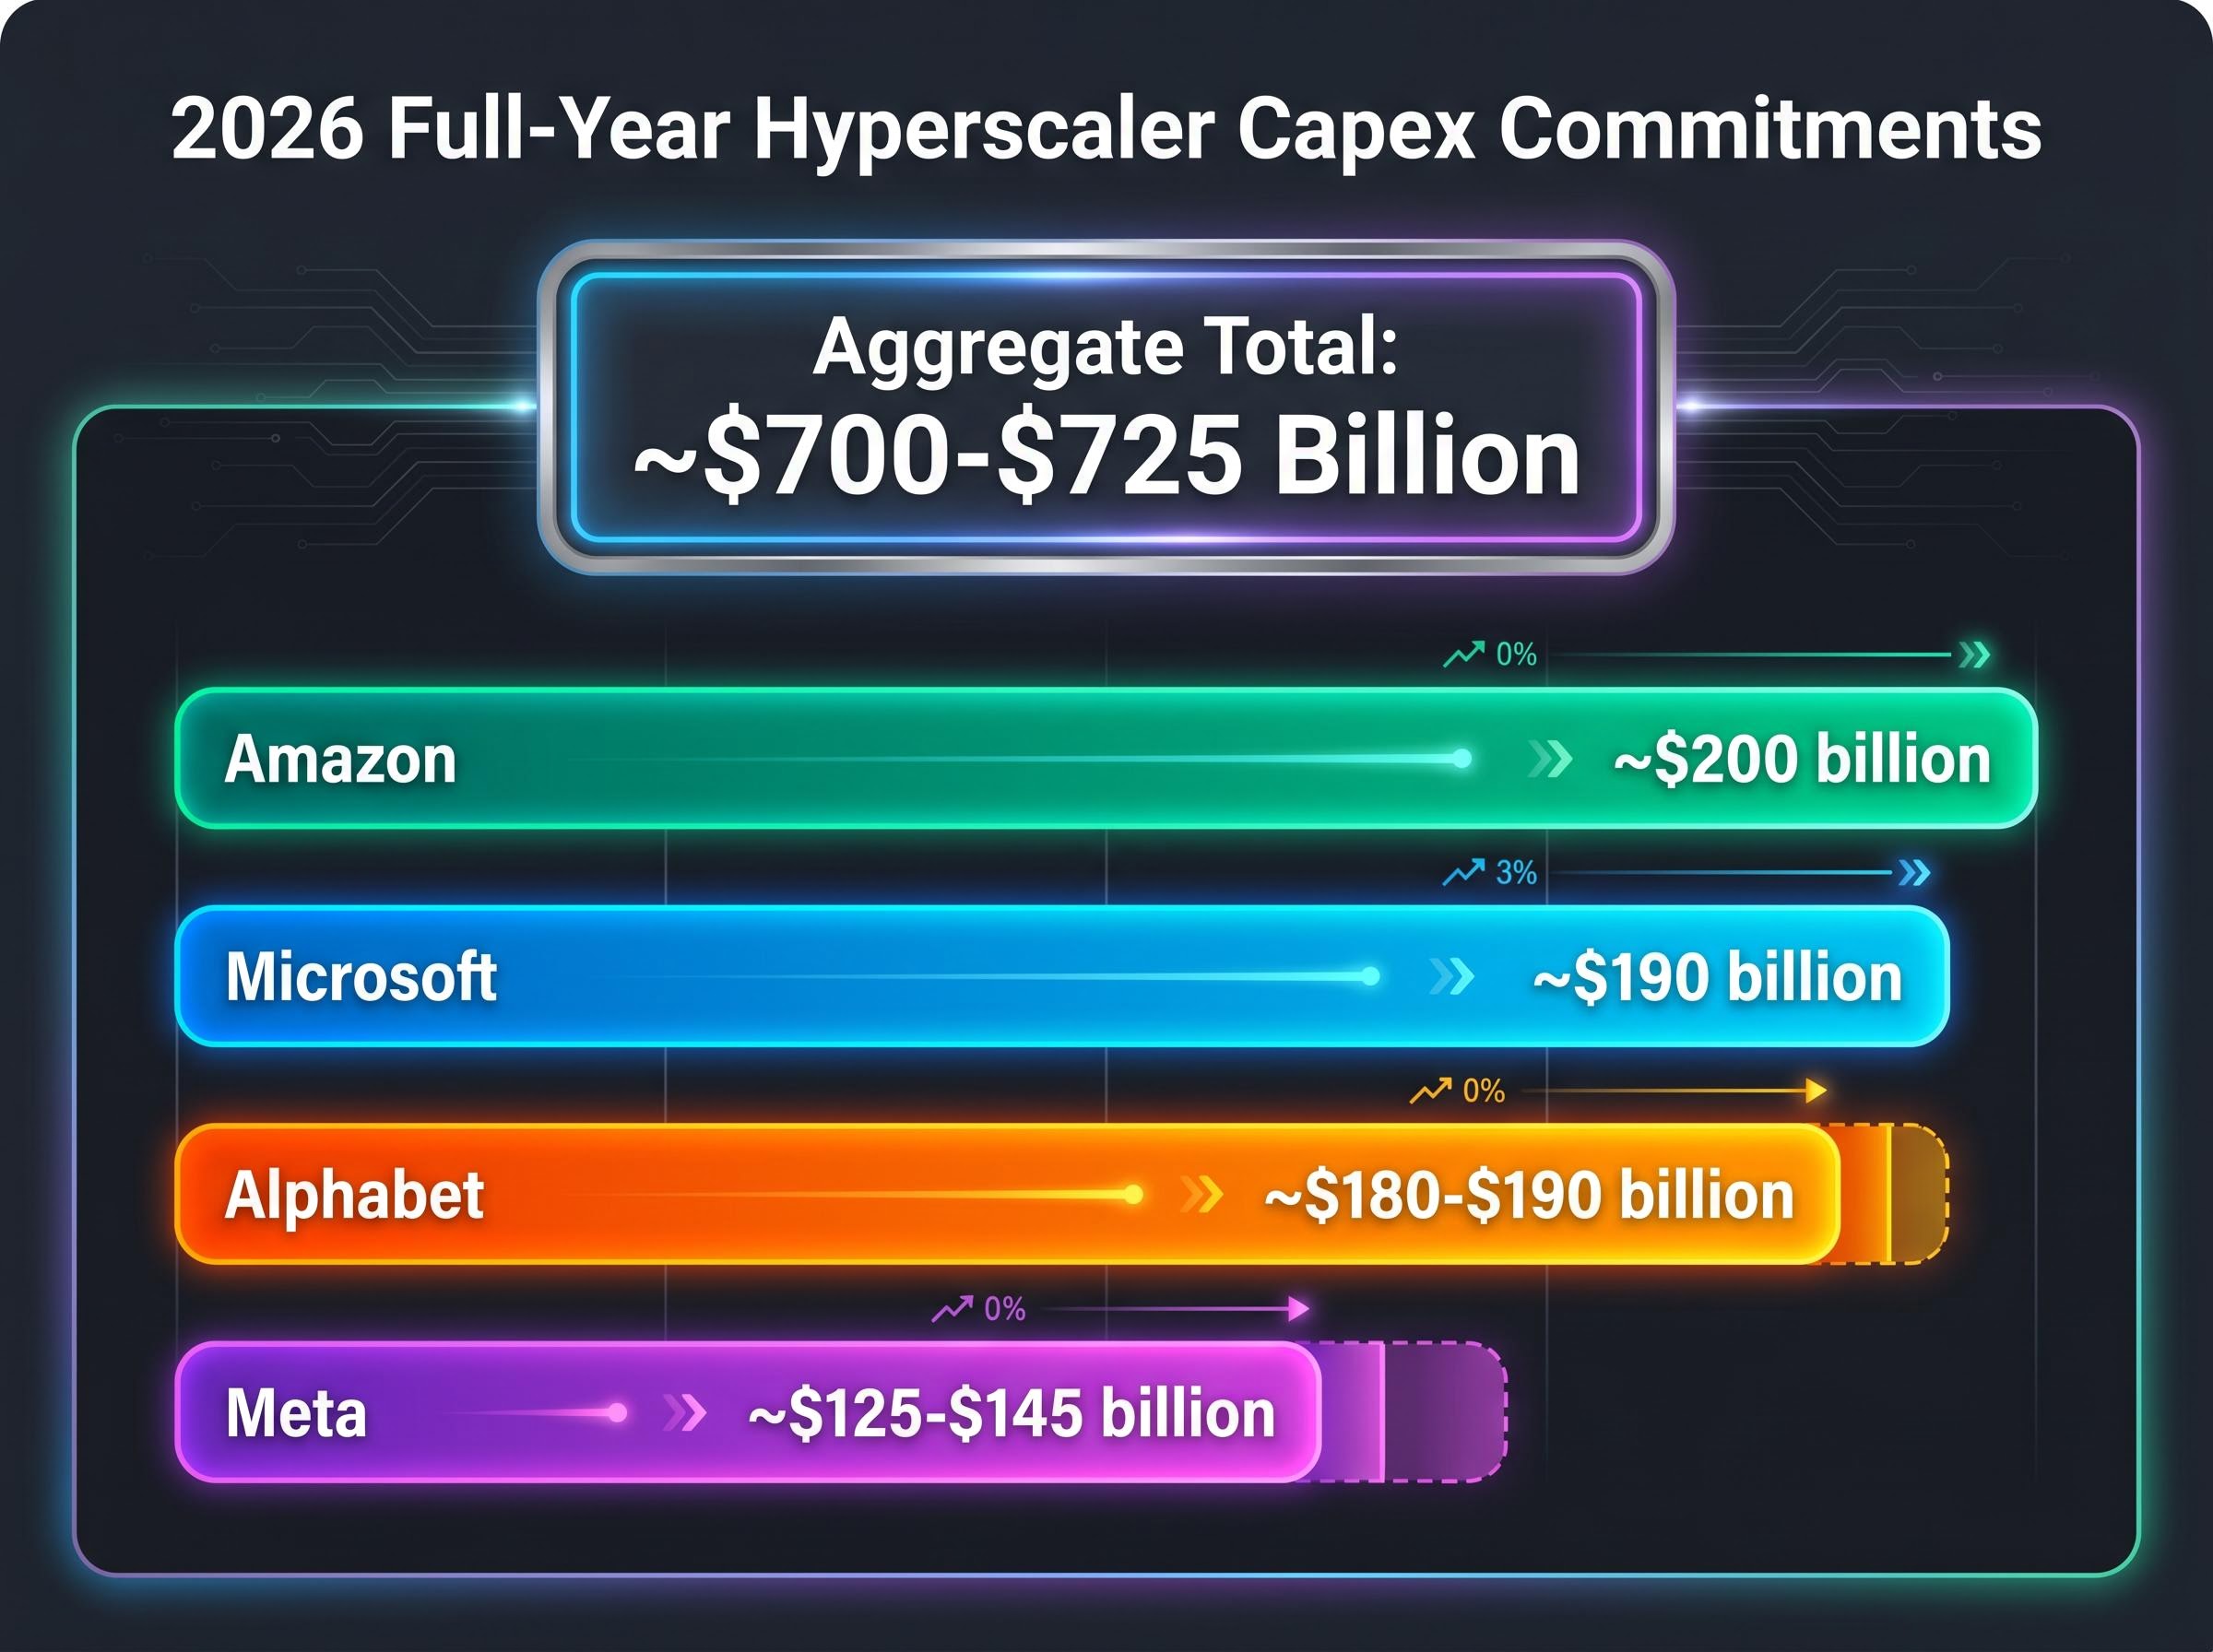
The combined 2026 full-year capex commitments from all four hyperscalers reinforce the forward trajectory:
- Amazon: approximately $200 billion
- Microsoft: approximately $190 billion
- Alphabet: approximately $180-$190 billion
- Meta: approximately $125-$145 billion
The aggregate, approximately $700-$725 billion, represents a substantial upward revision from earlier estimates. Revenue acceleration alongside management commentary about supply constraints shifts the narrative from speculative build-out to revenue-validated infrastructure investment. The “build it and they won’t come” thesis weakened considerably under the weight of these numbers.
Debt-funded capex sustainability is a structural question sitting beneath the revenue-beat headlines: hyperscalers issued approximately $121 billion in debt in 2025, roughly four times the five-year average, with another $100 billion projected for 2026, a financing pattern that introduces balance sheet risk even as quarterly revenue figures continue to accelerate.
The risks that make the AI investment story more complicated than the headline suggests
The evidence for sustained AI infrastructure spending is strong. The evidence for a frictionless path is not.
Accounting risks that persist regardless of investment scale
The import offset mechanism described earlier is a permanent feature of BEA methodology. Even if AI hardware investment doubles, the net GDP credit will continue to be reduced by the import component. This creates a systematic gap between actual investment activity and official GDP attribution that will not self-correct under current measurement conventions.
Investors monitoring official GDP releases as a proxy for AI investment momentum should expect the official figures to structurally lag the actual activity.
Macroeconomic headwinds that could slow the cycle
Three operative risks bear on whether the investment cycle sustains its current pace through 2026:
- Consumer spending deceleration: Growth slowed to 1.6% in Q1 2026, down from 3.5% in Q3 2025. The personal savings rate sat at approximately 4.0% in February and approximately 4.5% in January, indicating household financial pressure.
- Tariff uncertainty: Trade policy friction is adding costs to hardware supply chains, with potential implications for both hyperscaler capex budgets and import-driven GDP drag.
- Energy cost pressures: Middle East conflict, including Iran-related disruptions, has driven energy price increases relevant to data centre operating costs.
Nonresidential structures declined for nine consecutive quarters through Q1 2026, per Reuters reporting on 30 April 2026, a reminder that the broader investment picture outside technology is not uniformly positive.
None of these headwinds currently appear in St. Louis Fed or BEA projections as sufficiently large to reverse the AI capex trend. Each could, however, compress margins at the hyperscaler level and reduce the pace of future commitment.
Note: A claim circulated by KuCoin, a cryptocurrency exchange, suggesting AI investments represented 75% of Q1 2026 GDP growth could not be confirmed through authoritative sources and should not be used as a reference point.
What the numbers mean for investors evaluating AI-exposed equities right now
The analysis above produces three specific monitoring signals investors can apply to incoming data:
- BEA equipment subcategory tracking: The information processing equipment subcategory in quarterly GDP releases functions as a leading indicator of AI infrastructure momentum. The current benchmark is 24% year-over-year growth. Deceleration below that threshold in future quarters would signal a pace change.
- Hyperscaler earnings: revenue growth vs. capacity commentary. Revenue beats alone are insufficient. The combination of accelerating revenue growth and management commentary about supply constraints is the signal that the investment cycle is demand-driven. If future quarters show revenue growth without capacity pressure, the supply-demand balance may be shifting.
- NIST regulatory clarity as an enterprise adoption signal. The US AI Safety Institute’s 2026 guidelines reduce regulatory uncertainty for enterprise AI deployment. NIST estimates that safe AI innovation frameworks could add approximately $500 billion to US GDP by 2030 by expanding adoption timelines and reducing deployment friction.
The NIST AI Risk Management Framework, updated with a critical infrastructure profile in April 2026, provides the operational governance structure that enterprise buyers reference when evaluating deployment timelines, making its adoption curve a leading indicator of the broader AI diffusion that underpins longer-horizon productivity projections.
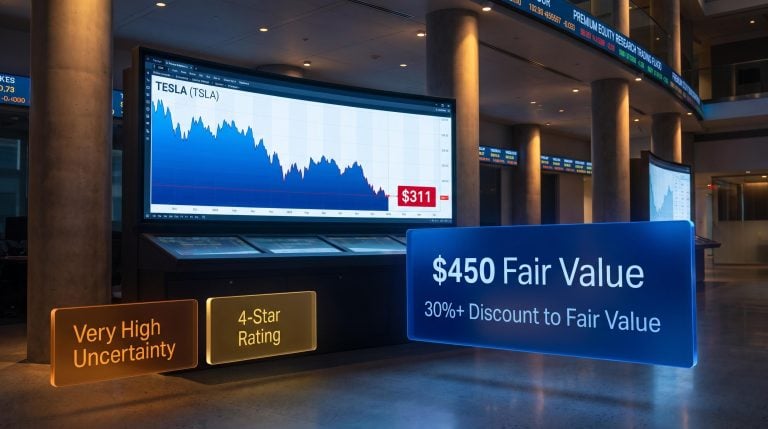
The Magnificent Seven currently trade at approximately 30-40x forward earnings, reflecting investor conviction that AI infrastructure spending will sustain revenue growth. Post-earnings stock performance as of 1 May 2026 showed differentiation: Meta gained 13.25%, Microsoft added 5.32%, Alphabet rose 3.30%, Apple slipped 0.46%, and Amazon fell 7.05%.
The hardware-software divergence inside the technology sector in 2026 runs deeper than individual stock moves suggest: the Morningstar Global Semiconductor Equipment index gained 47.6% year-to-date while the Software Applications index fell 22.7%, a 70-percentage-point spread that reflects the same import-heavy, equipment-intensive investment cycle captured in BEA’s information processing equipment subcategory.
McKinsey Global Institute estimates AI adoption could drive productivity gains of approximately 1.5% annually through 2030, a distinct channel from the investment-side GDP contribution that captures output-per-worker improvements as AI diffuses across the broader economy.
The gap between the investment-side GDP contribution (measurable now through equipment and software spending) and the productivity-side GDP contribution (which accrues as AI deployment matures) is the central valuation question for AI-exposed equities. Investors who can distinguish between these two channels are better positioned to evaluate whether current multiples reflect justified forward pricing or premature optimism.
This article is for informational purposes only and should not be considered financial advice. Investors should conduct their own research and consult with financial professionals before making investment decisions. Past performance does not guarantee future results. Financial projections referenced in this analysis are subject to market conditions and various risk factors.
AI’s economic footprint is real, measurable, and still being undercounted
High-tech categories contributed approximately 1 percentage point to Q1 2026 GDP growth. The St. Louis Fed’s custom tracking shows AI-specific investment already exceeding the internet boom era’s GDP contribution, with a projected 1.2-1.5 percentage point contribution for full-year 2026 if capex growth sustains. Hyperscaler earnings validated the demand side of the thesis with revenue acceleration and explicit supply constraints across all four major platforms.
The official data methodology, however, systematically underrepresents the investment already occurring. Import accounting conventions suppress the equipment contribution, BEA categories do not isolate AI from broader IT, and the result is a conservative picture that lags the actual activity.
Investors who understand this measurement gap are better positioned to interpret future BEA releases, Fed commentary on productivity, and hyperscaler earnings guidance as a connected system rather than separate data points. The outstanding question is whether the productivity gains, the longer-horizon payoff that McKinsey estimates at 1.5% annually through 2030, will materialise at the scale that current equity valuations imply. The investment-side evidence is now substantial. The productivity-side evidence remains ahead of the data.
For investors wanting to model the productivity-side GDP contribution in more detail, our full explainer on AI labour market exposure examines Bank of America’s finding that 838 million jobs carry meaningful generative AI exposure, the distributional pressure already visible in 2026 wage data, and the equity implications for sectors where margin expansion from AI adoption may be partially offset by consumer spending headwinds.