
BOQ Pays 6.39% Fully Franked, but the Risks Are Real
1 min ago

New single-family home sales fell 17.6% in a single month at the start of 2026, the steepest monthly decline since 2013. Total existing home sales for 2025 came in as the weakest annual result since 1995. By the logic of most housing headlines, the US housing market and economy should be moving in lockstep toward contraction. With the US Census Bureau scheduled to release new residential sales figures for February and March 2026 on Tuesday, 5 May 2026, the housing market is back under the spotlight. The question facing investors is not whether housing is weak. It clearly is. The question is whether that weakness transmits meaningfully to the broader economy and equity markets, or whether the slump remains a well-documented sector headwind that has already been absorbed. What follows draws on the latest GDP, equity, mortgage, and inventory data to separate signal from noise.
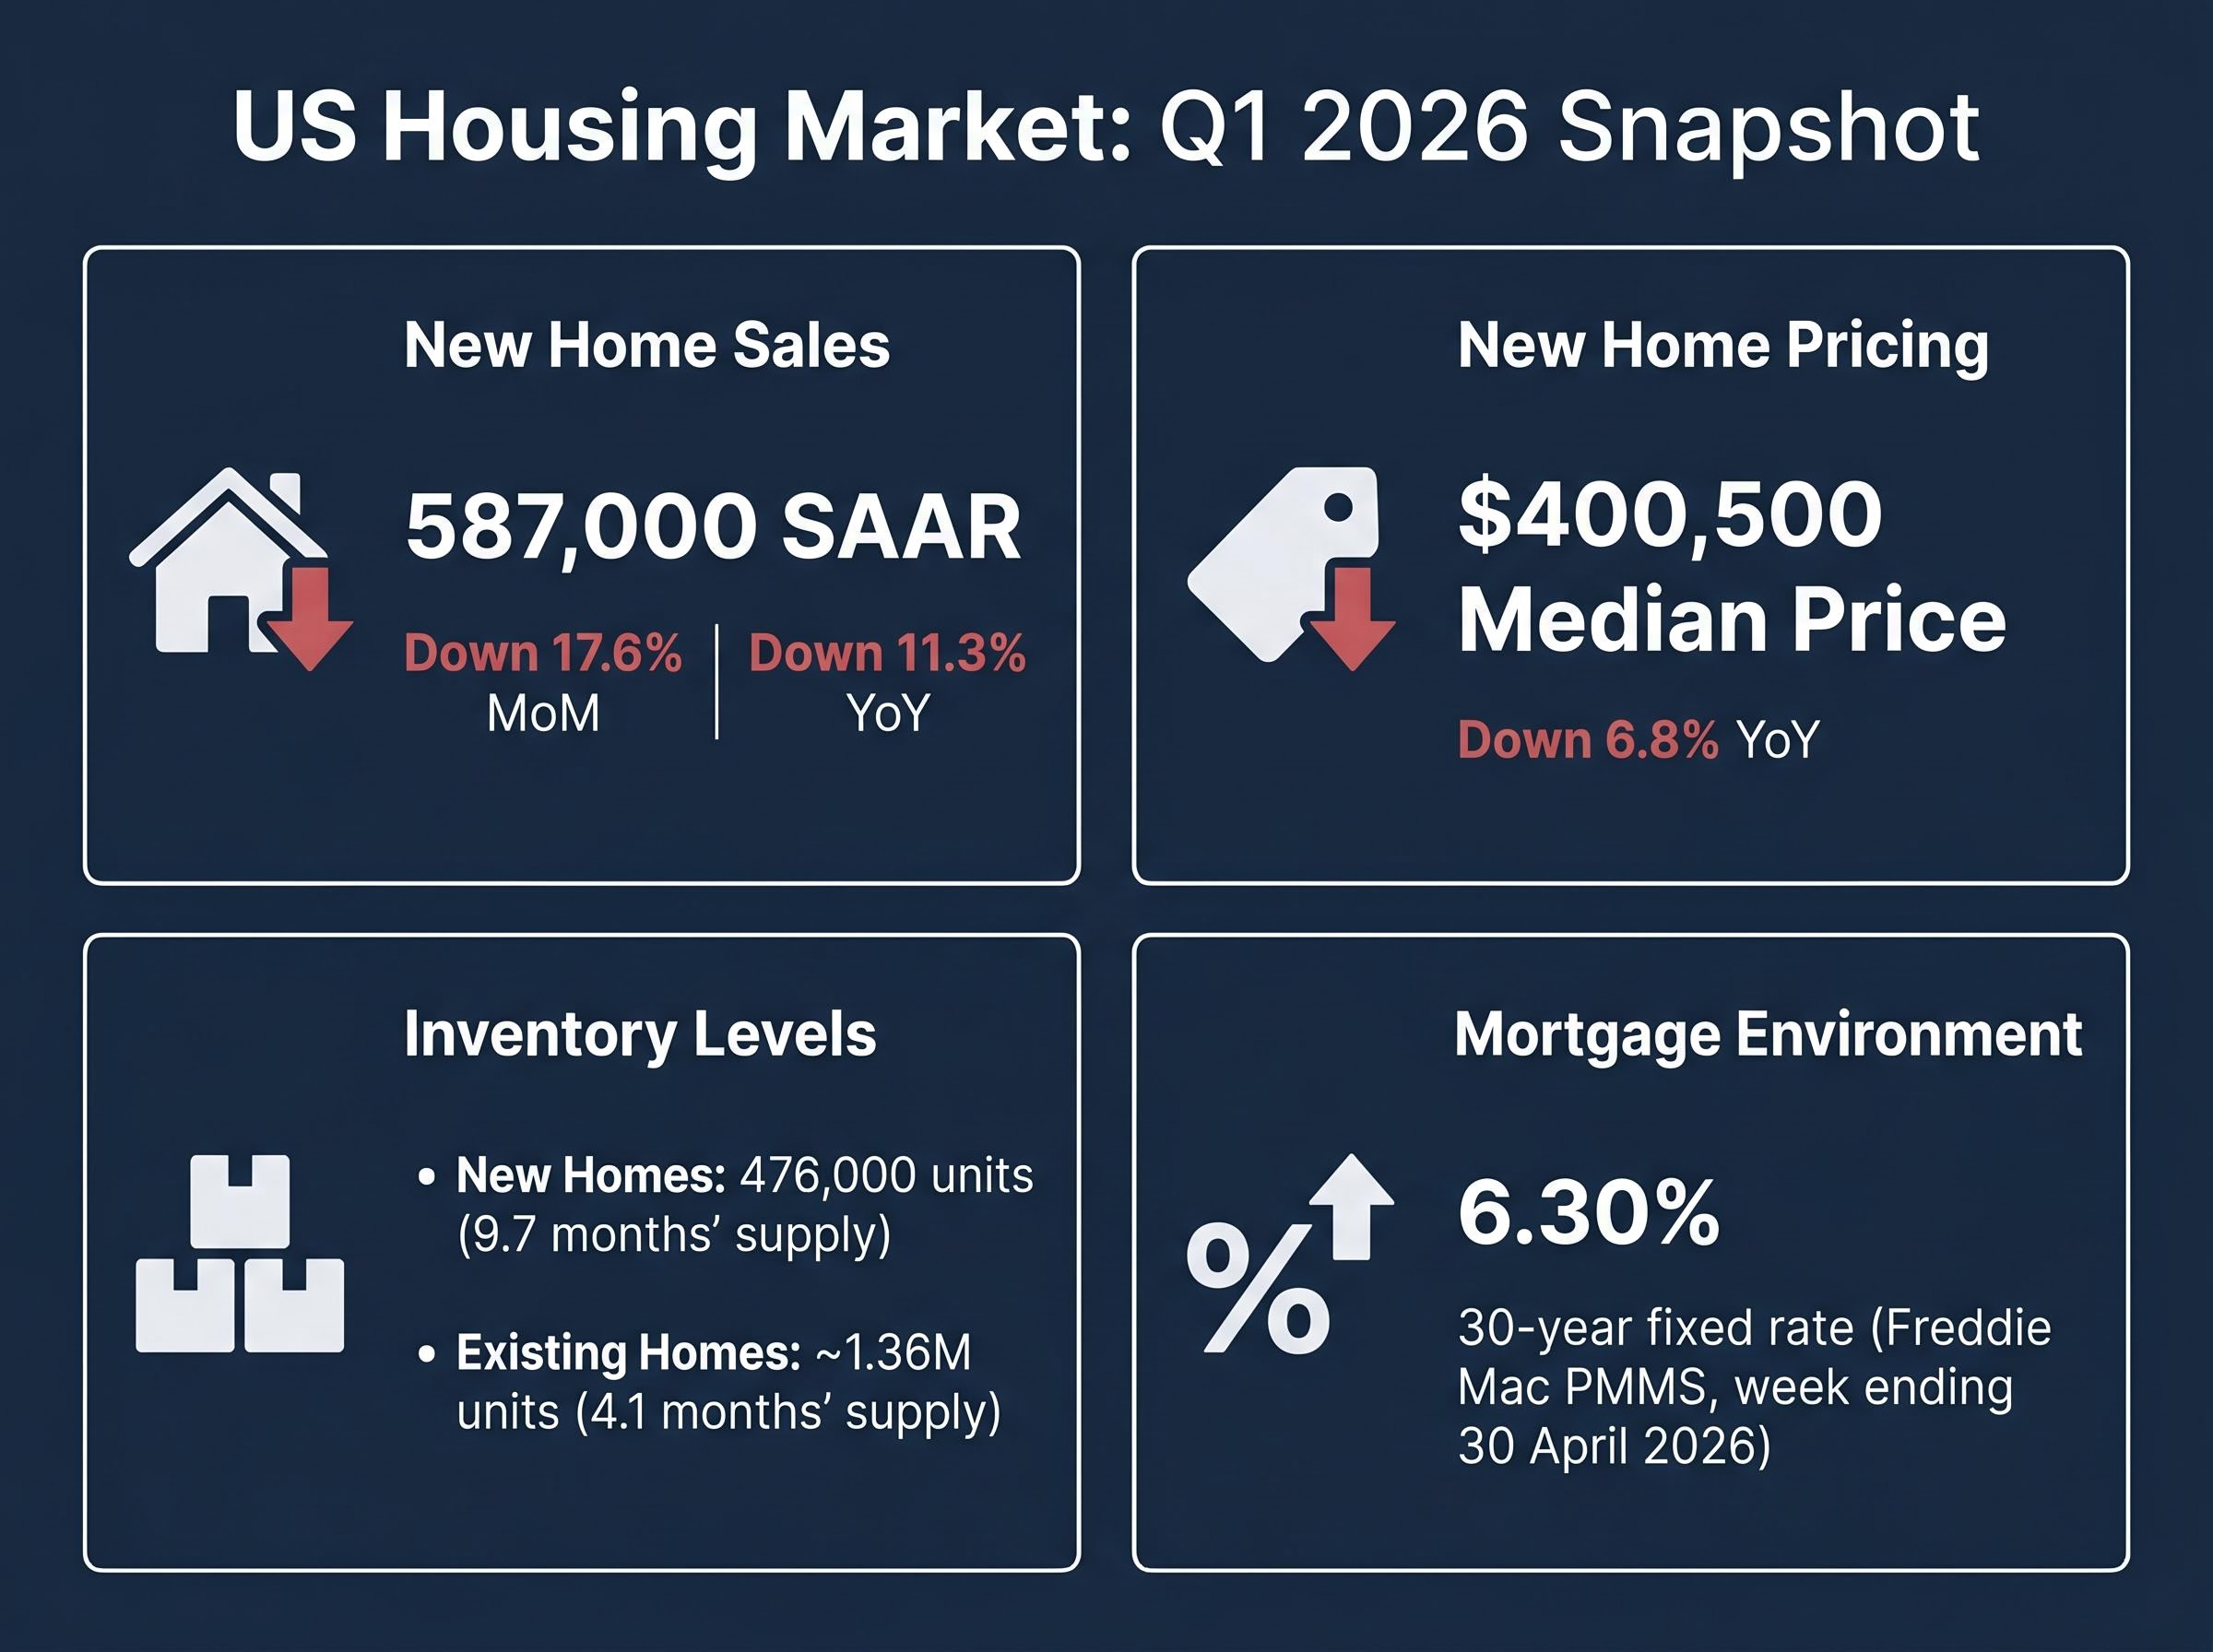
The Census Bureau’s January 2026 release, published on 19 March 2026, left little room for soft interpretation. New single-family home sales came in at 587,000 units on a seasonally adjusted annual rate (SAAR) basis, down 17.6% from December and 11.3% year-over-year.
The 17.6% monthly decline in January was the steepest single-month drop in new home sales since 2013.
The inventory picture reinforced the weakness. New homes on the market reached 476,000 units, translating to 9.7 months’ supply at the current sales pace, a level historically associated with builder-side pricing pressure and forced concessions. The median new home sales price fell to $400,500, down 6.8% year-over-year.
The existing home market offered no relief. The National Association of Realtors (NAR) reported approximately 1.36 million units of existing home inventory as of March 2026 (released 13 April 2026), representing 4.1 months’ supply. Full-year 2025 existing home sales barely exceeded 4 million units, the worst annual total in three decades.
Key January 2026 data points:
These are not contested estimates. They are hard census data. Any analysis of housing’s economic impact needs to begin by giving these figures their full weight.
The Census Bureau new residential sales methodology uses SAAR adjustments to smooth seasonal variation, which is why single-month readings like January’s 587,000-unit figure can look more dramatic in isolation than they appear when placed against the underlying trend.
Housing feels enormous. For most households, a home is the largest single asset and the largest monthly expense. The intuition that a housing slump should drag down everything else is natural.
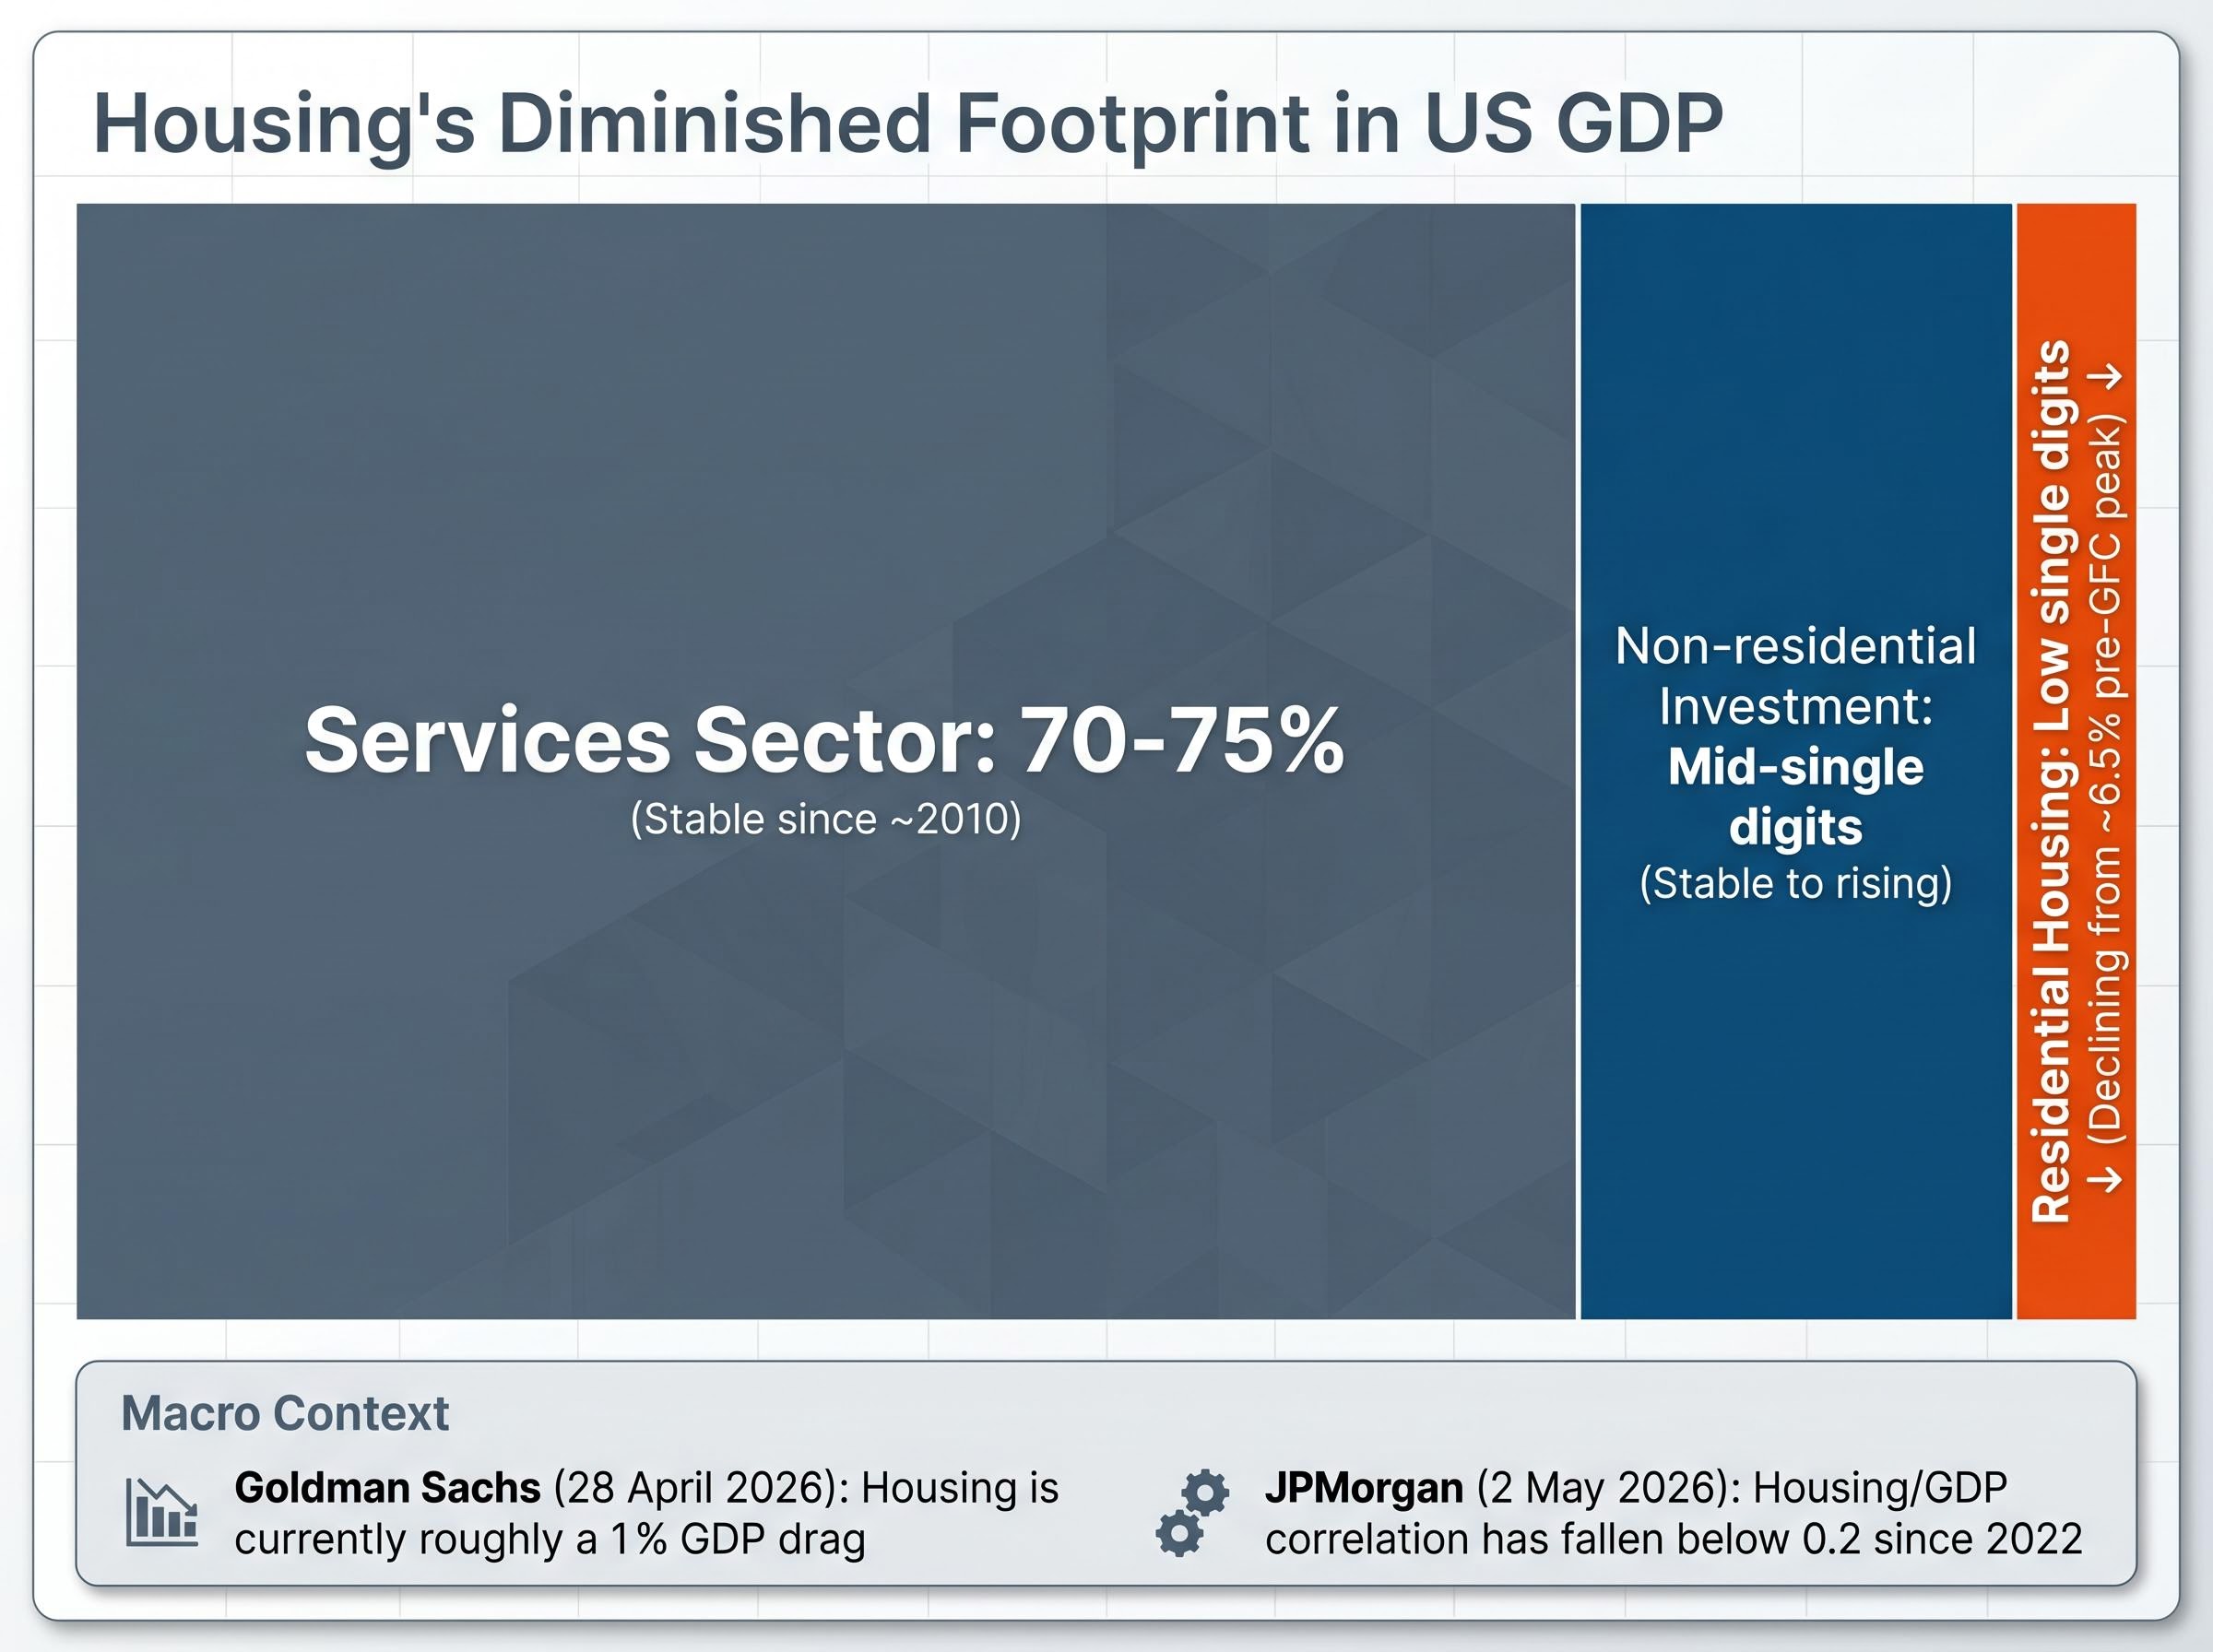
The GDP arithmetic tells a different story. Before the Global Financial Crisis (GFC), residential construction and housing-related activity peaked at approximately 6.5% of US GDP. That share has trended meaningfully lower in the years since, leaving housing’s direct contribution in the low single digits today. By contrast, the services sector has represented roughly 70-75% of US output since approximately 2010, a proportion that has remained stable regardless of housing cycles.
| Sector | GDP Share (approx.) | Trend Since GFC |
|---|---|---|
| Residential Housing | Low single digits | Declining from ~6.5% peak |
| Services | 70-75% | Stable |
| Non-residential Investment | Mid-single digits | Stable to rising |
The Bureau of Economic Analysis (BEA) advance estimate for Q1 2026, released on 30 April 2026, showed real GDP growing at a 2.0% annualised rate. Goldman Sachs estimated on 28 April 2026 that housing represents roughly a 1% GDP drag currently, meaningful but far from sufficient to overwhelm the growth contributions from services, consumer spending, and non-residential investment.
The Q1 2026 GDP composition tells a more layered story than the headline rate suggests: business fixed investment surged at 10.4% annualised, driven by AI infrastructure spending, while residential investment contracted for the seventh time in eight quarters, confirming that housing weakness is embedded in the national accounts but overwhelmed by other growth contributors.
According to JPMorgan research published on 2 May 2026, the correlation between housing performance and GDP has fallen below 0.2 since 2022, suggesting the two have become substantially decoupled.
Private sector growth momentum running at 2.2% annualised in Q1 2026, once government spending swings and import volatility are stripped out, is the structural reason housing weakness has not translated into a broader slowdown; services consumption and AI-driven business investment are carrying the economy in a way that was not available in prior housing downturns.
The 2008 analogy is the most powerful and most frequently misapplied frame in housing analysis. The GFC was not a housing-to-GDP story; it was a housing-to-finance contagion story. The mechanism was leveraged financial exposure through subprime mortgage products embedded across global balance sheets. That transmission channel is structurally different from an affordability-constrained slump in which lending standards remain intact and financial system exposure to housing credit is far more contained.
The Federal Reserve History analysis of the Great Recession documents how residential investment grew to approximately 6.5% of GDP before the GFC and then contracted sharply, establishing the historical baseline against which today’s structurally smaller housing footprint should be measured.
If housing weakness were transmitting broadly into markets, homebuilder equities would be the first and most visible casualty. The year-to-date performance data, as of approximately 1 May 2026, complicates that expectation.
| Security | YTD Return | Notes |
|---|---|---|
| XHB (Homebuilders ETF) | +2.37% | Broad homebuilder exposure |
| ITB (iShares Home Construction) | +1.33% | Construction-weighted |
| D.R. Horton (DHI) | +4.43% | Largest US homebuilder |
| Lennar (LEN) | Positive | Closing approximately $88.45 |
| S&P 500 | +6.02% | Broad market benchmark |
| Nasdaq | +9.74% | Tech/AI-driven outperformance |
Homebuilder stocks are underperforming broader indices, but they are not negative. That gap between terrible sales data and positive equity returns demands explanation. Three candidate mechanisms deserve analytical weight, ranked in descending order of explanatory strength:
The broader market context confirms the economy’s growth engine has shifted. The Nasdaq’s 9.74% year-to-date gain, driven by AI and services-sector strength, reflects where capital is flowing. That concentration does not require homebuilder collapse for the story to hold; it simply reveals where the economy’s momentum resides.
The housing slump has been a headline fixture since mortgage rates surged past 6% in late 2022. Every quarterly sales report has generated coverage. Every affordability metric has been scrutinised. The problem is visible, documented, and widely discussed.
That visibility is itself analytically significant. Markets are efficient at pricing widely documented risks over time. The same data that dominates housing headlines has diminishing incremental power to move equity prices precisely because it has been public knowledge for years. The danger of a known risk is not its severity; it is its capacity to surprise. Housing has almost exhausted that capacity.
The contrast with 2008 is instructive. The GFC’s contagion mechanism, subprime exposure embedded in complex leveraged financial products, was not widely understood in advance. When the market finally recognised the scale of the exposure, the repricing was violent because the risk had been hidden, not because housing was weak. Today’s housing slump is the opposite: the weakness is perfectly visible, and no comparable hidden transmission channel has been identified.
The degree of agreement across institutions is itself analytically meaningful.
Approximately 80% of surveyed economists, per a Wall Street Journal economist survey framing from around 1 May 2026, characterise the housing situation as contained rather than systemic. Goldman Sachs assigned approximately 70% probability to a soft-landing scenario on 28 April 2026. BofA strategist Savita Subramanian described housing weakness as noise for the S&P 500 on 30 April 2026, characterising cyclicals as decoupled from housing performance. NAR Chief Economist Lawrence Yun framed the situation on 22 April 2026 as an affordability bottleneck rather than systemic risk, projecting 4% price growth for H2 2026.
Dallas Fed President Lorie Logan stated on 18 April 2026 that the housing drag was localised, citing services and non-residential investment as compensating factors. No broad recession signal was identified.
The convergence matters more than any individual forecast. When consensus is this tight, the analytical bar for a housing-driven macro disruption rises considerably.
The contained-risk thesis is not unconditional. Three specific transmission channels could invalidate it, and each deserves identification rather than dismissal.
Consumer spending concentration among affluent households is one of the structural vulnerabilities that the GDP headline obscures, with the US personal savings rate at 4.0% in February 2026 and mass-market spending showing signs of decay beneath strong aggregate retail figures, a dynamic that complicates any simple read of the economy as resilient.
Cotality’s Selma Hepp warned on 10 April 2026 that the affordability ceiling risks broader demand destruction that extends well beyond the housing sector itself.
First American research published on 24 April 2026 expected national house price growth to accelerate modestly on spring demand, but acknowledged the affordability ceiling persists. The conditions that would flip the contained-risk thesis are identifiable. Investors who monitor rate trajectory, affordability ratios, and inventory levels are watching the right variables.
The Census Bureau is scheduled to release February and March 2026 new residential sales data on Tuesday, 5 May 2026. No verified data for either month has been published as of early May 2026, making this release the first opportunity to confirm or challenge the trajectory set by January’s figures.
The January baseline provides the interpretive frame. Sales hit 587,000 SAAR with a 17.6% monthly decline, 9.7 months’ supply, and a median price down 6.8% year-over-year. A continued weak reading would confirm that the slump is durable, but given that January was already extreme, it would not constitute a new shock unless it materially exceeded that decline. A modest stabilisation, even one that leaves sales well below 2024 levels, could be read as the floor holding rather than the bottom dropping out.
NAR projects approximately 4 million existing home sales for full-year 2026, roughly flat year-over-year. The 30-year fixed rate sits at 6.30%, down from 6.76% a year ago. The rate direction matters as much as the sales direction.
The housing slump is real, durable, and painful for participants in the sector. The data in this analysis leaves no room for dismissal: sales at their lowest pace in a decade, inventory at levels associated with builder distress, and affordability near a ceiling that constrains demand.
The structural footprint of that slump in the broader economy, however, is too small and its problems too well-known to constitute a systemic market risk absent a new transmission mechanism. Housing’s GDP share has shrunk since the GFC. Homebuilder equities are positive year-to-date. Roughly 80% of surveyed economists characterise the situation as contained. The Fed, Goldman Sachs, JPMorgan, and BofA have all reached variations of the same conclusion.
The appropriate response differs by exposure. Housing-sector investors face a period requiring greater vigilance, closer monitoring of affordability and inventory data, and careful attention to the conditions outlined above that could invalidate the contained thesis. Broad equity investors face a different calculus: maintaining analytical discipline and resisting headline-driven repositioning in response to data that markets have already absorbed.
The 5 May release will update the picture. It is unlikely to resolve the underlying tension between structural weakness and macroeconomic resilience. This is a slow-moving story, not a binary event.
This article is for informational purposes only and should not be considered financial advice. Investors should conduct their own research and consult with financial professionals before making investment decisions. Past performance does not guarantee future results. Financial projections referenced in this analysis are subject to market conditions and various risk factors.
—
The US housing market is in a significant slump, with new single-family home sales falling 17.6% in January 2026 to 587,000 units on a seasonally adjusted annual rate basis, the steepest monthly decline since 2013, while full-year 2025 existing home sales were the weakest annual total since 1995.
Housing's direct contribution to US GDP has shrunk to the low single digits, down from a peak of approximately 6.5% before the Global Financial Crisis, meaning the current housing slump has a far smaller GDP footprint than it did during the 2008 downturn.
Homebuilder ETFs and major builders like D.R. Horton are posting positive year-to-date returns because markets had already absorbed the known housing weakness over prior years, and purchase mortgage demand was up over 20% year-over-year in late April 2026, suggesting investors are pricing in a modest future demand recovery.
Investors should focus on three variables: whether the headline SAAR figure rises above or falls below the January baseline of 587,000 units, whether the median price decline deepens beyond 6.8% year-over-year, and whether months of supply moves above the current 9.7-month level into double-digit territory.
Most institutional forecasters consider the risk contained rather than systemic; approximately 80% of economists surveyed characterise the situation as contained, Goldman Sachs assigns roughly 70% probability to a soft landing, and JPMorgan research found the correlation between housing performance and GDP has fallen below 0.2 since 2022.