
Brazil’s Ibovespa has gained roughly 23% year-to-date through April 2026, outpacing the broader MSCI Emerging Markets Index by a wide margin and leaving the S&P 500’s approximate 5.6% return well behind. The question worth asking is not whether Brazil is outperforming, but why, and whether the structural conditions that produced this run are durable.
Most investors associate emerging market risk with energy import dependency, currency fragility, and fiscal instability. Brazil, once an example of all three, has quietly re-engineered its macroeconomic profile since achieving net oil-exporter status in 2017. That shift is now producing compounding equity market effects that are drawing record foreign inflows and prompting institutional investors to reconsider their emerging market allocation frameworks.
This analysis builds the data-backed case for why Brazil’s oil-exporter status is the structural engine behind its 2026 equity outperformance, what the capital flow evidence reveals about institutional conviction, how Brazil compares to commodity-linked peers, and where the risks to this thesis genuinely sit.
How a 2017 milestone is reshaping Brazil’s 2026 equity story
The feature of Brazil’s market that looks like a 2026 phenomenon actually has a nine-year origin story. When Brazil crossed into net oil-exporter status in 2017, the shift did not register as an equity catalyst. It was an energy policy milestone. The market implications compounded slowly, then all at once.
The Ibovespa delivered approximately 23.3% in year-to-date gains through mid-April 2026, reaching 187,318 points by 30 April 2026. Over the same window, the S&P 500 returned roughly 5.6%.
That 16-percentage-point outperformance gap versus the broader MSCI EM benchmark through mid-February 2026 is not the product of a single commodity price spike. It is the downstream expression of a structural change in how Brazil’s economy absorbs global energy shocks.
From energy importer to commodity anchor: the 2017 turning point
Net oil-exporter status means, in practice, that rising global energy prices flow into a country’s current account as revenue rather than draining it as cost. For an equity market, this reverses the risk profile: energy volatility becomes a tailwind instead of a headwind.
Brazil’s index structure amplified this advantage. The Ibovespa is commodity-heavy and bank-heavy, with significant weightings in energy, financials, materials, and utilities. When the oil-exporter shift strengthened the real, improved fiscal capacity, and boosted corporate earnings across the commodity complex, the benefit did not concentrate in one sector. Utilities led in 2025 with gains exceeding 80%. Financials and materials broadened the rally into 2026. The export-status shift produced a market-wide repricing rather than a single-sector trade.
When big ASX news breaks, our subscribers know first
What record foreign inflows reveal about institutional conviction
The capital flow data tells a sequential story of accelerating conviction, not a single data point of interest.
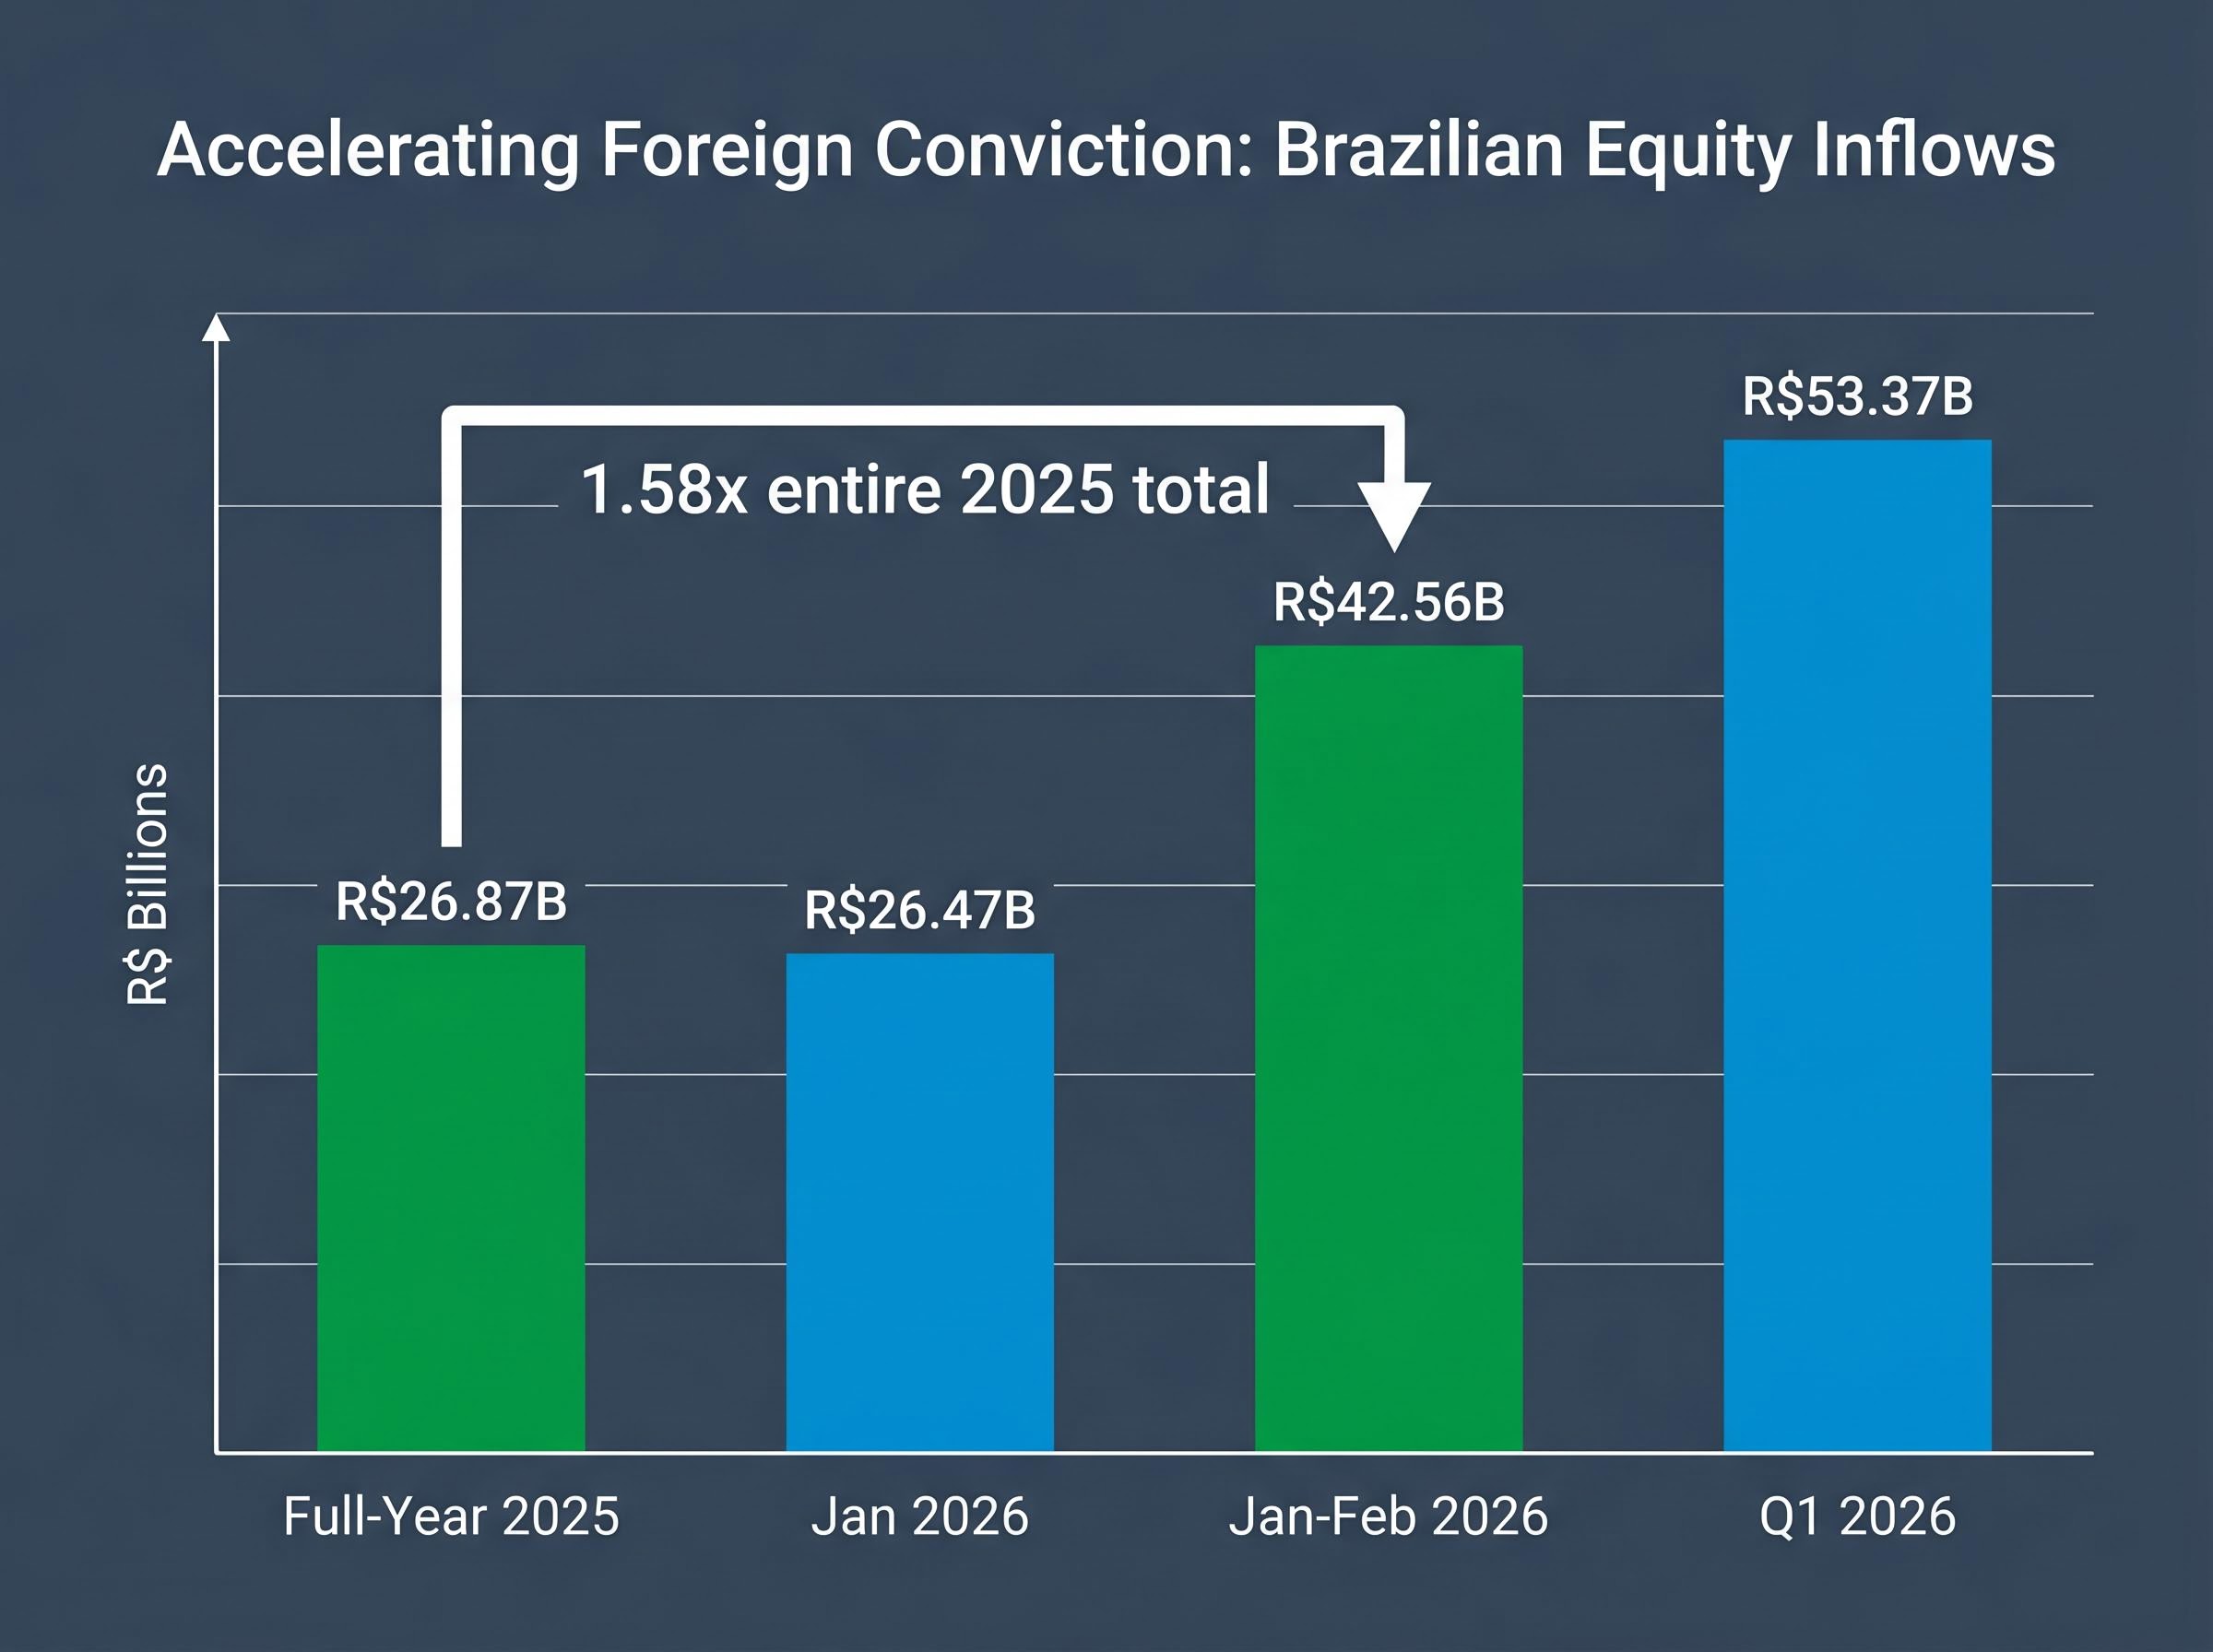
In January 2026, foreign investors directed R$26.47 billion in net inflows into Brazilian equities, the largest single month since January 2022. By the end of February, the two-month combined figure reached R$42.56 billion, approximately 1.58 times the entirety of 2025’s full-year total of R$26.87 billion.
Q1 2026 produced R$53.37 billion in net equity inflows, the strongest quarterly figure on record for Brazilian equities.
The B3 exchange Q1 2026 inflow figures reported by Brazilian financial press confirmed R$53.8 billion in net foreign institutional capital for the quarter, an independent data point that aligns with the record characterisation and establishes that the acceleration was not an artefact of a single reporting methodology.
The acceleration is more instructive than the total. Brazil-focused ETFs recorded approximately US$3.4 billion in inflows over the November 2025 to February 2026 window, equivalent to more than 20% of beginning assets under management. This ETF data provides a second, independent confirmation layer that spans a slightly different time window from the B3 exchange data.
| Period | Net Foreign Inflows | Context |
|---|---|---|
| Full-year 2025 | R$26.87B | Full 12-month baseline |
| January 2026 | R$26.47B | Largest single month since Jan 2022 |
| Jan-Feb 2026 | R$42.56B | 1.58x full-year 2025 total |
| Q1 2026 | R$53.37B | Strongest quarterly figure on record |
These inflows occurred while broader emerging markets experienced approximately $3.9 billion in weekly outflows during certain Q1 2026 periods. Domestic institutional investors, meanwhile, were net sellers at approximately -R$26.5 billion year-to-date through mid-February 2026, with retail investors also net sellers at roughly -R$5.2 billion. Foreign institutional capital was taking the other side of local risk-off sentiment, a pattern historically associated with durable inflection points in emerging markets.
Global capital rotation in the first week of May 2026 produced $23 billion in equity inflows alongside a simultaneous $11.3 billion exit from China, a geographic divergence that frames Brazil’s record Q1 inflows not as an isolated national story but as part of a broader institutional repositioning away from specific EM markets and toward commodity-linked, high-yield alternatives.
Petrobras and the production growth case for long-term positioning
The inflow data shows where capital is moving. Petrobras shows what it is moving toward.
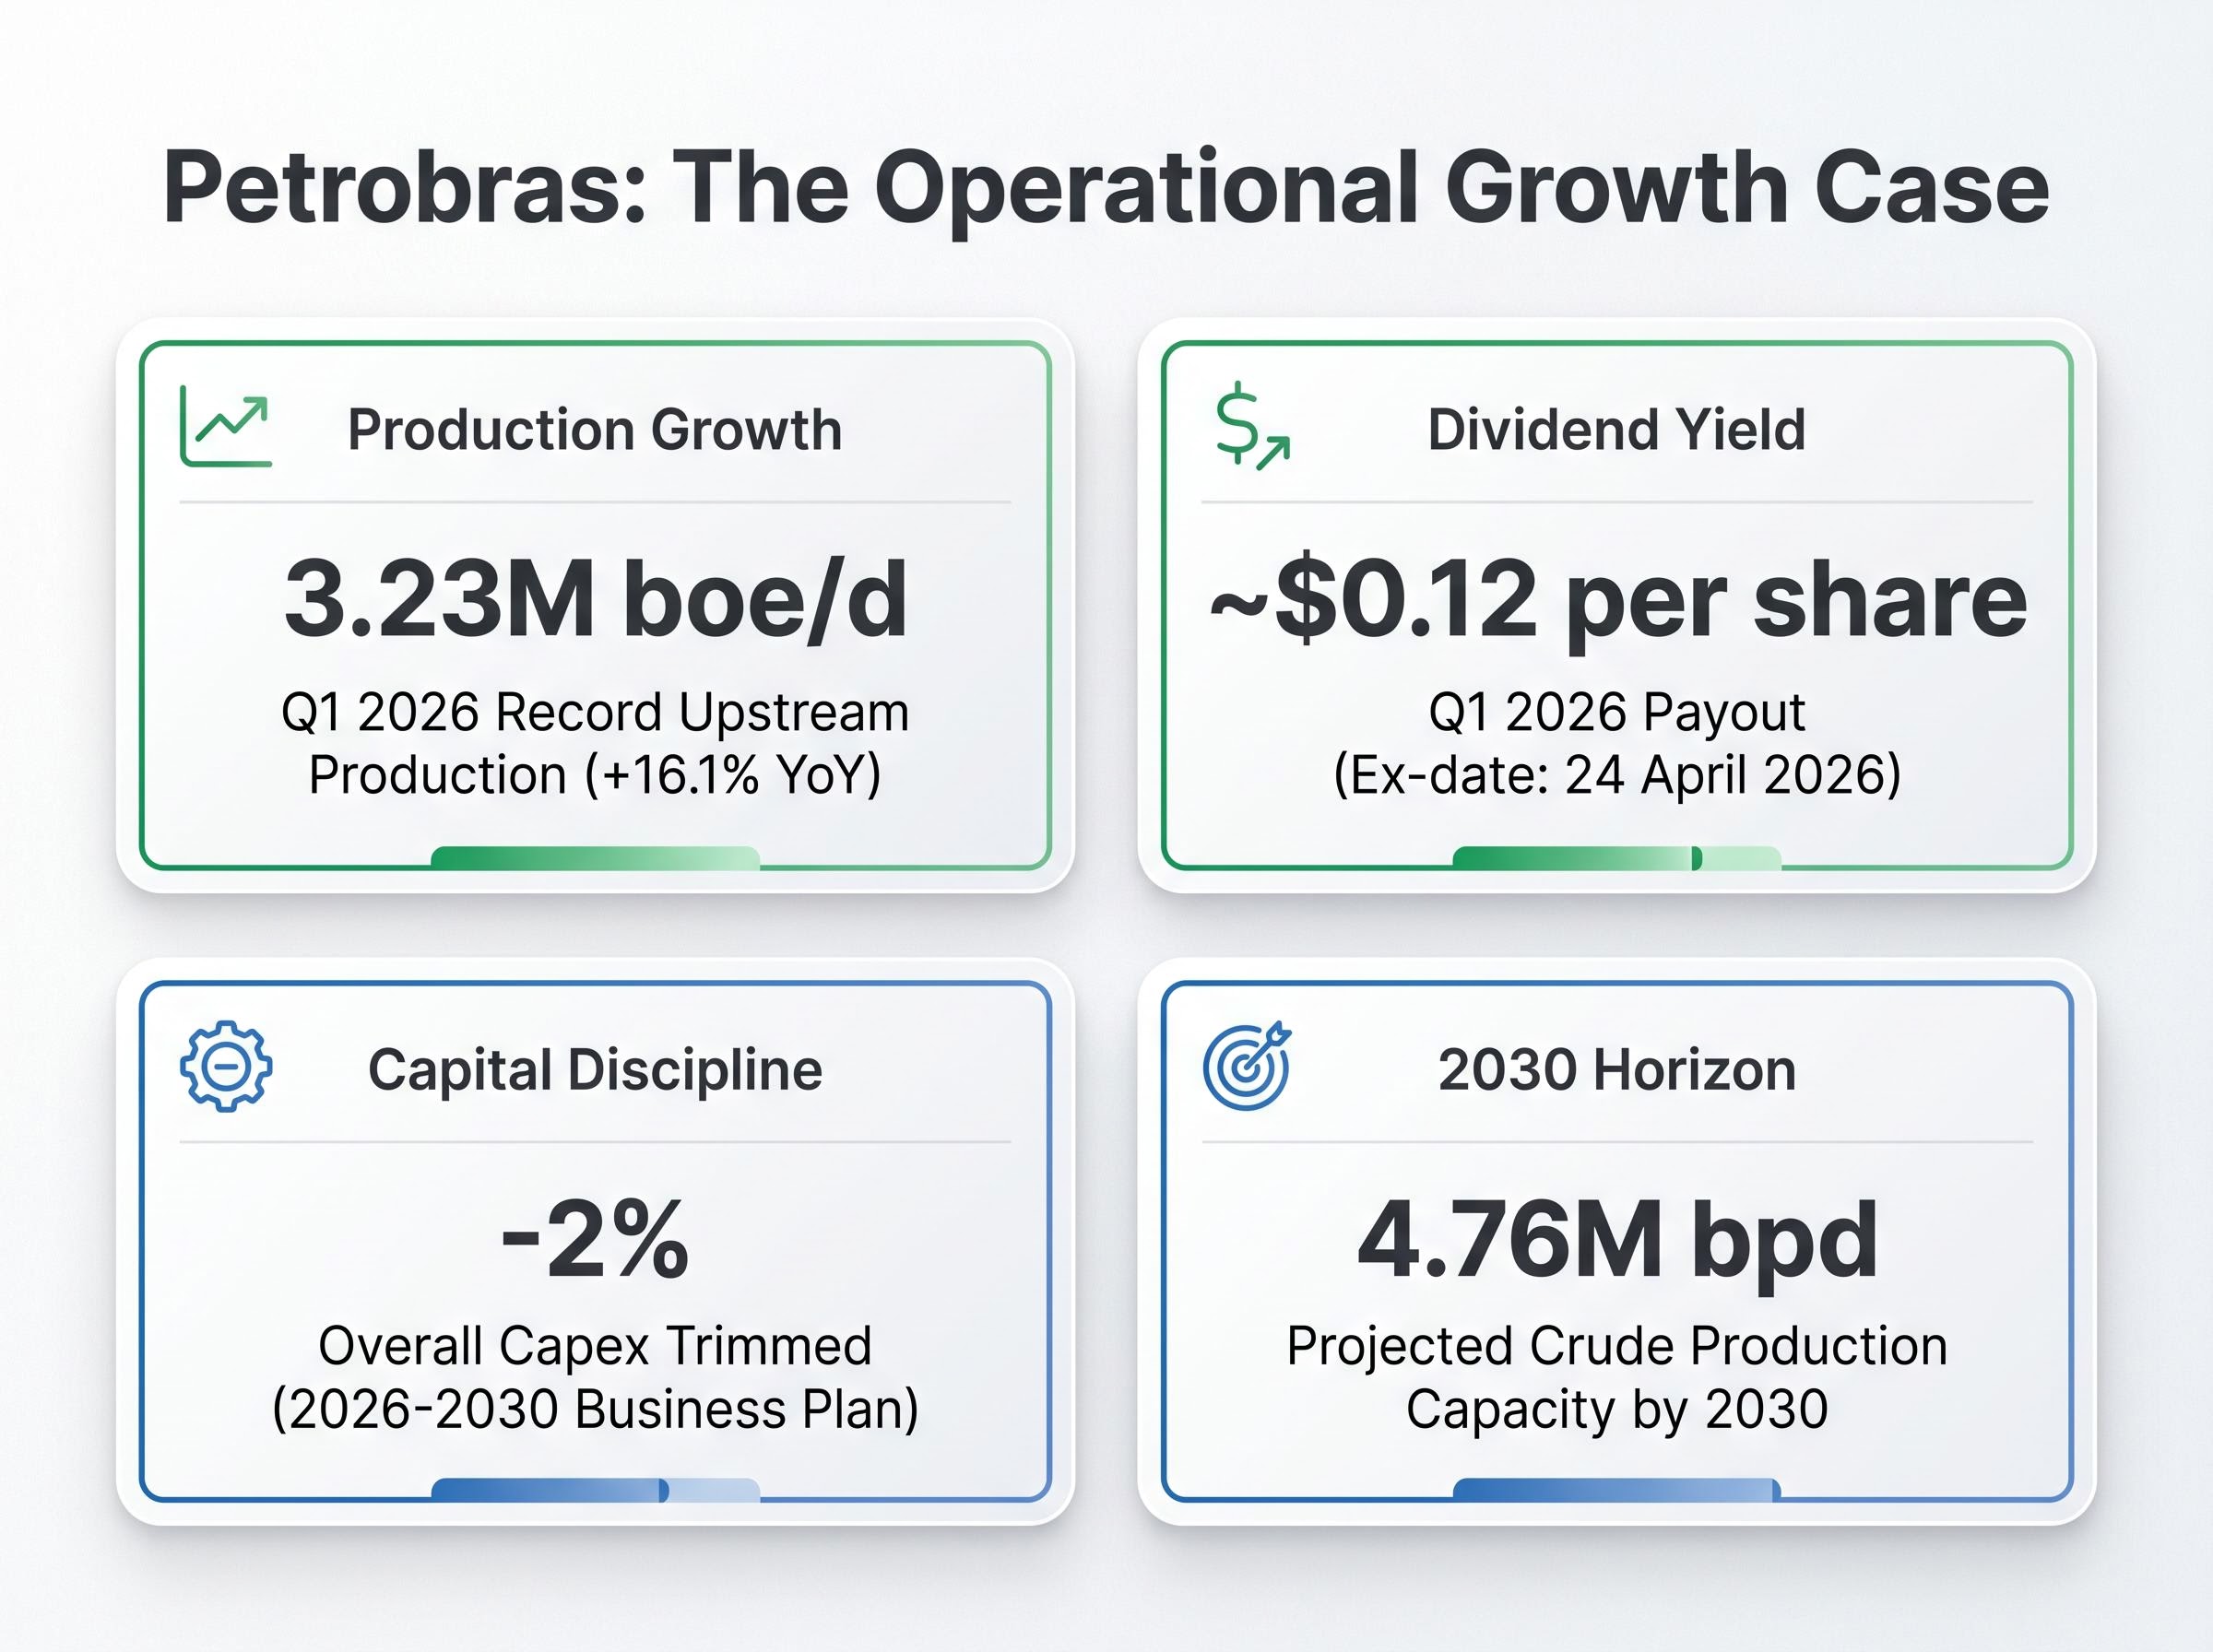
In Q1 2026, Petrobras achieved record upstream production of 3.23 million barrels of oil equivalent per day, a 16.1% year-on-year increase driven by pre-salt field expansion. This is not a valuation re-rating story alone. It is an operational momentum story with a growing asset base underneath it.
The investment case rests on three components:
- Production growth: Q1 2026 output hit a record, with pre-salt fields driving the expansion
- Dividend yield: Q1 2026 payout of approximately $0.12 per share (ex-date 24 April 2026), continuing a track record of shareholder distributions
- Capital discipline: The Business Plan 2026-2030 trimmed overall capex by approximately 2% while increasing pre-salt investment, prioritising high-return deepwater assets
The 2030 production horizon and what it means for index weighting
Brazil’s crude oil production capacity is projected to reach 4.76 million barrels per day by 2030, the fastest output growth on the South American continent. The iShares MSCI Brazil ETF grew to roughly $12 billion in assets, nearly quadrupling in size over the prior year.
OPEC supply coordination is fracturing at the same moment Brazil’s independent production trajectory is accelerating, and the UAE’s departure from the cartel in May 2026 adds a further layer of structural complexity to the global oil market that commodity-linked equity investors will need to factor into their positioning frameworks.
Brazil’s weighting in major EM indexes remains below 5%. Franklin Templeton and other fund managers have cited this underallocation as a specific source of upside. If institutional reweighting follows production and revenue growth, the gap between Brazil’s economic weight and its index representation could compress meaningfully over the coming years.
The MSCI Emerging Markets Index factsheet places Brazil’s weighting at 5.15% as of March 2026, a figure that still sits below the country’s growing share of EM commodity export revenue and reinforces the underallocation argument made by fund managers who view the gap as a source of asymmetric upside.
Why Brazil’s oil-exporter status is an explainer, not just a headline
The performance numbers are clear. The mechanism behind them is less obvious, and understanding it separates investors who hold through volatility from those who exit at the first drawdown.
Net oil-exporter status translates into equity market outcomes through a three-step chain:
- Energy import cost removal: Net exporter status eliminates the drag that rising oil prices impose on importing economies. When crude prices rise, Brazil’s current account strengthens rather than deteriorates.
- Fiscal and earnings support: Commodity export revenue supports government fiscal capacity (through royalties and taxation) and corporate earnings simultaneously, broadening the equity market benefit beyond the energy sector.
- Foreign capital attraction through high real yields: With the Selic rate at 14.50% as of 29 April 2026 (following a 25 basis point cut from 14.75%), Brazil offers some of the highest real interest rates among major emerging markets, creating a yield premium that draws foreign capital into both fixed income and equities.
Brazil’s Selic rate stood at 14.50% as of 29 April 2026, maintaining one of the widest real yield premiums among major emerging market economies.
The contrast with oil-importing peers makes the advantage legible. South Korea sources approximately 70% of its crude oil imports from the Middle East, leaving it structurally exposed to exactly the energy price risk that Brazil has exited. South Korea’s Kospi surged approximately 57% in 2026, but that performance was driven by AI hardware exposure, an entirely different mechanism with its own vulnerability profile.
Brazil against its peers: where the edge is real and where it narrows
Among commodity-linked emerging markets, Brazil’s 2026 performance stands apart. But the peer comparison reveals where the advantage is specific and where it begins to narrow.
| Country | 2026 YTD Equity Performance | Oil Export Status | EM Index Weighting | Primary Risk Factor |
|---|---|---|---|---|
| Brazil | ~+23% | Net exporter (since 2017) | Below 5% | Selic easing pace |
| Colombia | ~-5% | Net exporter | Minimal | Limited export diversification |
| Nigeria | Largely flat | Net exporter | Minimal | Oil price volatility |
| Saudi Arabia | Commodity-driven gains | Net exporter | More fully weighted | Geopolitical risk premiums |
Colombia is down approximately 5% year-to-date, dragged by narrow export diversification. Nigeria has tracked largely flat as oil price volatility offset production gains. Saudi Arabia has delivered commodity-driven equity returns, but fund managers cite higher geopolitical risk premiums that temper its institutional appeal relative to Brazil.
The differentiator is not oil-exporter status alone. Brazil combines export diversification, high nominal and real yields, and a below-5% EM index weighting that creates asymmetric upside if reweighting flows materialise. Franklin Templeton noted that the firmer Brazilian real has supported inflation control but presents trade-offs for export competitiveness, a tension that is not present in weaker-currency commodity peers.
The next major ASX story will hit our subscribers first
The risks that could unwind the Brazil thesis
A structural thesis does not eliminate risk; it reframes which risks matter most.
- Selic easing pace: At 14.50% following the 29 April 2026 cut, the trajectory of further reductions is the primary variable. If cuts accelerate beyond the current 25 basis point pace, Brazil’s carry advantage narrows and the foreign inflow thesis weakens.
- Domestic selling pressure: Institutional investors were net sellers at approximately -R$26.5 billion through mid-February 2026, with retail at roughly -R$5.2 billion. Foreign inflows have absorbed this selling so far, but a shift in foreign sentiment would leave domestic supply unmatched.
- Oil price exposure: Net-exporter status mitigates but does not eliminate commodity price risk. A sustained decline in crude prices would pressure Petrobras earnings and the broader materials complex.
- Fiscal and political risk: Analysts continue to flag fiscal sustainability concerns and political policy changes as background headwinds that have contributed to past currency volatility.
Equity resilience during geopolitical shocks follows a documented three-phase pattern across 60 years of S&P 500 data, with Phase 3 recoveries consistently beginning before formal conflict resolution; for Brazil, the relevance is specific, since oil-shock conflicts sustaining crude above $100-110 per barrel represent the category that has historically extended drawdowns for importing economies while exporter balance sheets remain supported.
Monitoring signals: what would change the investment case
Three variables function as early warning indicators rather than reasons to avoid the position. The pace of Selic cuts beyond the current 25 basis point trajectory is the most immediate: faster easing compresses yields and could soften inflow momentum. Any sustained reversal in the real’s firmness would signal a shift in the macro backdrop that underpins the carry trade. Petrobras production guidance updates, particularly around pre-salt expansion timelines, would test whether the operational growth case is tracking to the 2030 projection.
Brazil’s oil-exporter advantage is structural, but the entry window is not permanent
The analytical case is layered: oil-exporter status, high real yields, record foreign inflows, and rising production capacity combine to create a macro foundation for sustained equity outperformance. Each pillar reinforces the others rather than standing in isolation.
MSCI EM trades at a price-to-earnings ratio of approximately 18.4x, versus roughly 28.9x for the S&P 500. The relative valuation gap remains intact, but investors should monitor whether Brazil’s re-rating compresses it.
Brazil’s below-5% EM index weighting is the asymmetric variable. If institutional reweighting follows production growth and earnings delivery, passive flows could amplify the active positioning that has already driven record Q1 2026 inflows. The Selic easing cycle, properly monitored, is not a signal to avoid Brazil but a sequencing consideration for when sector rotation within the Brazilian market may shift from yield-sensitive financials toward cyclical beneficiaries of lower rates.
The production trajectory to 4.76 million barrels per day by 2030 gives multi-year investors a structural anchor. For shorter-term tactical positions, the risk monitoring framework matters more than the structural thesis: the pace of rate cuts, the direction of the real, and Petrobras delivery against guidance are the variables that will determine whether conviction is rewarded or tested.
Investors exploring the structural case for diversifying away from US large-cap exposure will find our full explainer on US index concentration risk, which details how five mega-cap stocks controlled approximately 23% of the broad market index as of mid-April 2026 and drove more than half of April’s recovery, a concentration profile that makes Brazil’s below-5% EM index weighting argument considerably more compelling as a diversification rationale.
This article is for informational purposes only and should not be considered financial advice. Investors should conduct their own research and consult with financial professionals before making investment decisions. Past performance does not guarantee future results. Financial projections are subject to market conditions and various risk factors.