How Warsh’s 130-Word Statement Reshaped Federal Reserve Policy
19 mins ago

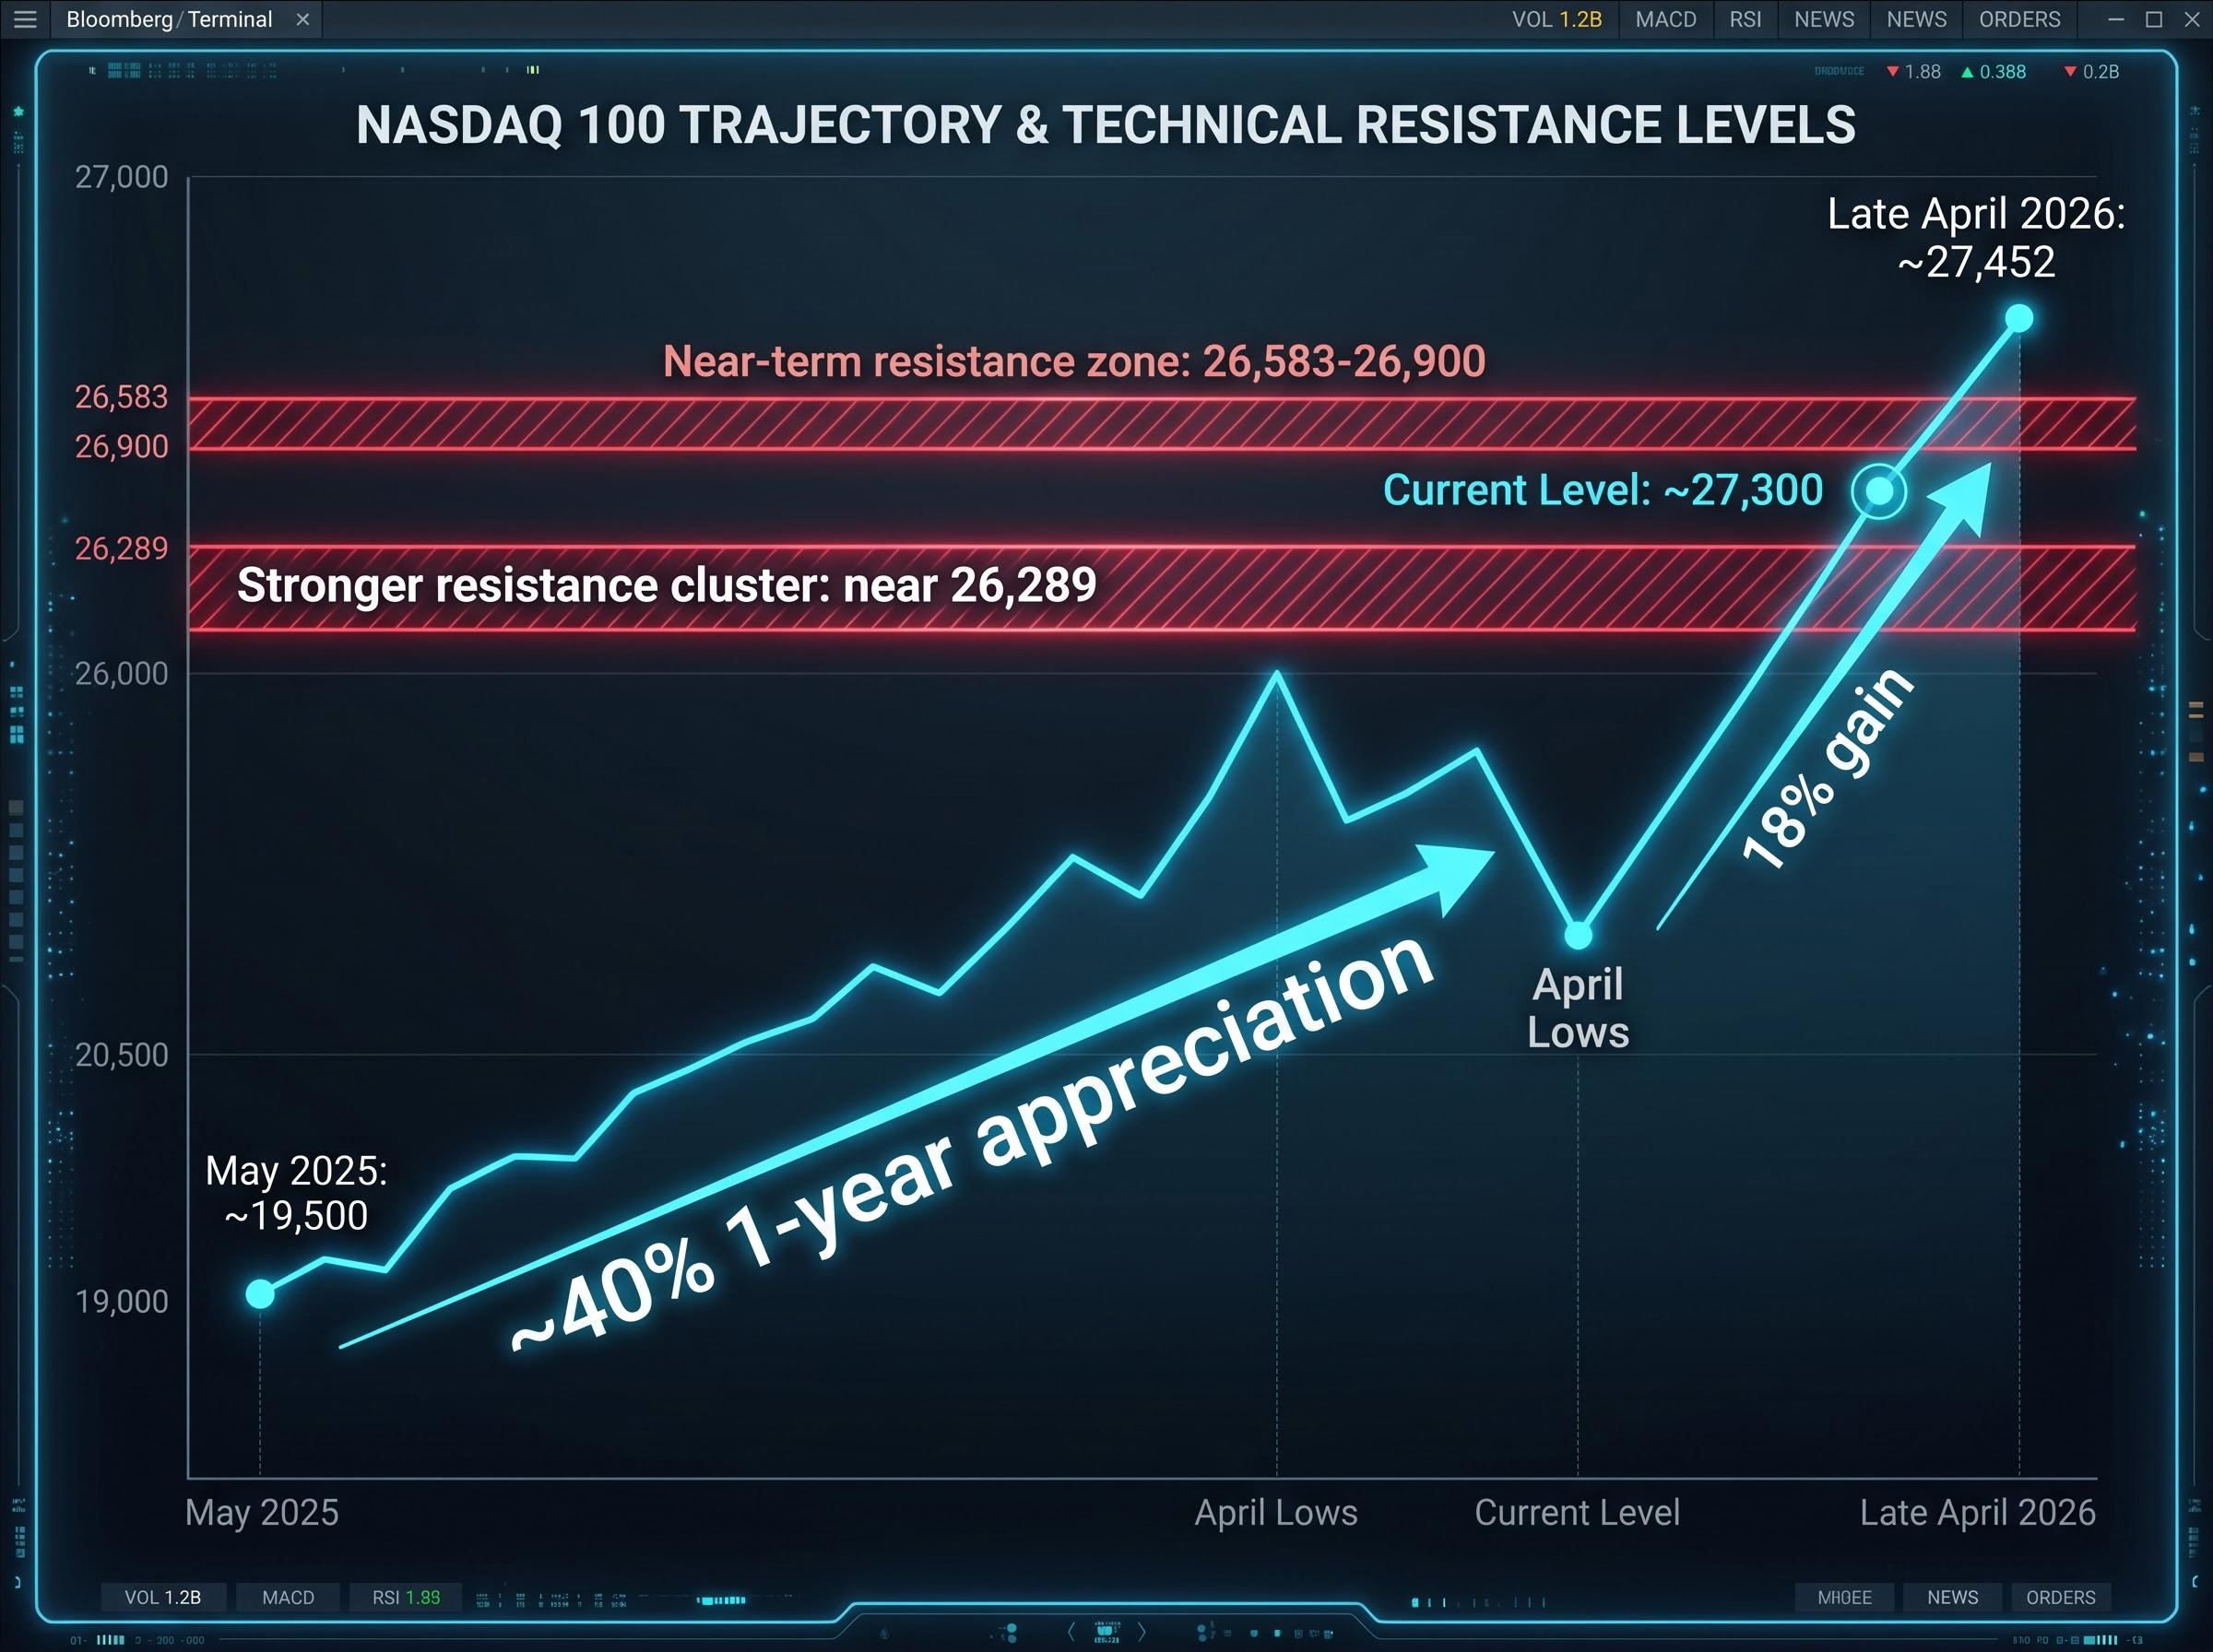
The Nasdaq 100 has climbed roughly 18% from its April lows to a level of approximately 27,300, a rebound sharp enough to test whether conviction or momentum is doing the heavy lifting. That question matters now because the rally has pushed momentum indicators into overbought territory just as the index approaches a well-defined resistance zone, and the AI revenue story underpinning tech valuations is delivering contradictory signals. What follows is an examination of the technical setup, the state of AI monetisation at the enterprise level, and what the upcoming Magnificent Seven earnings season must deliver to justify current pricing.
The scale of the move deserves its own moment. From April lows to approximately 27,300, the Nasdaq 100 has gained 18% in a matter of weeks. Measured over a longer horizon, from a baseline of roughly 19,500 in May 2025, the index has appreciated approximately 40% in about one year.
That trajectory, however, has carried the index directly into a technical ceiling rather than through one. The key data points framing the current setup:
Momentum indicators have moved into overbought readings, and early price fatigue signals are visible near resistance, according to Vantage Markets analyst Hebe Chen.
“Consolidation is likely before the next clear directional move.” — Vantage Markets technical analysis
The rally is real. So is the ceiling it has run into. Both facts are operating simultaneously, and the sections that follow examine whether the fundamental picture can resolve the tension.
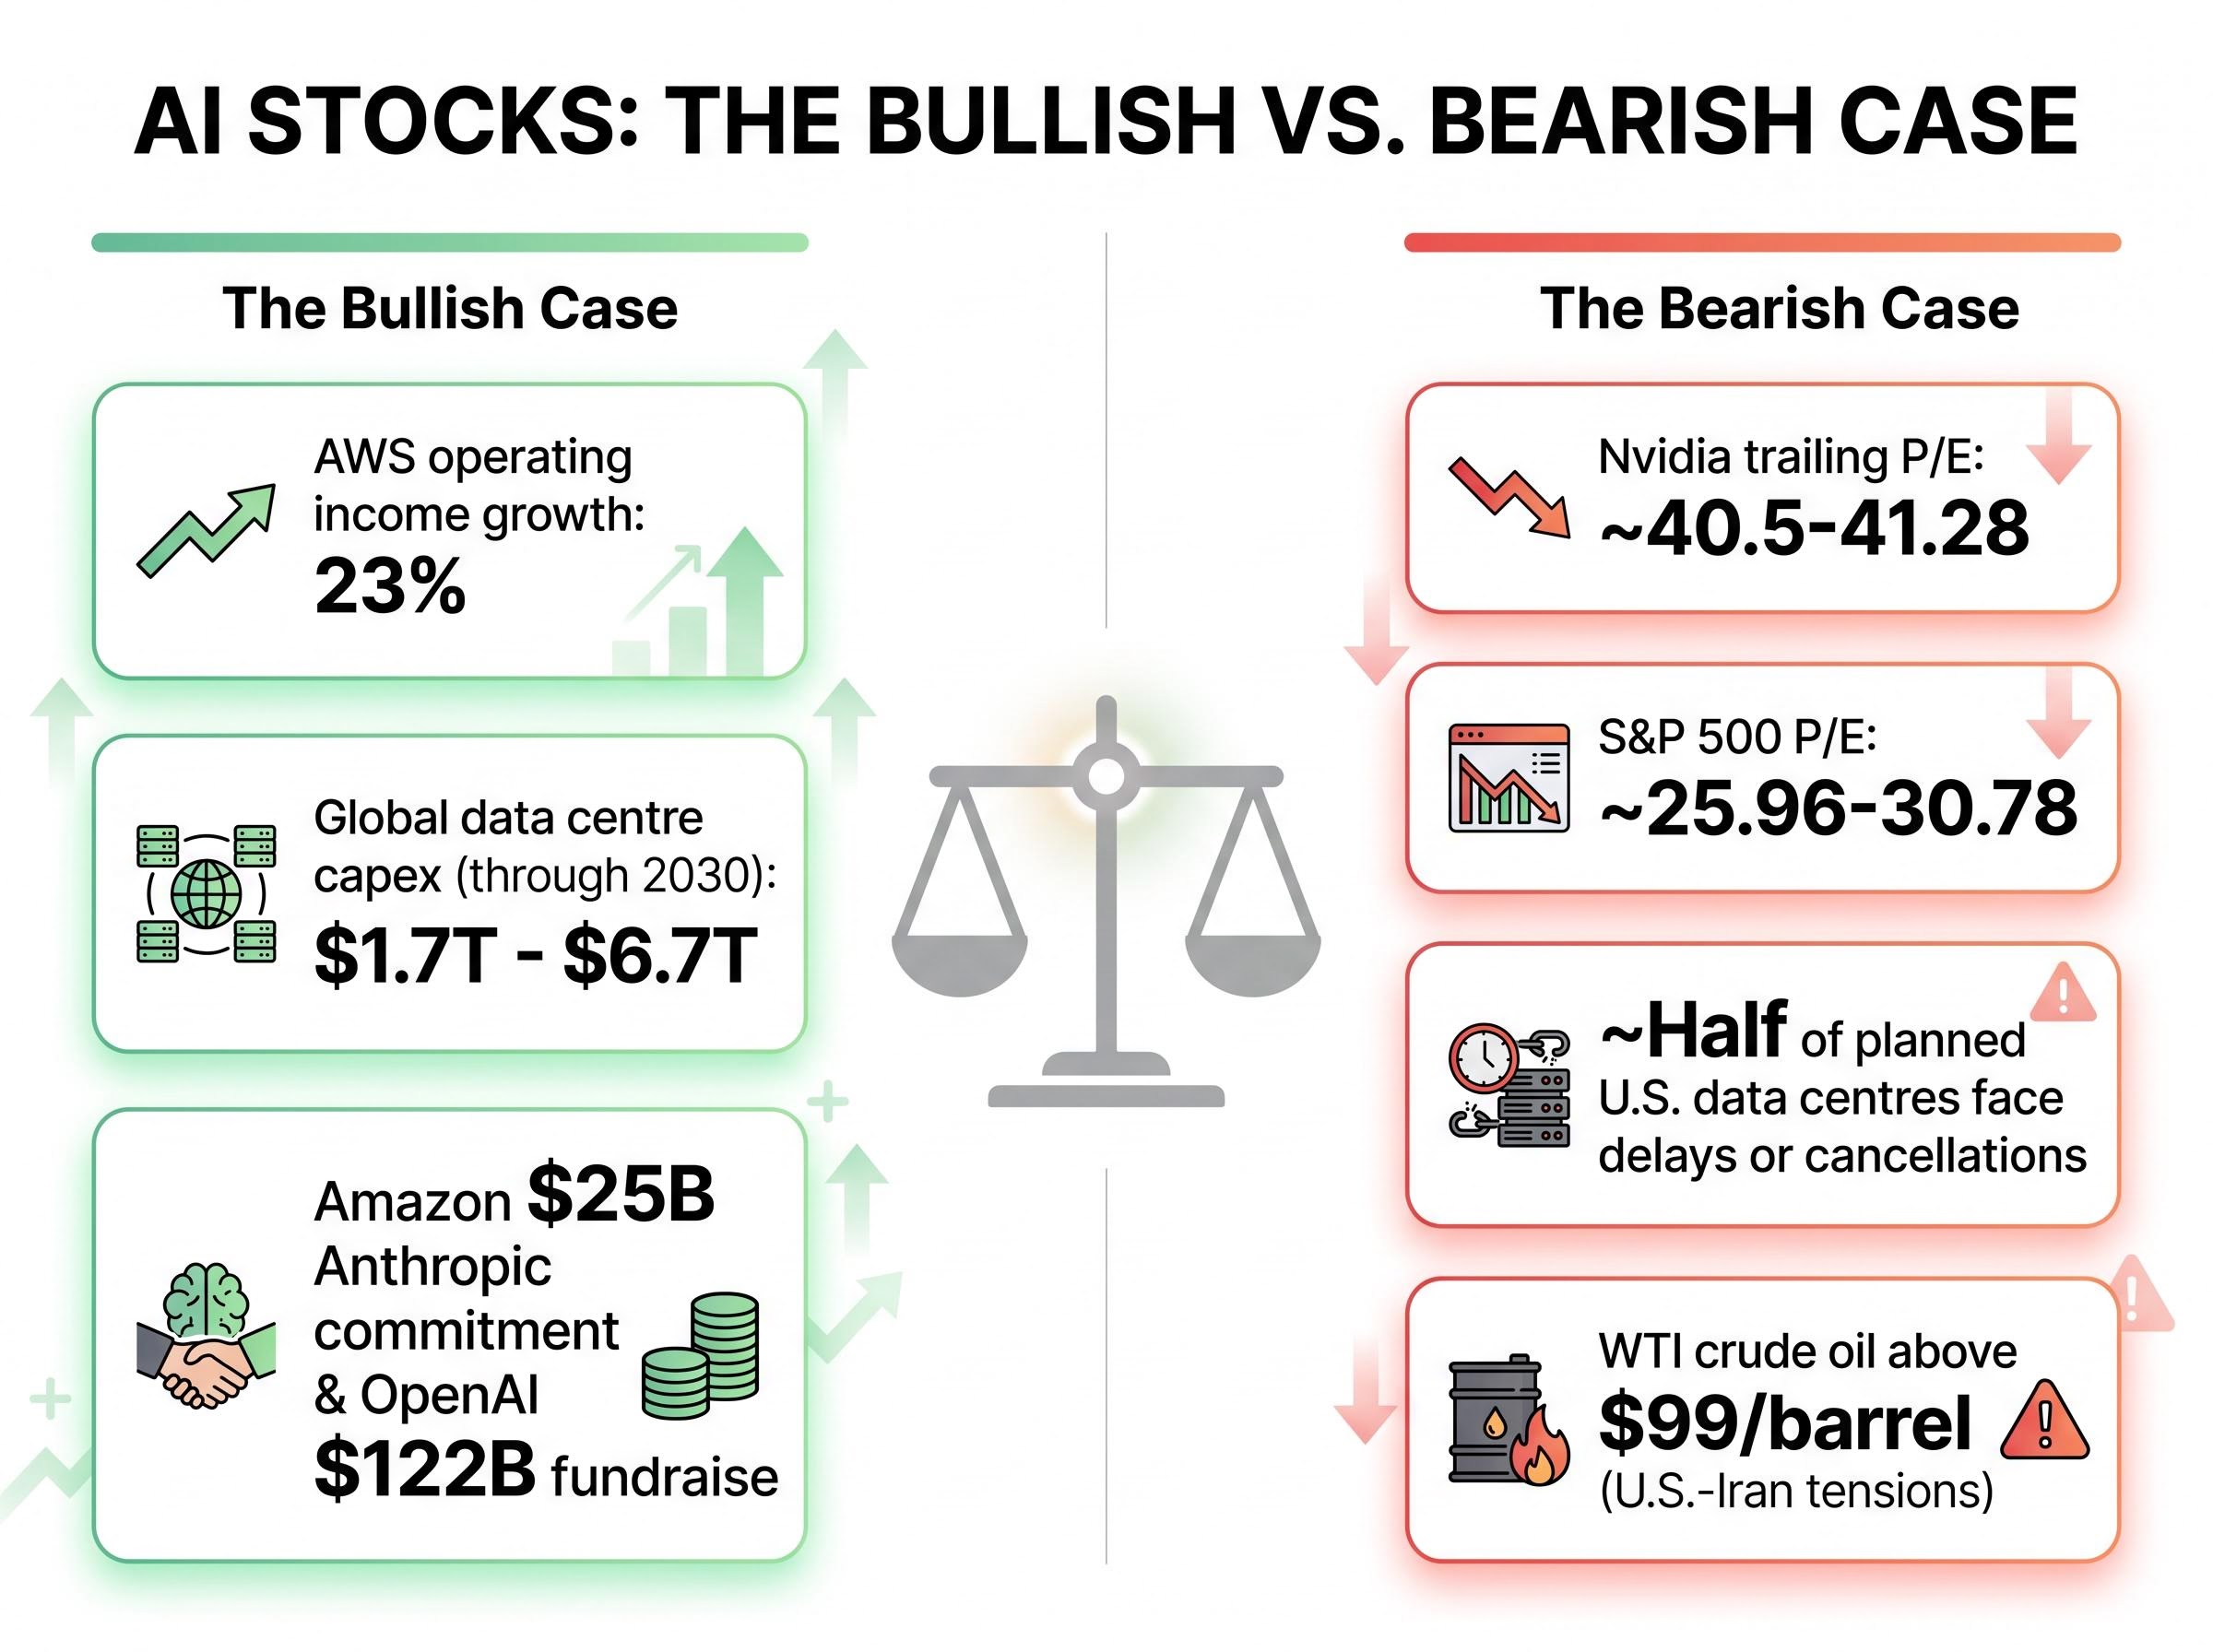
Amazon Web Services delivered the clearest evidence that AI infrastructure spending is converting to measurable profit. AWS operating income rose 23% to $14.16 billion, beating consensus estimates of $12.84 billion. That beat carried additional weight given Amazon’s commitment to invest up to an additional $25 billion in Anthropic, with Anthropic in turn pledging to spend up to $100 billion on Amazon technologies over time.
Intel provided a secondary confirmation, reporting Q1 2026 revenue of $13.6 billion, up approximately 7% year-over-year. The result contributed to AI-linked tech sentiment during the period.
OpenAI’s growth trajectory has become a source of investor scepticism. The company’s infrastructure spending plans have been subject to disputed figures, with claims of a reduction in projected compute spending lacking official confirmation. OpenAI has raised approximately $122 billion in total funding, yet questions persist about whether growth metrics are tracking at the pace that fundraising implied.
The infrastructure friction extends beyond any single company. Approximately half of planned U.S. data centres face delays or cancellations due to component shortages and rising energy costs. That bottleneck pressures cloud infrastructure partners including Oracle, which has sought approximately $50 billion in related infrastructure investment, and Microsoft.
Data centre power constraints have become the physical ceiling on AI infrastructure spending plans: leading tech companies projected to spend $630 billion to $690 billion on AI infrastructure in 2026 are encountering multi-year backlogs for new grid interconnections, which means the data centre delay figure cited for roughly half of planned US projects reflects an energy infrastructure problem as much as a component supply problem.
| Company | AI Metric | Result vs. Expectation |
|---|---|---|
| Amazon (AWS) | Operating income: $14.16B (up 23%) | Beat consensus of $12.84B |
| OpenAI | Growth figures and infrastructure spend | Disputed; weaker than expectations implied |
| Intel | Q1 revenue: $13.6B (up 7% YoY) | Positive contribution to AI sentiment |
The gap between institutional capital commitments (hundreds of billions in pledged investment) and real-time execution friction (data centre delays, contested growth metrics) is where the valuation debate lives. The revenue evidence is genuinely mixed, not cleanly bullish or bearish.
On a price chart, the pattern is straightforward. The Nasdaq 100 moved from approximately 19,500 in May 2025 to approximately 27,452 by late April 2026. That is roughly 40% appreciation in about one year, and the pace of the most recent leg, 18% from April lows, compressed much of that gain into weeks rather than months.
The logical sequence of what happens next follows a well-established pattern:
An overbought reading does not mean prices must fall. It means the rate of advance has stretched beyond what buying pressure alone can sustain without a pause.
Consolidation at resistance is not a trend reversal. It is a pause before the next directional move, and the direction of that move depends on whether the fundamental case strengthens or weakens during the pause.
For investors interpreting the 18% rally as a straightforward buy signal, this framework offers a necessary counterweight. The same data that confirms the rally’s strength also identifies the conditions under which momentum could stall.
Nvidia’s trailing price-to-earnings ratio sits at approximately 40.5-41.28 as of late April 2026. In isolation, that figure signals a stock priced for substantial future earnings growth. In context, it sits atop an already elevated baseline.
The S&P 500 P/E ratio stands at approximately 25.96-30.78 over the same period, itself above long-term historical averages. The benchmark against which Nvidia’s premium is measured is not a cheap market. It is a market that has already priced in considerable optimism across sectors.
| Metric | Current Reading | Historical Context |
|---|---|---|
| Nvidia trailing P/E | ~40.5-41.28 | Significant premium over broader market |
| S&P 500 P/E | ~25.96-30.78 | Above long-term historical averages |
| Global data centre capex (through 2030) | $1.7T-$6.7T | Wide range reflects early-stage uncertainty |
The question is whether these premiums reflect risk or rational pricing of a structural growth phase. The arguments stack up on both sides:
The bullish case:
The bearish case:
The range of data centre capex estimates, from $1.7 trillion to $6.7 trillion, captures the uncertainty itself. That spread is not a rounding error. It is a measure of how much of the AI investment thesis remains unresolved.
S&P 500 warning signals were accumulating even before the Nasdaq 100 rally peaked: gasoline above $4.00 per gallon has historically preceded an average 11% index decline over the following six months, and Goldman Sachs and JPMorgan were both assigning 30-35% recession probability for the next 12 months, a backdrop that frames the Nasdaq 100’s resistance test as something more consequential than a routine technical consolidation.
The AWS beat set a benchmark. Operating income of $14.16 billion, exceeding consensus by more than $1.3 billion, demonstrated what AI monetisation at scale looks like when it is working. The remaining Magnificent Seven names now face an earnings season where anything short of comparable AI revenue specificity may be treated as a disappointment.
That bar is not set arbitrarily. It reflects the premium the market has already priced in. At a Nasdaq 100 level of approximately 27,300 and individual name valuations like Nvidia’s 40x trailing earnings, the market is paying for acceleration that must appear in disclosed AI revenue line items.
Wedbush Securities has maintained that current fears about AI spending are an overreaction, arguing that sustained consumer and enterprise demand supports the investment thesis. That view deserves a fair hearing, particularly given the AWS result. The question is whether enough of the Magnificent Seven can deliver comparable evidence.
Key earnings-season watchpoints:
The earnings season is unfolding against a backdrop that technology companies cannot control. WTI crude oil rose above $99 per barrel during the reporting week, driven by U.S.-Iran tensions centred on the Strait of Hormuz, which accounts for roughly 20% of global oil flows.
EIA data on the Strait of Hormuz confirms that the chokepoint carries approximately 21% of global petroleum liquids consumption daily, which contextualises why sustained U.S.-Iran tensions in the region translate directly into oil price pressure with broad macroeconomic consequences for energy-intensive industries including data centre operations.
Higher energy prices transmit to the tech sector through two channels: elevated data centre operating costs and broader consumer spending pressure that affects advertising revenue, device purchases, and cloud subscription growth. The S&P 500 declined 0.4% and the Nasdaq 100 dropped 1% on the Tuesday of the reporting week, an early signal that sentiment was tightening ahead of earnings releases.
A single-quarter earnings miss in a low-volatility environment is absorbed. A miss occurring alongside overbought technicals, resistance-level price action, and $99 oil creates a less forgiving environment for any Magnificent Seven name that fails to validate its premium.
Three pressures are converging on the same question. Technical signals show an 18% rally that has pushed momentum into overbought territory at a defined resistance zone. The AI monetisation picture is split between genuine earnings beats (AWS) and unresolved questions about infrastructure execution and OpenAI growth. Macro headwinds from oil prices above $99 per barrel add external pressure that technology companies cannot manage through operational performance alone.
Whether current Nasdaq 100 levels represent a justified premium or a vulnerability comes down to a specific set of near-term inputs: Magnificent Seven earnings disclosures on AI revenue, updated data centre capex guidance, and whether the index can clear the 26,583-26,900 resistance zone on strong volume.
The rally delivered the recovery. The earnings season determines whether the recovery holds.
Investors wanting a structured framework for assessing whether the spending is justified will find our comprehensive walkthrough of the AI infrastructure investment cycle, which covers how to differentiate routine operational costs from generational hardware bets, how to read operating cash margins as a monetisation signal, and why computing-driven revenue disclosure is now the metric Wall Street uses to separate credible AI narratives from aspirational ones.
This article is for informational purposes only and should not be considered financial advice. Investors should conduct their own research and consult with financial professionals before making investment decisions. Past performance does not guarantee future results. Financial projections are subject to market conditions and various risk factors.
AI stock valuations are currently driven by expectations of accelerating earnings growth from AI monetisation, with Nvidia trading at a trailing P/E of approximately 40.5-41.28 and the S&P 500 itself elevated at roughly 25.96-30.78, both above long-term historical averages.
The Nasdaq 100 gained approximately 18% from its April lows to around 27,300 in a matter of weeks, pushing momentum indicators such as the RSI into overbought territory and bringing the index directly into a resistance zone between 26,583 and 26,900.
Analysts are looking for specific AI revenue line-item disclosures, data centre capex guidance updates, and management commentary on infrastructure delays, with the AWS beat of $14.16 billion in operating income setting the benchmark that remaining Magnificent Seven names must meet or exceed.
Approximately half of planned U.S. data centre projects face delays or cancellations due to component shortages, rising energy costs, and multi-year backlogs for new grid interconnections, creating real execution friction against the $630-$690 billion in projected 2026 AI infrastructure spending.
Higher oil prices, with WTI crude rising above $99 per barrel due to U.S.-Iran tensions, transmit to the tech sector through elevated data centre operating costs and broader consumer spending pressure that can weaken advertising revenue, device sales, and cloud subscription growth.