KOSPI Drops 10% as Crowded AI Trade Unwinds Across Global Markets
8 hrs ago

The figure on a superannuation comparison tool looks straightforward: a percentage, maybe two, representing the annual cost of having someone else manage retirement savings. For the approximately 17 million Australians with superannuation accounts, that number is supposed to be the basis for informed choice. It is not. Beneath the headline fee sits a series of structural costs that no fund is currently required to disclose in a single, comparable figure. At system scale, with $4.5 trillion in total assets as of February 2026, even a concealed annual cost drag of 0.5% to 1% compounds into tens of thousands of dollars stripped from an individual member’s retirement balance over a working life. This analysis examines the specific mechanisms that create that gap, explains why the current disclosure framework cannot close it, and makes the case that regulators must mandate a standardised net-balance-impact metric before the damage accumulates further.
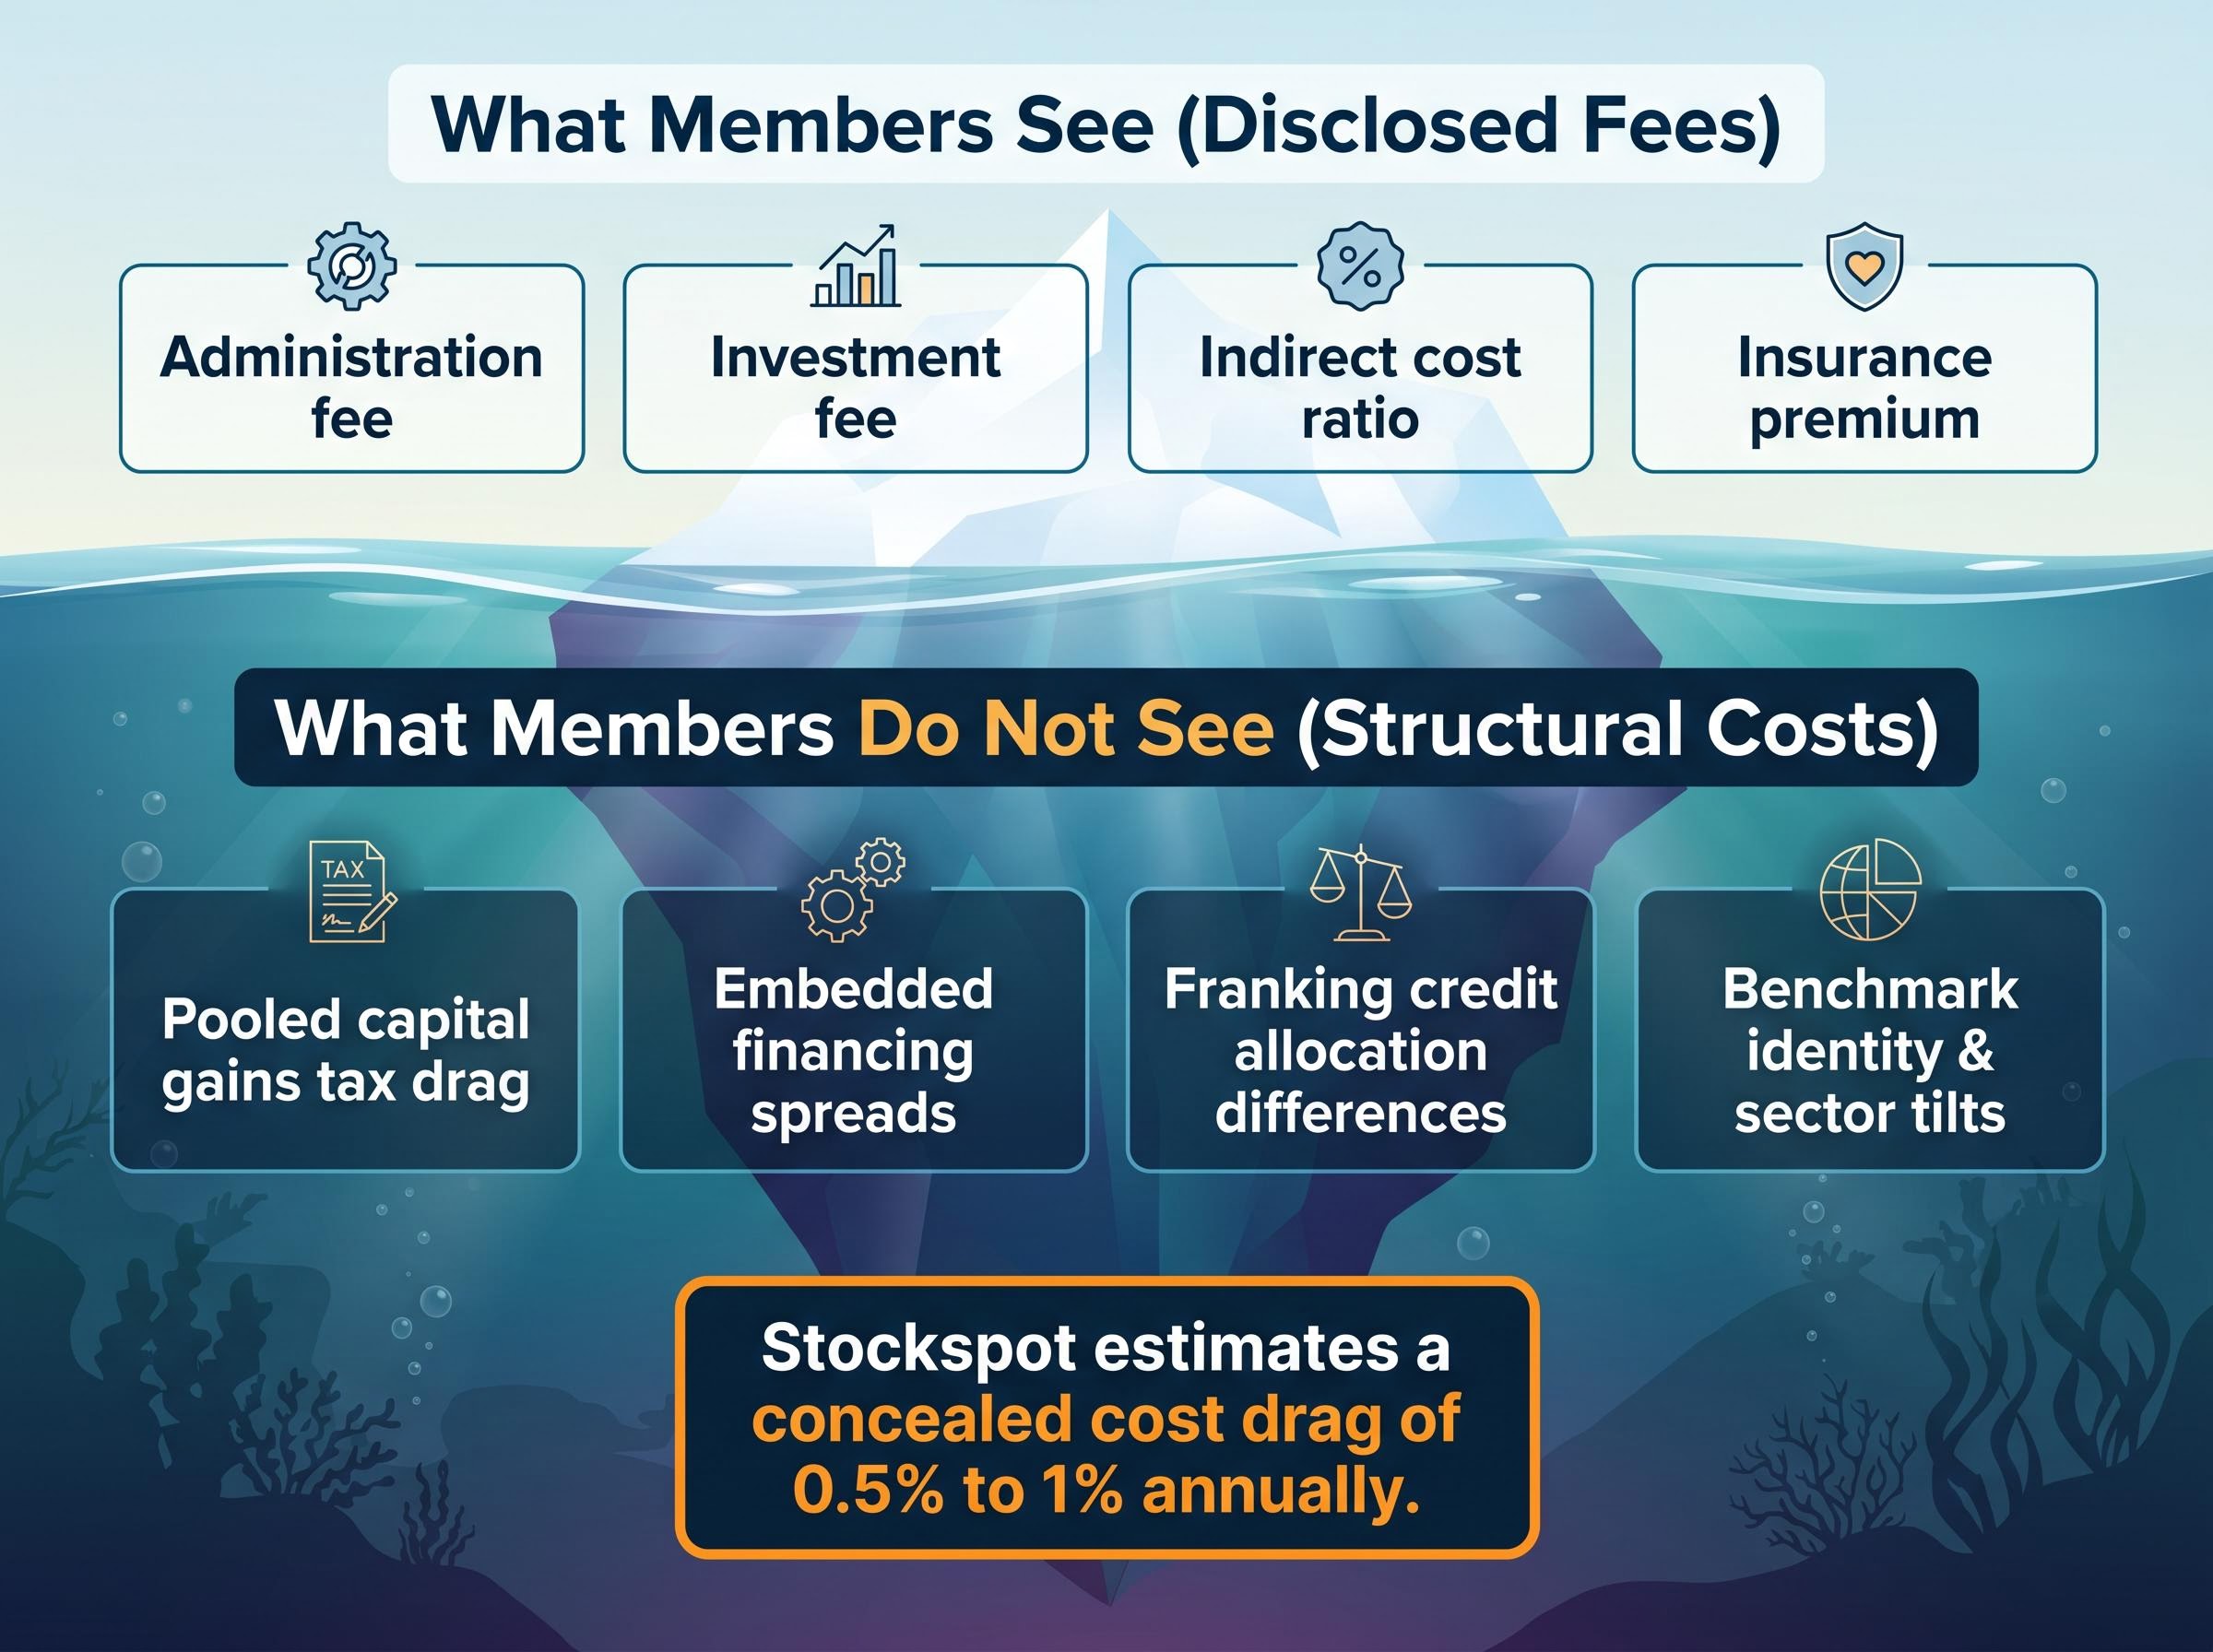
The fee a member sees first, typically on a product comparison website or in an annual statement, captures a defined set of cost categories: administration fees, investment fees, the indirect cost ratio, and insurance premiums. These are real charges, and they are disclosed under existing regulatory guidance. The problem is what they leave out.
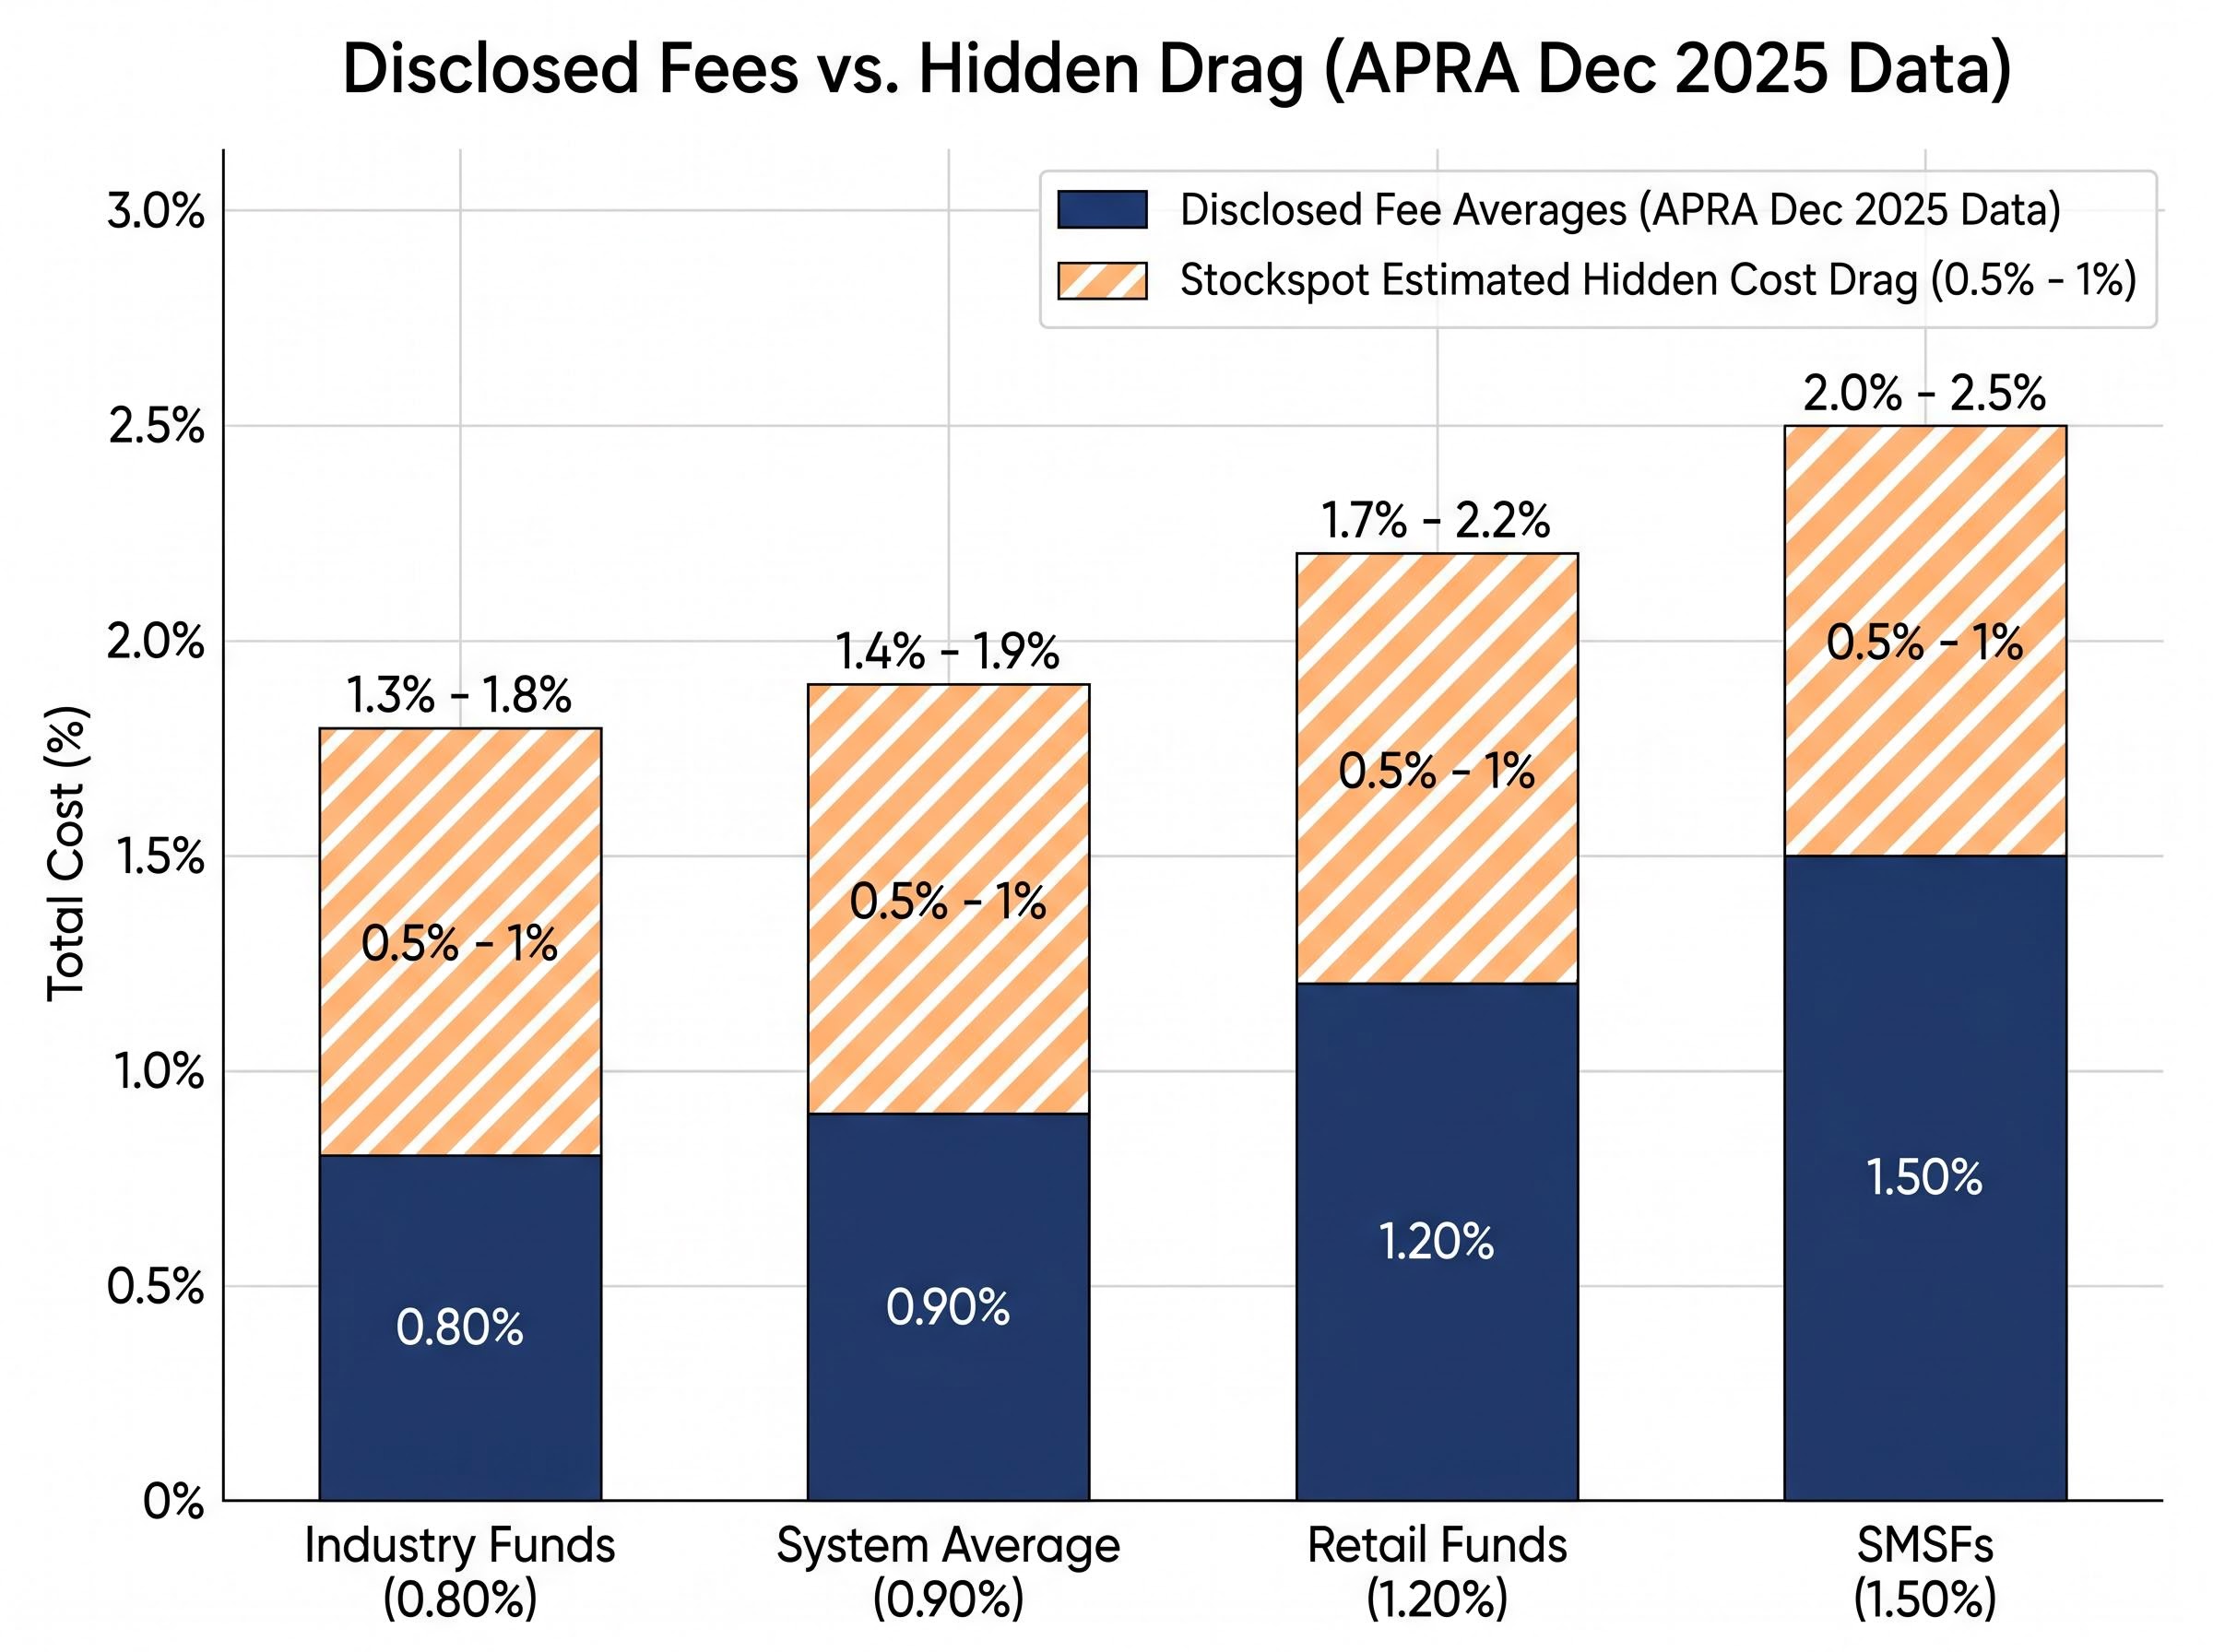
APRA’s December 2025 annual fund-level statistics put industry-average total costs at approximately 0.90% of assets. Industry funds average roughly 0.80%, retail funds approximately 1.20%, and self-managed super funds (SMSFs) around 1.50%. These figures represent the disclosed layer. Beneath them sit structural costs: pooled capital gains tax drag, embedded derivative financing spreads, franking credit allocation differentials, and undisclosed benchmark tilts that alter risk exposure without appearing in any fee summary.
The APRA annual fund-level superannuation statistics, which include detailed breakdowns of fees and membership by fund type, provide the authoritative basis for the industry averages cited here and demonstrate that disclosed fee layers vary materially across fund structures even before structural costs are accounted for.
The competitive dynamic reinforces the gap. Funds face sustained pressure to display lower headline fees, which creates an incentive to compress visible cost categories while structural costs, which no regulation requires to be separately reported, remain opaque. The result is a market competing on presentation rather than verified cost reduction.
Members see:
Members do not see:
Research from Stockspot, led by founder Chris Brycki, estimates that a concealed cost drag of 0.5% to 1% annually can compound into tens of thousands of dollars in lost retirement savings over a full working life.
The most meaningful metric for any member is the net retirement balance they will actually receive. No fund is currently required to disclose this figure.
Three distinct mechanisms illustrate how product design embeds costs that sit outside the disclosed fee framework. Each operates differently, but together they build a pattern: the gap between stated and actual cost is not a single anomaly but a structural feature of multiple product types.
Swap-based index strategies are the first. Certain low-cost index options do not hold the underlying securities of the index they replicate. Instead, they use derivative swap contracts with counterparties to deliver index returns. These arrangements embed financing spreads and counterparty margins that are not separately itemised in the headline management fee. According to Stockspot’s analysis, such arrangements can embed costs and counterparty risk that members cannot identify from standard disclosures.
Undisclosed benchmarks and hidden sector tilts are the second. Some index options do not specify the precise index they track. Stockspot’s research cited the example of a large fund’s Australian shares indexed option that tracked the MSCI Australia 300 Index with a carbon intensity overlay applied, without prominent disclosure of either the benchmark identity or the overlay’s effect on sector weightings. Without knowing which index an option follows, members cannot verify performance attribution or assess whether ethical or sector tilts are altering their risk exposure.
Franking credit allocation is the third. In pooled fund structures, franking credits generated by Australian equity holdings are distributed collectively across the pool. In direct platform structures, those credits are allocated to the individual member whose holdings generated them. Within the accumulation phase, where super fund earnings are taxed at 15%, franking credits carry material value. The difference in allocation methodology creates an after-tax performance differential between structurally similar products that members cannot detect from fee disclosures alone. Stockspot’s research has highlighted this disparity as one of several hidden cost mechanisms affecting member outcomes.
Franking credit allocation differentials are not unique to the superannuation context: the same structural asymmetry affects how ASX income ETF investors compare after-tax yields across pooled and non-pooled product structures, where high headline distribution figures can obscure meaningfully different net returns.
Benchmark non-disclosure is the third. Some index options do not specify the precise index they track. Stockspot’s research cited the example of a large fund’s Australian shares indexed option that tracked the MSCI Australia 300 Index with a carbon intensity overlay applied, without prominent disclosure of either the benchmark identity or the overlay’s effect on sector weightings. Without knowing which index an option follows, members cannot verify performance attribution or assess whether ethical or sector tilts are altering their risk exposure.
Even the lowest-fee options in the market, such as Hostplus Indexed Balanced and AustralianSuper’s indexed options with total fees under 0.50%, are not immune to these structural cost questions.
| Cost Mechanism | Affected Structure | Disclosed Under RG 97 | Member Visibility |
|---|---|---|---|
| Franking credit allocation disparity | Pooled funds vs. direct platforms | No | Not visible in fee summaries |
| Swap-based financing spreads | Derivative-replication index options | No (embedded in product) | Not separately itemised |
| Undisclosed benchmark identity/tilts | Index options with overlays | No specific requirement | Not prominently disclosed |
The majority of large Australian super funds are structured as pooled trusts. Understanding how these structures operate reveals a cost mechanism that no standard fee disclosure captures.
The process works as follows:
Over a multi-decade investment horizon, the accumulated capital gains tax drag from this mechanism can materially reduce net returns. Members who stay in a fund the longest accumulate the greatest exposure to tax events triggered by others. Loyalty to a fund, in this structure, correlates with bearing more of the collective tax burden.
Pooled tax drag does not fall within any of the fee categories covered by Regulatory Guide 97 (the framework governing fees and costs disclosure in superannuation) or the standard product disclosure statement format. No current regulatory requirement compels funds to report it as a separate line item.
This absence is structural rather than a failing of individual funds. Every pooled trust in the system operates under the same rules, and none is required to isolate or disclose this cost. Voluntary disclosure would place a fund at a competitive disadvantage by making its headline cost figure appear higher than structurally identical competitors. Regulatory intervention, not voluntary improvement, is the mechanism through which this gap can be closed.
The relationship between fees and member outcomes is not a theoretical concern. A decade of annual research published by Stockspot, including the Fat Cat Funds reports authored by Chris Brycki, has consistently found that funds with lower fees deliver superior long-term member outcomes across both rising and falling market conditions.
Stockspot’s research spanning more than ten years has consistently demonstrated that high fees erode investment returns across both rising and falling markets, making fee levels one of the most reliable predictors of long-term fund performance.
APRA’s annual performance test provides independent corroboration. In the 2025 cycle, released on 29 August 2025, APRA assessed 563 products. All 52 MySuper products passed, though some trustee-directed products failed. Higher-cost products have shown greater susceptibility to underperformance across multiple test cycles since the Your Future, Your Super framework took effect on 1 July 2021.
Elevated portfolio turnover from an active super fund investment strategy generates compounding cost categories, including transaction costs, price impact, and cash drag, that sit entirely outside the disclosed fee framework and are invisible to members over a 30-40 year accumulation phase.
The performance test assesses net investment returns and fees. It does not, and cannot, test for structural costs that funds are not required to report. What the test captures:
What the test does not capture:
The test is a genuine improvement on what existed before it. But its scope is limited to what the disclosure framework requires. If structural costs remain outside required reporting, the performance test cannot account for them, leaving a compliance gap that growing fund scale only makes more consequential.
Incremental progress is underway. ASIC’s targeted consultation on stamp duty disclosure, launched on 28 November 2025, proposed averaging stamp duty costs over the previous seven financial years to smooth year-to-year volatility. The Treasury Minister announced consumer protection measures in April 2026 targeting inappropriate advice fees being charged to member accounts. The RG 97 framework, last formally amended in September 2020, continues to govern the broader fee disclosure architecture.
These steps address real issues. They do not address the structural cost mechanisms identified in this analysis.
Genuine transparency would require regulators to mandate separate disclosure of:
No current regulatory proposal mandates such a metric. The regulatory and industry discussion in the 2024-2026 period has remained focused on stamp duty treatment and RG 97 mechanics rather than the broader standardisation of a single net-impact figure.
ASIC’s stamp duty consultation, while technically sound for smoothing a narrow transaction cost category, addresses one line item in isolation. It does not engage with the embedded structural costs that sit outside the current disclosure framework altogether.
The divergence among stakeholders illustrates where the regulatory conversation has stalled. ASFA and the Super Members Council have opposed ASIC’s averaging approach, advocating instead for reclassification of stamp duty as an excluded transaction cost. Super Consumers Australia, in its submission lodged on 20 February 2026, supported the averaging proposal but framed it as a limited step, consistent with the organisation’s broader advocacy for more meaningful cost transparency. The debate remains anchored to how a single cost category should be classified, not whether the disclosure framework as a whole captures the costs that matter most to members.
Australia’s superannuation system has grown from a supplementary savings mechanism into the principal vehicle for retirement security for most working Australians. The disclosure framework has not kept pace with either its scale or its structural complexity.
APRA’s December 2025 superannuation statistics confirmed total assets at $4.5 trillion, a scale that makes even a fraction of a percentage point in undisclosed structural costs a material systemic issue with compounding consequences for individual member balances over time.
Hidden costs accumulate silently over decades. No mechanism exists for members to detect or correct the erosion until retirement, at which point the compounded impact cannot be reversed. Stockspot’s April 2026 research warned that funds marketed as low-fee may carry deeper systemic costs affecting retirement outcomes in ways not visible through standard fee comparisons. For a member with a typical accumulation horizon, a concealed 0.5% to 1% annual drag translates into tens of thousands of dollars in reduced retirement savings, a figure that grows with every year the disclosure gap persists.
The arithmetic of fee compounding over a 20-year horizon makes the stakes concrete: a 1% difference in annual costs reduces a $50,000 investment’s terminal value by approximately $32,000, a figure that scales proportionally across the six-figure balances many Australians will carry into their peak accumulation years.
The most meaningful figure for any superannuation member is their ultimate retirement balance, not the fee percentage displayed on a comparison website. Until regulators require funds to disclose the total cost impact on that balance, members are comparing products using numbers that do not capture the full picture.
At $4.5 trillion, the system is too large and too consequential for disclosure rules that permit structural costs to remain invisible. Standardised, comprehensive cost reporting is not an enhancement; it is a precondition for the system functioning as intended.
This article is for informational purposes only and should not be considered financial advice. Investors should conduct their own research and consult with financial professionals before making investment decisions.
—
Hidden superannuation fees in Australia refer to structural costs not captured in standard fee disclosures, including pooled capital gains tax drag, swap-based derivative financing spreads, franking credit allocation differentials, and undisclosed benchmark tilts that can collectively reduce a member's retirement balance by tens of thousands of dollars over a working life.
Research from Stockspot estimates that a concealed annual cost drag of 0.5% to 1% can compound into tens of thousands of dollars in lost retirement savings over a full working life, with a 1% annual cost difference reducing a $50,000 investment's terminal value by approximately $32,000 over 20 years.
In pooled super trusts, when any member exits, switches options, or draws down their balance, assets may be sold and any resulting capital gains tax is shared across all remaining members in the pool, meaning long-term members bear an accumulating tax burden from transactions they did not initiate.
Under Regulatory Guide 97, super funds must disclose administration fees, investment fees, the indirect cost ratio, and insurance premiums, but structural costs such as pooled capital gains tax drag, swap financing spreads, and franking credit allocation methodology are not required to be separately reported.
Genuine transparency would require regulators to mandate disclosure of pooled capital gains tax drag, swap-based financing spreads, franking credit allocation methodology, benchmark identity for all index options, and a standardised net-retirement-balance-impact metric projecting the total cost effect on a member's balance at retirement using consistent assumptions.