JDO Shares Collapse 46% After Judo Capital Breaks April Guidance
1 hr ago

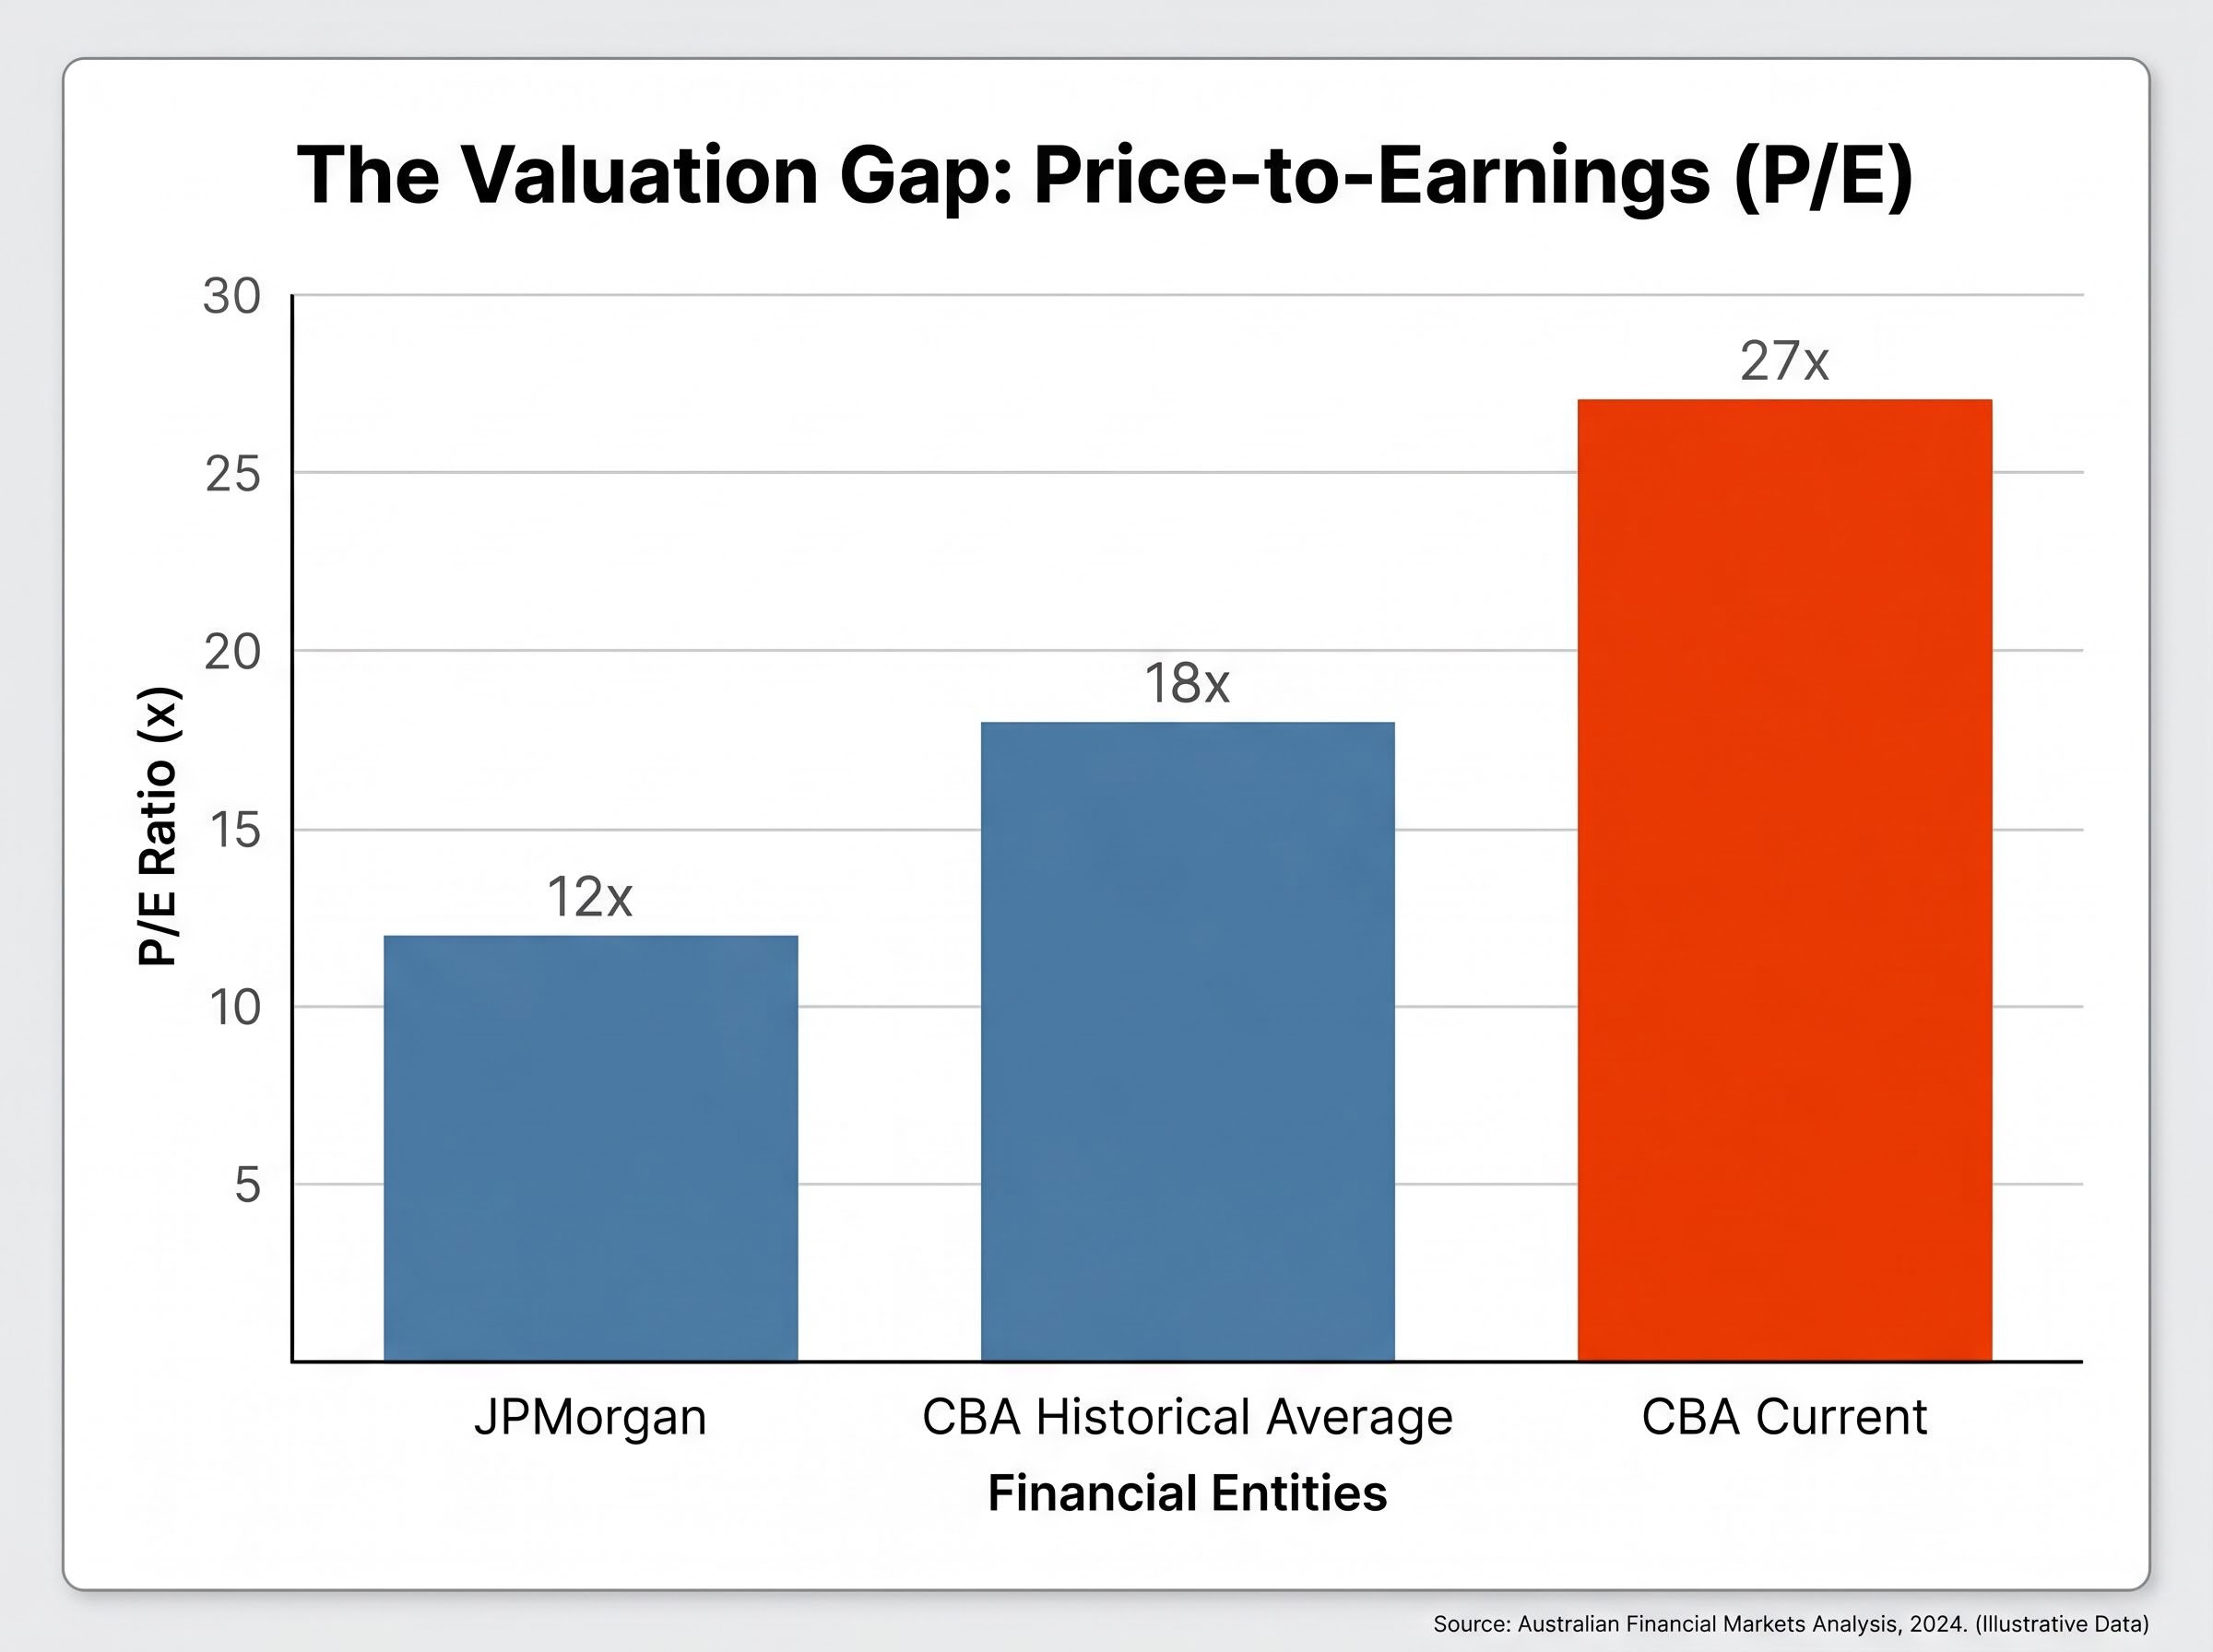
Commonwealth Bank trades at roughly 27x earnings. JPMorgan trades at approximately 12x. That gap, more than any single earnings result or dividend announcement, is the argument that has driven Morgans to issue sell ratings across all four of Australia’s big four banks as of late April 2026. The ratings arrive after a strong earnings season, not before it, with price targets implying downside ranging from 11% on Westpac to 28% on CBA. Record profits have not resolved the overvaluation question; according to Morgans’ framework, they have deepened it, as strong results were rewarded with higher share prices that widened rather than closed the gap to analyst targets.
What follows maps the specific downside projections for each bank, explains the valuation logic underpinning the bearish case, identifies where the consensus fractures (particularly around ANZ), and outlines the conditions that would need to change before sell ratings give way. For investors with bank stock exposure, the aim is a clearer framework for deciding whether to hold, trim, or reassess.
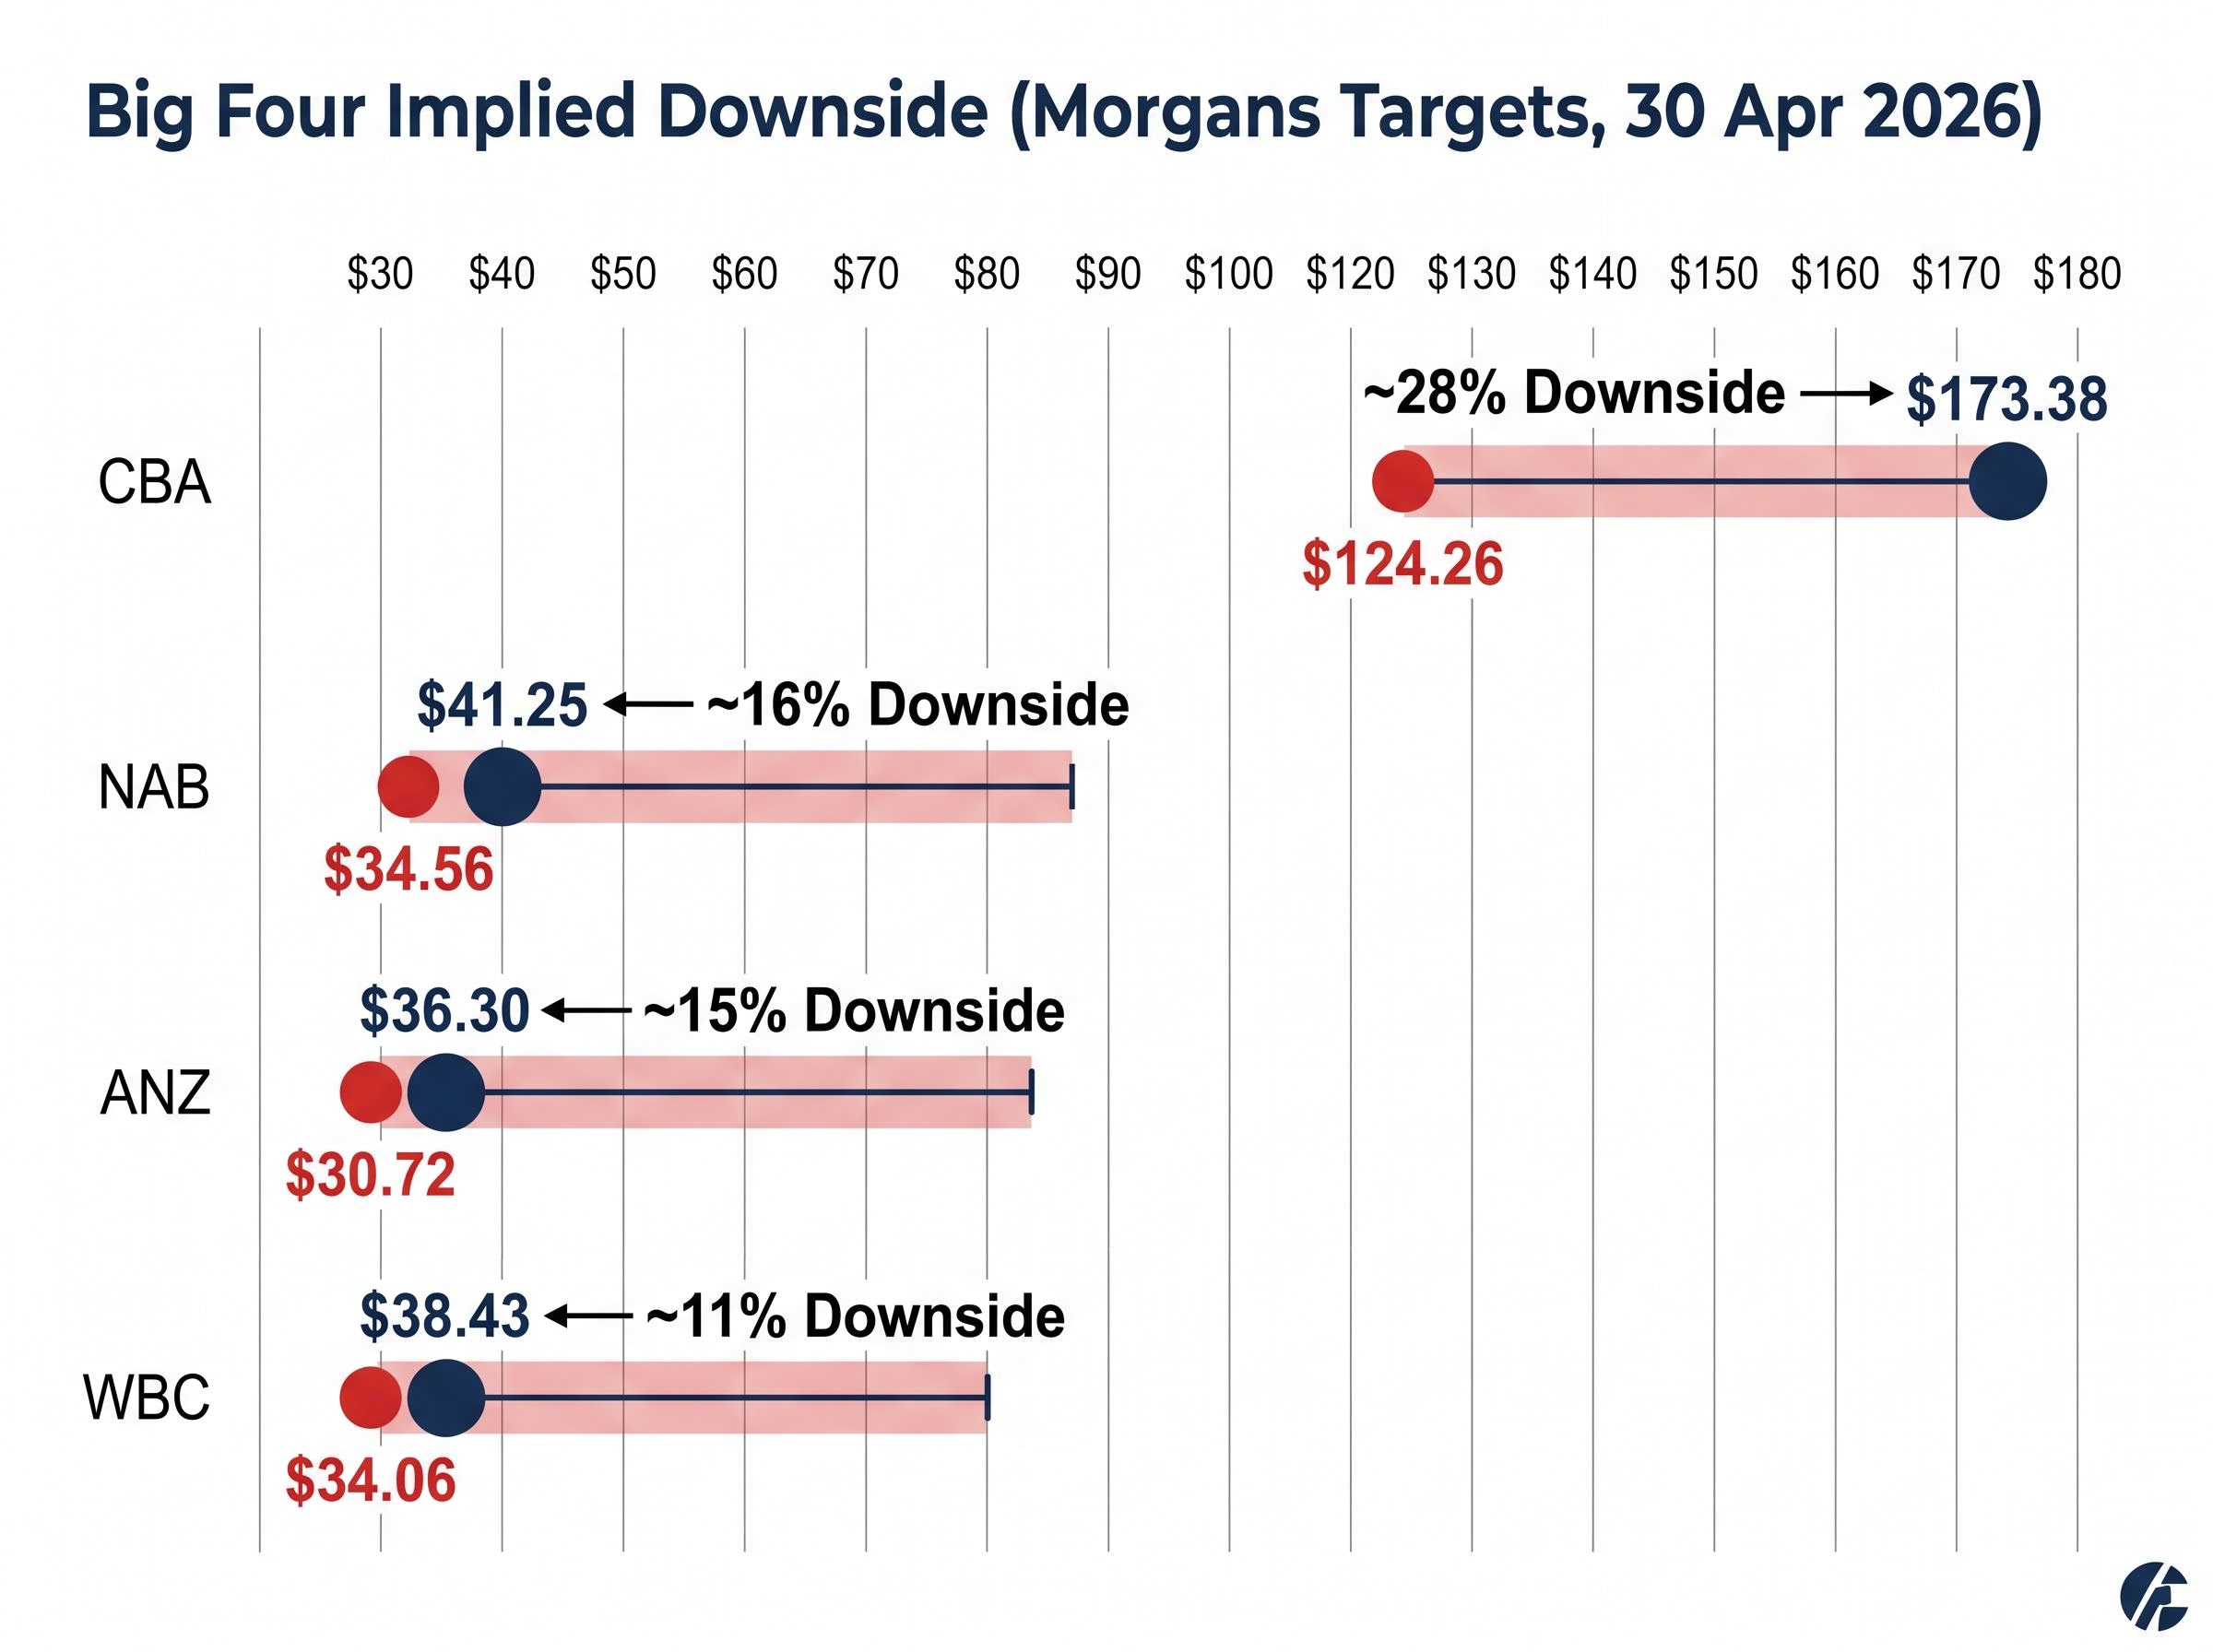
The scale of implied downside across all four names is the place to start. Morgans issued or reiterated sell ratings in late April 2026, meaning these reflect the broker’s view after digesting a record-breaking earnings season.
| Bank | Share Price (30 Apr 2026) | Morgans Target | Implied Downside |
|---|---|---|---|
| CBA | $173.38 | $124.26 | ~28% |
| NAB | $41.25 | $34.56 | ~16% |
| ANZ | $36.30 | $30.72 | ~15% |
| WBC | $38.43 | $34.06 | ~11% |
CBA’s implied downside of approximately 28% is the most striking figure in the set, representing the largest gap between market price and broker target among the four.
Recent share price weakness has not produced meaningful convergence toward any of these targets. In the final days of April alone, CBA fell 2.7%, NAB declined 3.1%, ANZ slipped 0.8%, and WBC dropped 2.4%. The broader ASX 200 declined approximately 1.13% over the same window. Bank-specific selling has been modestly heavier than the index, yet the gap to Morgans’ targets remains wide across all four names.
Morgans’ view does not sit in isolation: the broader analyst consensus across the Big Four shows sell or strong sell ratings on three of the four banks, with CBA drawing the most extreme bearish positioning, including a bear-case target of $90 that implies a potential 50% decline from late April 2026 prices.
CBA reported a first-half FY26 cash profit of $5.45 billion, beating market expectations. Morgans responded by lifting its earnings per share (EPS) and dividend per share (DPS) forecasts. The sell rating stayed.
That sequence is the core of the valuation argument. Strong earnings have not changed the rating because the bar for a rating change is primarily price-driven, not earnings-driven. At current levels, Morgans models a total shareholder return (TSR) for CBA of approximately -24%, inclusive of an estimated 3% dividend yield. The problem is not the profit; the problem is the price being paid for it.
The valuation gap becomes clearer in comparative terms:
Morgans models a total shareholder return for CBA of approximately -24% at current prices, inclusive of an estimated 3% dividend yield.
ASX financials rose approximately 5.1% following the February-March 2026 earnings season. That post-earnings rally is part of the problem Morgans identifies: strong results have been rewarded with higher prices, which pushes valuations further above targets rather than closing the gap. Each upward move on earnings momentum makes the sell case more emphatic, not less.
The valuation concern extends beyond individual stock selection into portfolio construction: ASX 200 index concentration risk means that superannuation funds and passive domestic equity holders are effectively running an undisclosed bet on four banks, given the sector represents roughly 25% of the index by market capitalisation.
A price-to-earnings ratio is one of the most widely referenced valuation measures in equity markets. For investors holding Big Four bank shares through superannuation or direct equity, it provides a straightforward way to evaluate whether the price being paid is proportionate to what the company earns.
Peer-reviewed P/E ratio research on commercial banks supports the view that sustained premium multiples create compression risk when growth expectations fail to materialise, with mean reversion toward sector historical averages representing the base case outcome over multi-year holding periods.
The RBA cash rate remains at 4.35% as of March 2026. Sustained high rates have supported bank net interest margins (NIMs), the difference between what banks earn on loans and pay on deposits, contributing to elevated recent earnings. Analysts flag, however, that slowing credit growth represents a risk to the earnings base that underpins current multiples.
Mean reversion refers to the tendency for financial metrics to return toward their long-run averages over time. If CBA’s multiple were to revert to its historical average of approximately 18x without any change in underlying earnings, the implied share price would be materially lower than today’s $173.38.
This is not a prediction of imminent decline. It is a structural framing tool. Any stock trading at a significant premium to its own history carries the risk that the premium will not persist, and the longer it persists, the larger the potential adjustment if sentiment shifts.
A simultaneous sell rating across all four banks suggests a uniform view, but the analyst community is genuinely split on ANZ. The divergence is worth examining rather than dismissing.
| Data Point | ANZ | CBA |
|---|---|---|
| Morgans Target Downside | ~15% | ~28% |
| Avg. Analyst Target Downside | ~4% | Strong sell consensus |
| Most Bullish Target | $43 | N/A |
| Implied Range | ~15% down to ~19% up | ~28% down (Morgans) |
Among 16 covering analysts, approximately 6 hold buy or strong buy ratings on ANZ. The average TradingView price target of approximately $34.75 implies only around 4% downside from the current $36.30, a far narrower gap than any of its peers face. One analyst target sits at $43, implying approximately 19% upside.
ANZ’s analyst split reflects genuine disagreement on the margin expansion trajectory following the Suncorp acquisition integration, with Q1 2026 net interest margin expanding 2 basis points to 1.56% and six of fourteen covering analysts holding buy ratings despite Morgans’ $30.72 target implying 15% downside.
Morgan Stanley has projected that ANZ could outperform CBA by approximately 20% in return terms during 2026, positioning it as the relative buy within the sector.
Morgans still holds a sell at $30.72, implying approximately 15% downside. The bearish case has not disappeared for ANZ, but the breadth of disagreement among analysts makes it the most contested valuation case in the group. For investors considering whether to reduce bank exposure uniformly, that distinction matters.
Many Australian retail holders own Big Four bank shares primarily for yield. The capital return analysis above tells one story; the dividend profile tells a related but distinct one.
WBC’s rising dividend trajectory and ANZ’s higher yield offer genuine income appeal. The complication is the capital side. Even with CBA’s 3% yield included, Morgans’ modelled TSR at current prices remains approximately -24%. A yield that covers a fraction of the projected capital decline does not make the total return equation favourable under this framework.
Dylan Evans of Catapult Wealth has noted that the current environment could be suitable for investors to realise gains on CBA holdings.
For income-oriented holders, the question becomes whether the dividend stream is sufficient compensation for remaining exposed to what Morgans frames as significant capital risk. The answer depends on time horizon and individual circumstances, but the gap between yield and modelled downside is not a narrow one.
Rather than treating the sell ratings as a final verdict, investors can monitor the specific conditions under which the bearish thesis would weaken. Four implicit reversal conditions emerge from the research:
Morgans’ post-1H26 CBA note is instructive. The broker lifted EPS and DPS forecasts following the record $5.45 billion result, yet the sell rating remained. The rating is anchored to price, not profit trajectory.
CBA’s CET1 capital tightness adds a further constraint. Even if earnings continue to beat, capital limits cap the DPS upside that would typically support a re-rating. With CBA having gained approximately 12.4% year-to-date into mid-April, the distance between the current share price and any Morgans target illustrates how much price normalisation would be required before the analyst community might shift to neutral.
The 2026 rally in ASX bank shares has been highly uneven at the stock level, with a 10.5 percentage point spread between the best and worst performer in the group, suggesting that sector-wide allocation decisions carry less analytical weight than individual bank selection in this environment.
The bar is high. The stock needs to fall substantially, not simply stop rising.
Australia’s Big Four have delivered strong earnings, continued dividend growth, and maintained credit quality through an extended high-rate environment. Analyst sell ratings have not only persisted through these results but deepened in conviction as prices remained elevated.
The income case for long-term holders is legitimate. A 3-4% yield is real money. It does not, however, offset a modelled -24% TSR at current prices under Morgans’ framework.
ANZ’s divergent analyst profile is worth treating as a genuine intra-sector distinction rather than a footnote. Investors reviewing Big Four positions may find that a uniform sell-everything conclusion is less useful than a bank-by-bank assessment of where the consensus actually sits.
The conditions for a ratings reversal are known and monitorable: price decline, capital returns, earnings upgrades beyond current forecasts, and shifts in the rate trajectory. That makes this a moment for active reassessment rather than passive continuation of existing positions.
This article is for informational purposes only and should not be considered financial advice. Investors should conduct their own research and consult with financial professionals before making investment decisions. Past performance does not guarantee future results, and financial projections are subject to market conditions and various risk factors.
Morgans' sell ratings are driven by valuation, not earnings quality. Even after record results, the big four banks, particularly CBA at roughly 27x earnings, trade well above their historical averages and international peers, meaning the price paid for each dollar of profit is considered excessive under the broker's framework.
A price-to-earnings (P/E) ratio divides a company's share price by its earnings per share, so a P/E of 27x means you are paying $27 for every $1 of annual profit. For the big four banks, current multiples significantly exceed their historical averages and comparable global banks like JPMorgan, which trades at roughly 12x, indicating stretched valuations according to analysts.
As of late April 2026, Morgans' price targets imply downside of approximately 28% for CBA (target $124.26), 16% for NAB (target $34.56), 15% for ANZ (target $30.72), and 11% for Westpac (target $34.06) from their respective share prices at the time.
ANZ is the most contested valuation case among the big four, with roughly six of sixteen covering analysts holding buy or strong buy ratings, an average analyst target implying only around 4% downside, and one bullish target of $43 implying approximately 19% upside. Morgan Stanley has also projected ANZ could outperform CBA by around 20% in return terms during 2026.
Morgans has indicated four key reversal conditions: a material share price decline toward their target prices, meaningful capital return or buyback programmes, sustained earnings upgrades beyond current forecasts, and shifts in the RBA rate trajectory, with the current cash rate sitting at 4.35% as of March 2026.