
Samsung Rout Anchors Global Selloff as Bonds and Stocks Fall Together
2 hrs ago
With the RBA cash rate at 4.10% and two major banks forecasting further hikes through mid-2026, ASX bank shareholders face a deceptively simple question: are rising rates good news or bad news for National Australia Bank (NAB)? The answer depends on understanding a mechanism most retail investors rarely examine closely, specifically how banks fund their lending, how that funding reprices when rates move, and where the cracks begin to appear in a prolonged high-rate environment.
NAB’s Q1 FY26 results, released earlier this year, provide a data-rich case study for working through this question. What follows explains the mechanics of interest rate impacts on ASX bank profitability, uses NAB’s current financials as the worked example, and gives income-focused investors a clear framework for assessing whether dividend forecasts of $1.70 per share in FY26 through $1.76 in FY28 are credible under different rate scenarios.
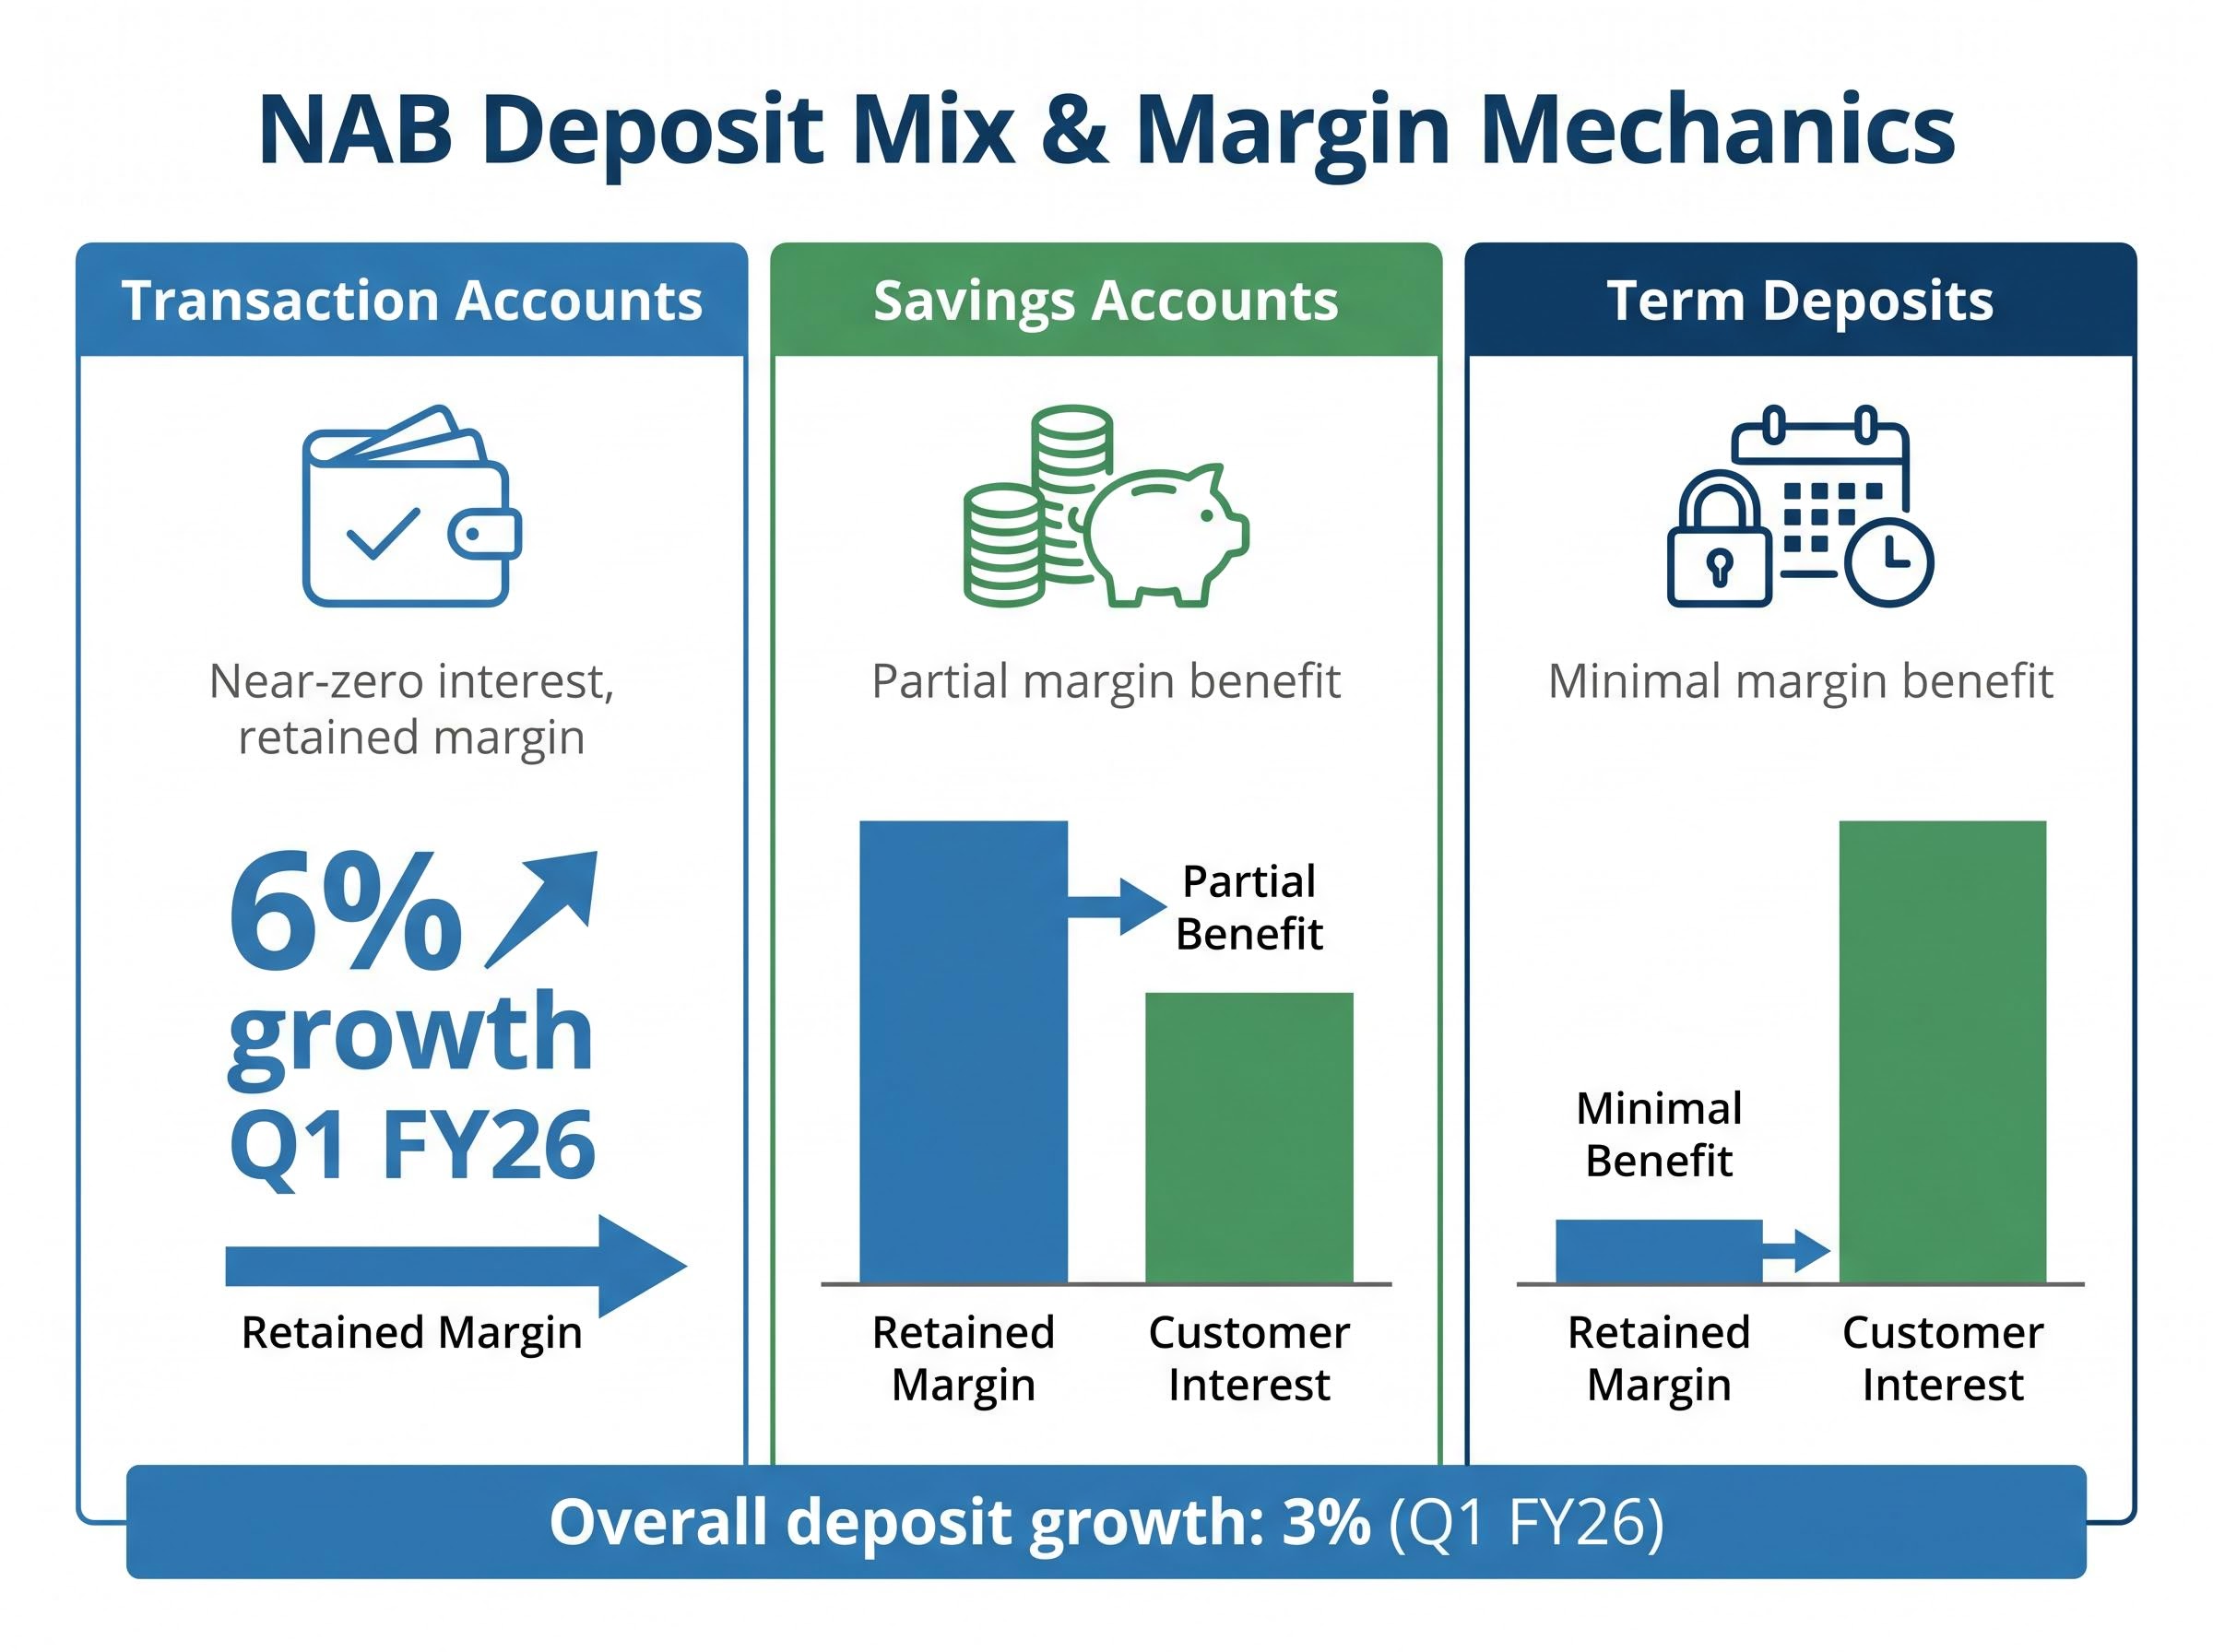
Not all deposits cost a bank the same amount. The cheapest money sitting on NAB’s balance sheet is also the stickiest: transaction accounts. These balances, the everyday accounts customers use for wages and bill payments, pay near-zero interest regardless of where the RBA cash rate sits. When NAB deploys those deposits into variable-rate loans that reprice upward with each RBA move, the spread between what it earns and what it pays widens automatically.
That funding base is growing. NAB reported 6% transaction account growth (excluding offsets) in Q1 FY26, a figure that strengthens the rate leverage argument considerably.
Q1 FY26 Headline: NAB’s transaction account balances grew 6% (excluding offsets), expanding the bank’s lowest-cost funding base during a rising rate cycle.
To understand why this matters, consider how the three main deposit types behave differently when rates rise:
Overall deposit balances across NAB’s business, private, and personal banking grew 3% in Q1 FY26. The fact that transaction accounts grew at double that rate means the deposit mix is shifting in a margin-friendly direction, not just growing in volume.
Net interest margin (NIM) is the spread between what a bank earns on its loans and what it pays for its deposits, expressed as a percentage of its interest-earning assets. For Australian major banks, NIM is the primary earnings driver. When it moves by even a few basis points across a loan book the size of NAB’s, the dollar impact on profits is substantial.
The transmission works as a sequence. When the RBA raises the cash rate, variable-rate mortgages and business loans reprice almost immediately. Borrowers start paying more within weeks. On the funding side, however, not all deposits reprice at the same speed or to the same degree. Transaction accounts, as outlined above, barely move. Savings accounts adjust with a lag. Term deposits reprice more aggressively. The gap between the immediate asset repricing and the delayed liability repricing is where margin expansion lives.
NAB’s NIM reached 1.80% in Q1 FY26, up 2 basis points from the prior period. That incremental improvement sits within the context of the broader peer group.
NIM expansion across ASX banks in Q3 FY26 was not limited to the Big Four: Bendigo Bank’s net interest margin reached 1.98%, up 6 basis points in the same period, partly driven by business and agricultural lending growth at 12.7% annualised, a segment that carries higher margins than standard residential mortgages and illustrates how loan mix as well as deposit mix shapes the margin outcome.
| Bank | NIM (H1 2025) | Relative position |
|---|---|---|
| CBA | 1.84% | Highest among majors |
| NAB | 1.80% (Q1 FY26) | In line with major bank average |
| Westpac | Slightly below NAB | Below average |
| ANZ | Slightly below NAB | Below average |
The major bank average NIM for H1 2025 was 1.81%. Rate forecasts suggest the tailwind has further to run: Westpac projects the cash rate reaching 4.85% by August 2026, while CBA expects a 0.25% hike in May 2026.
This dynamic is not unlimited. As rates remain elevated, customers shift balances from transaction accounts into higher-yield savings products, gradually eroding the cheap funding advantage. Mortgage market competition compounds the pressure; banks compete aggressively on both fixed and variable rates to retain and attract borrowers, compressing asset yields even as funding costs climb.
The result is a NIM curve that flattens and eventually turns. Early-cycle rate rises tend to be the most margin-friendly. Late-cycle persistence is where the compression begins.
The NIM story has a counterweight, and the data is already showing it. Higher rates increase debt-servicing costs for mortgage holders and business borrowers. When those costs exceed household budgets, arrears rise. When arrears persist, banks book impairment charges that reduce reported earnings.
The transmission chain works in four steps:
NAB’s H1 FY26 impairment data shows this dynamic playing out in real time.
H1 FY26 credit impairment charges: $706 million, reflecting broader economic pressures across the loan book. The May 4 half-year results will update this figure with full second-quarter data.
A separate $503 million impairment related to Middle East volatility, reported by Reuters in April 2026, adds a geopolitical dimension to the credit risk picture. NAB’s collective provisions to credit risk-weighted assets stood at 1.31% in Q1 2026, down from September 2025 levels. That declining buffer, combined with rising impairment charges, represents the tension income investors need to monitor: the margin tailwind is real, but the credit cost headwind is accelerating alongside it.
NAB’s capital plan, which includes up to $1.8 billion in capital initiatives and a targeted CET1 ratio above 12.0%, is directly connected to the $706 million impairment charge reported in H1 FY26; the $300 million forward-looking collective provision build against Middle East conflict exposure accounts for a significant portion of that headline figure.
Consensus dividend forecasts, sourced from CMC Invest projections, point to modest growth across the next three financial years. The variance between different forecast sources is narrow but worth noting.
| Financial year | Forecast DPS | Grossed-up DPS (30% tax rate) | Approx. grossed-up yield at $41.80 |
|---|---|---|---|
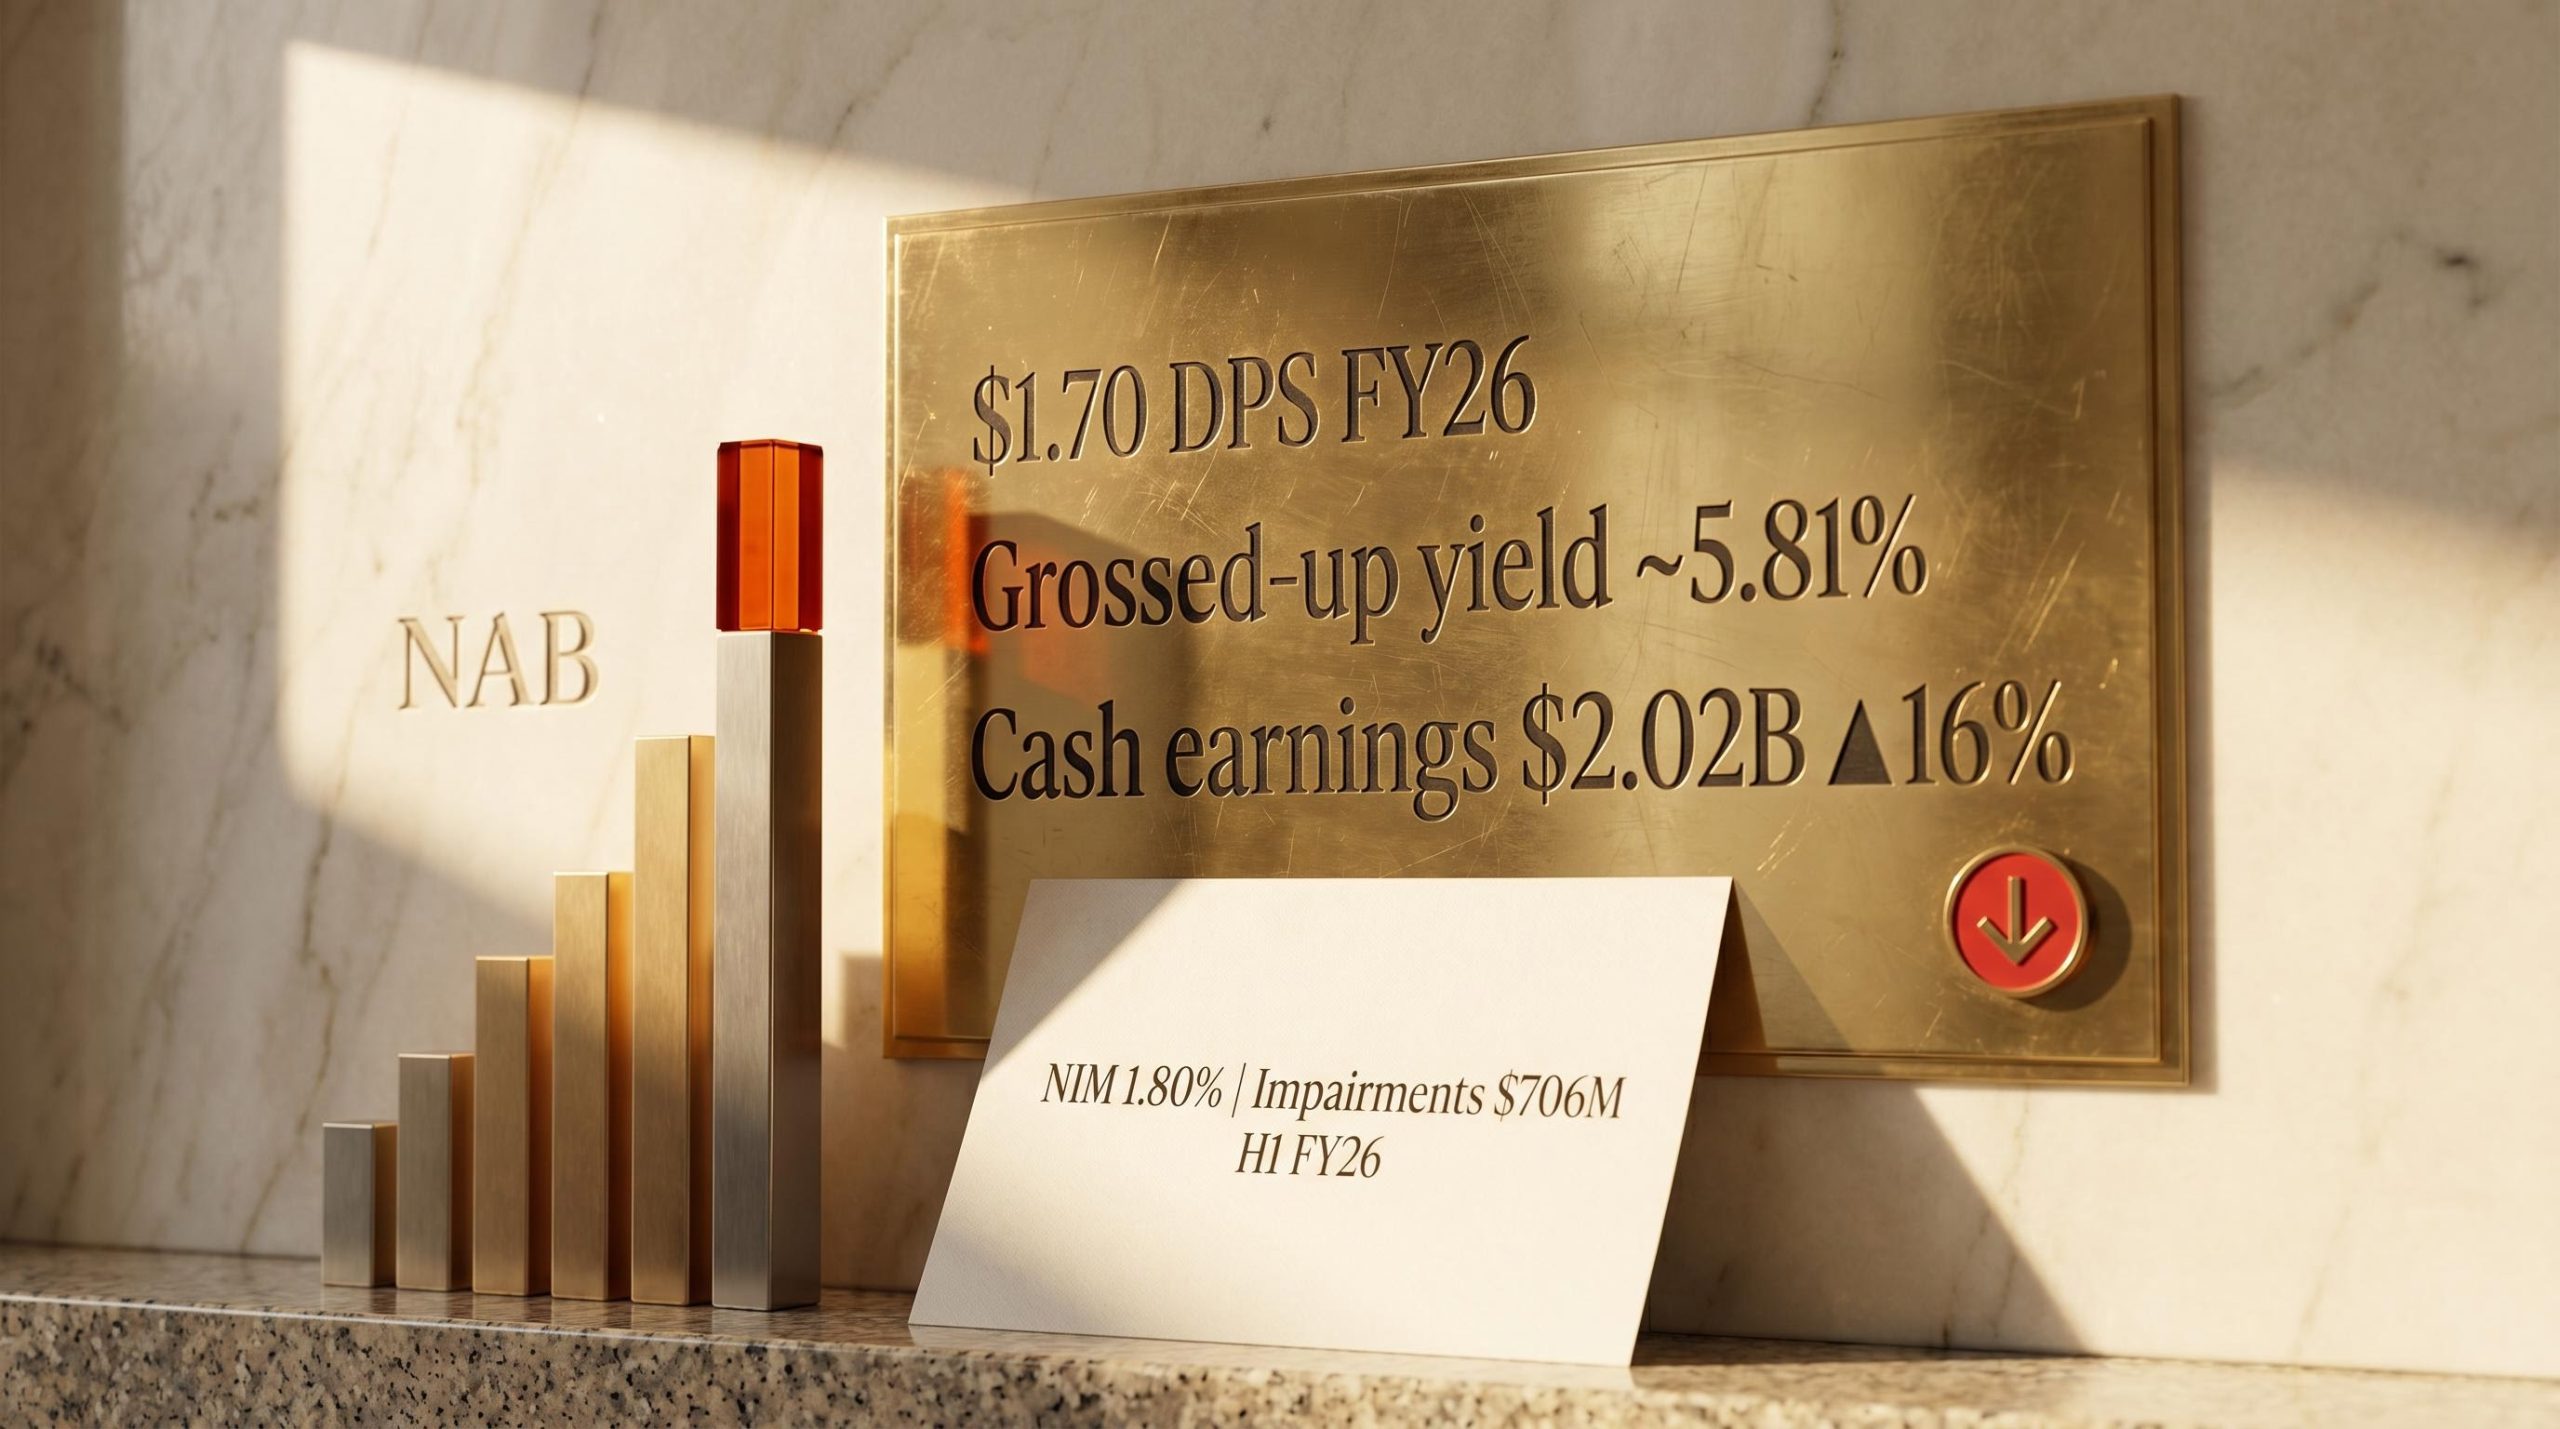
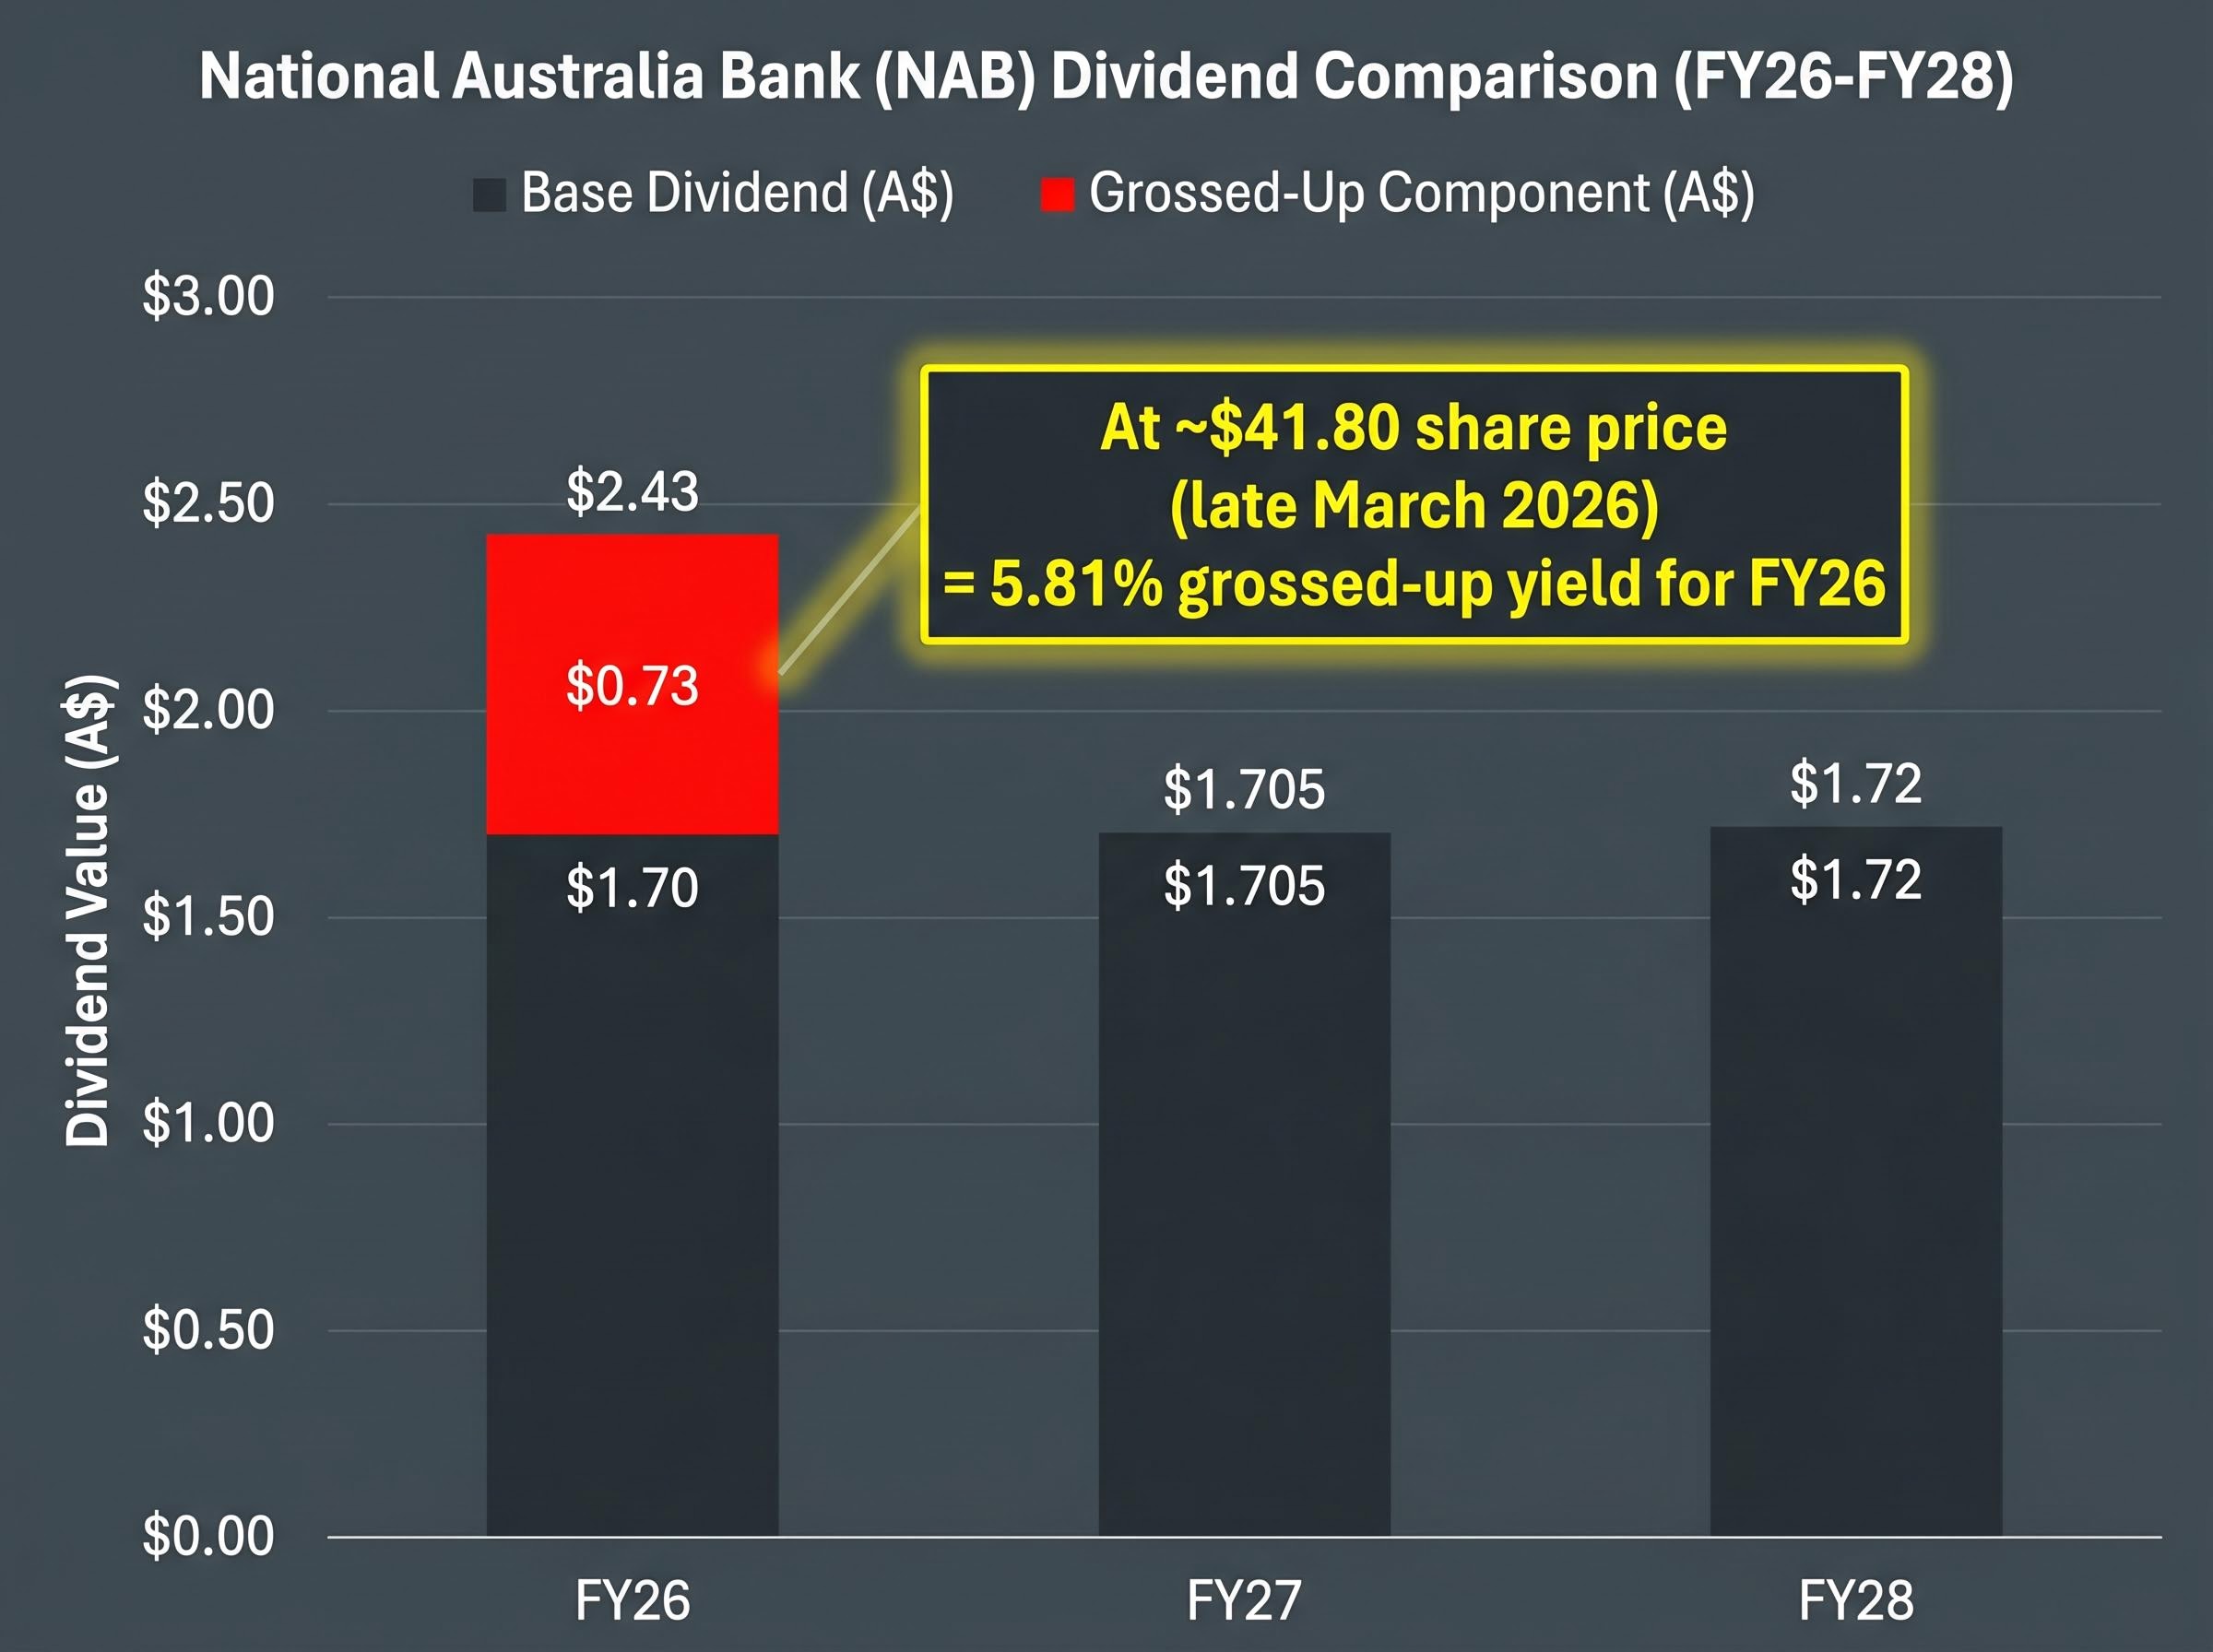
| FY26 | $1.70 | $2.43 | 5.81% |
| FY27 | $1.705 | $2.44-$2.47 | 5.83-5.91% |
| FY28 | $1.72 | $2.46-$2.51 | 5.89-6.00% |
The grossed-up yield calculation works as follows: a fully franked dividend of $1.70 carries a franking credit of approximately $0.73 (calculated as $1.70 multiplied by 30/70), producing a grossed-up dividend of approximately $2.43. At NAB’s share price of approximately $41.80 in late March 2026, that produces a grossed-up yield of approximately 5.81%.
NAB’s Q1 FY26 cash earnings of $2.02 billion, up 16% year on year, provide the earnings base that underpins these forecasts. The May 4, 2026 half-year results will confirm the FY26 interim dividend amount. The indicated ex-dividend date is May 7, 2026, with payment on July 2, 2026.
Three data points from the May 4 announcement will determine whether these forecasts hold:
All dividend figures cited above are analyst forecasts, not confirmed distributions, until the May 4 announcement.
NAB shares hit record highs following the Q1 FY26 earnings release. The analyst consensus tells a more cautious story.
The gap: NAB’s consensus analyst price target sits at $39.75. The share price, at approximately $41.80, trades above that target, implying the market is pricing in outcomes better than the average sell-side estimate.
Of the 16 analysts covering the stock, 6 rate it sell or strong sell. The maximum analyst target of $50.50 shows the range of views is wide, but the weight of caution is notable given the positive earnings momentum.
Big Four bank valuations entering the May 2026 RBA meeting sit well above analyst consensus targets across three of the four names, with the 10.5 percentage point spread between CBA’s monthly gain and NAB’s monthly decline in 2026 illustrating that stock selection within the sector has carried more weight than broad sector allocation during this rate cycle.
That divergence can be read two ways. The bull case and bear case sit side by side:
The mechanics, the data, and the analyst picture converge on a dual-edged conclusion. Early-cycle rate rises tend to benefit NIM and support dividends. Late-cycle rate persistence tends to pressure credit quality and cap further margin expansion, shifting the balance of risks. NAB sits at the point where both forces are active simultaneously.
Income investors can track the balance through three specific signals after each RBA decision and each NAB result:
NAB’s targeted productivity savings of more than $450 million in FY26 provide a partial offset to credit headwinds, supporting cost discipline even as impairment charges climb. Westpac’s forecast of a 4.85% cash rate by August 2026 and CBA’s projection of one more 0.25% hike in May 2026 set the rate backdrop against which these metrics will move.
The half-year results on May 4, 2026 will provide the most complete data update available. Three specific disclosures will confirm or revise the FY26 income thesis: the interim dividend amount, updated NIM guidance from management, and commentary on credit impairment trends and provisioning strategy for the remainder of the financial year.
The indicated ex-dividend date of May 7 means investors who wish to capture the interim dividend payment need to hold shares before that date.
NAB’s transaction account growth and NIM recovery position it well in the early phase of the current rate cycle. The 2 basis point NIM improvement in Q1 FY26, the 16% cash earnings growth, and the expanding low-cost deposit base all support the near-term earnings trajectory. Rising impairment charges, however, signal that credit risk is now the primary variable to watch.
The three-metric framework, NIM direction, collective provision coverage, and cash earnings payout ratio, provides the practical tool for ongoing monitoring. The May 4 results will deliver the most complete update on all three.
For income investors, the grossed-up yield of approximately 5.81% is competitive against fixed-income alternatives. The earnings momentum is real. The sustainability of that yield, however, depends on credit quality holding in an environment where household stress indicators are moving in the wrong direction. The May 4 half-year results announcement, available on the NAB investor relations page, will provide the data needed to reassess.
For investors who hold NAB through superannuation or ASX 200 index funds rather than direct positions, our deep-dive into ASX bank overvaluation risk examines how the Big Four’s approximately 25% weighting in the index creates a concentrated sector exposure that is easy to underestimate, including Morningstar’s analysis of current price-to-earnings and price-to-book multiples and what a valuation reset would mean for passive portfolio returns.
This article is for informational purposes only and should not be considered financial advice. Investors should conduct their own research and consult with financial professionals before making investment decisions. Past performance does not guarantee future results. All dividend forecasts cited are analyst projections, not confirmed distributions, and are subject to change based on market conditions and company performance.
—
Analyst consensus forecasts (sourced from CMC Invest projections) point to NAB paying $1.70 per share in FY26, $1.705 in FY27, and $1.72 in FY28, producing grossed-up yields of approximately 5.81% to 6.00% at a share price of around $41.80. These are analyst projections, not confirmed distributions, until NAB's May 4, 2026 half-year results announcement.
When the RBA raises the cash rate, NAB's variable-rate loans reprice upward almost immediately while low-cost transaction account deposits remain near zero, widening the spread between what NAB earns and what it pays. NAB's NIM reached 1.80% in Q1 FY26, up 2 basis points from the prior period, reflecting this dynamic in action.
Franking credits represent company tax already paid by NAB on its profits, which shareholders can use to offset their own tax liability. A fully franked dividend of $1.70 carries approximately $0.73 in franking credits, producing a grossed-up dividend of roughly $2.43 and a grossed-up yield of approximately 5.81% at NAB's share price of around $41.80.
The two primary risks are rising credit impairment charges (NAB reported $706 million in H1 FY26) and a share price that already trades above the consensus analyst target of $39.75, which limits capital upside and amplifies downside risk. Investors should monitor NIM direction, collective provision coverage ratios, and the cash earnings payout ratio after each result.
NAB's half-year results are scheduled for May 4, 2026, which will confirm the FY26 interim dividend amount. The indicated ex-dividend date is May 7, 2026, with payment scheduled for July 2, 2026, meaning investors must hold shares before May 7 to be eligible for the interim dividend.


