Iran Walks Out of Swiss Talks, Sending US Stock Futures Lower
1 hr ago

Three weeks after Bendigo and Adelaide Bank (ASX: BEN) reported a 7.6% lift in quarterly cash earnings, the stock has settled back toward its pre-results range. The initial 6-9% session surge on 9 April 2026 has faded, and the more useful exercise now is separating what the Q3 FY26 numbers reveal about the bank’s operating trajectory from what they leave unresolved. What follows is an analysis of the key metrics from BEN’s Q3 FY26 trading update, the margin and lending dynamics underneath the headline result, and the specific variables that will determine whether this quarter marks a genuine inflection or a one-period bounce.
Q3 FY26 cash earnings: $137.9 million, up 7.6% versus the 1H26 quarterly average.
The core metrics from the quarter:
Two valid growth readings exist for the same result, and conflating them would misread the quarter. The 7.6% figure compares Q3 cash earnings against the average of the two 1H26 quarters. A year-on-year comparison produces a figure closer to 12.8%. Both are legitimate; neither alone tells the full story. The first captures sequential momentum, the second captures the distance travelled in twelve months.
What sharpens the earnings picture is the cost line. Operating expenses fell 4.1% quarter-on-quarter, driven primarily by staff reductions. When earnings grow because revenue improves and costs decline simultaneously, the result carries more weight than a revenue-led beat alone. Credit expenses of just $2.1 million further flattered the bottom line, though that figure is unusually low and may not persist.
Net interest margin is the spread between what a bank earns on its loans and what it pays for its deposits, expressed as a percentage of interest-earning assets. It is the single most direct measure of a bank’s core profitability, and even small movements translate into material earnings impacts when applied across a lending book of BEN’s size.
BEN’s NIM rose from approximately 1.92% to 1.98% over the quarter. Three factors contributed:
The RBA’s March 2026 cash rate decision brought the official cash rate to 4.10%, with the Monetary Policy Board citing persistent services inflation as the primary rationale, a backdrop that directly influenced the asset repricing cycle benefiting BEN’s margin in Q3.
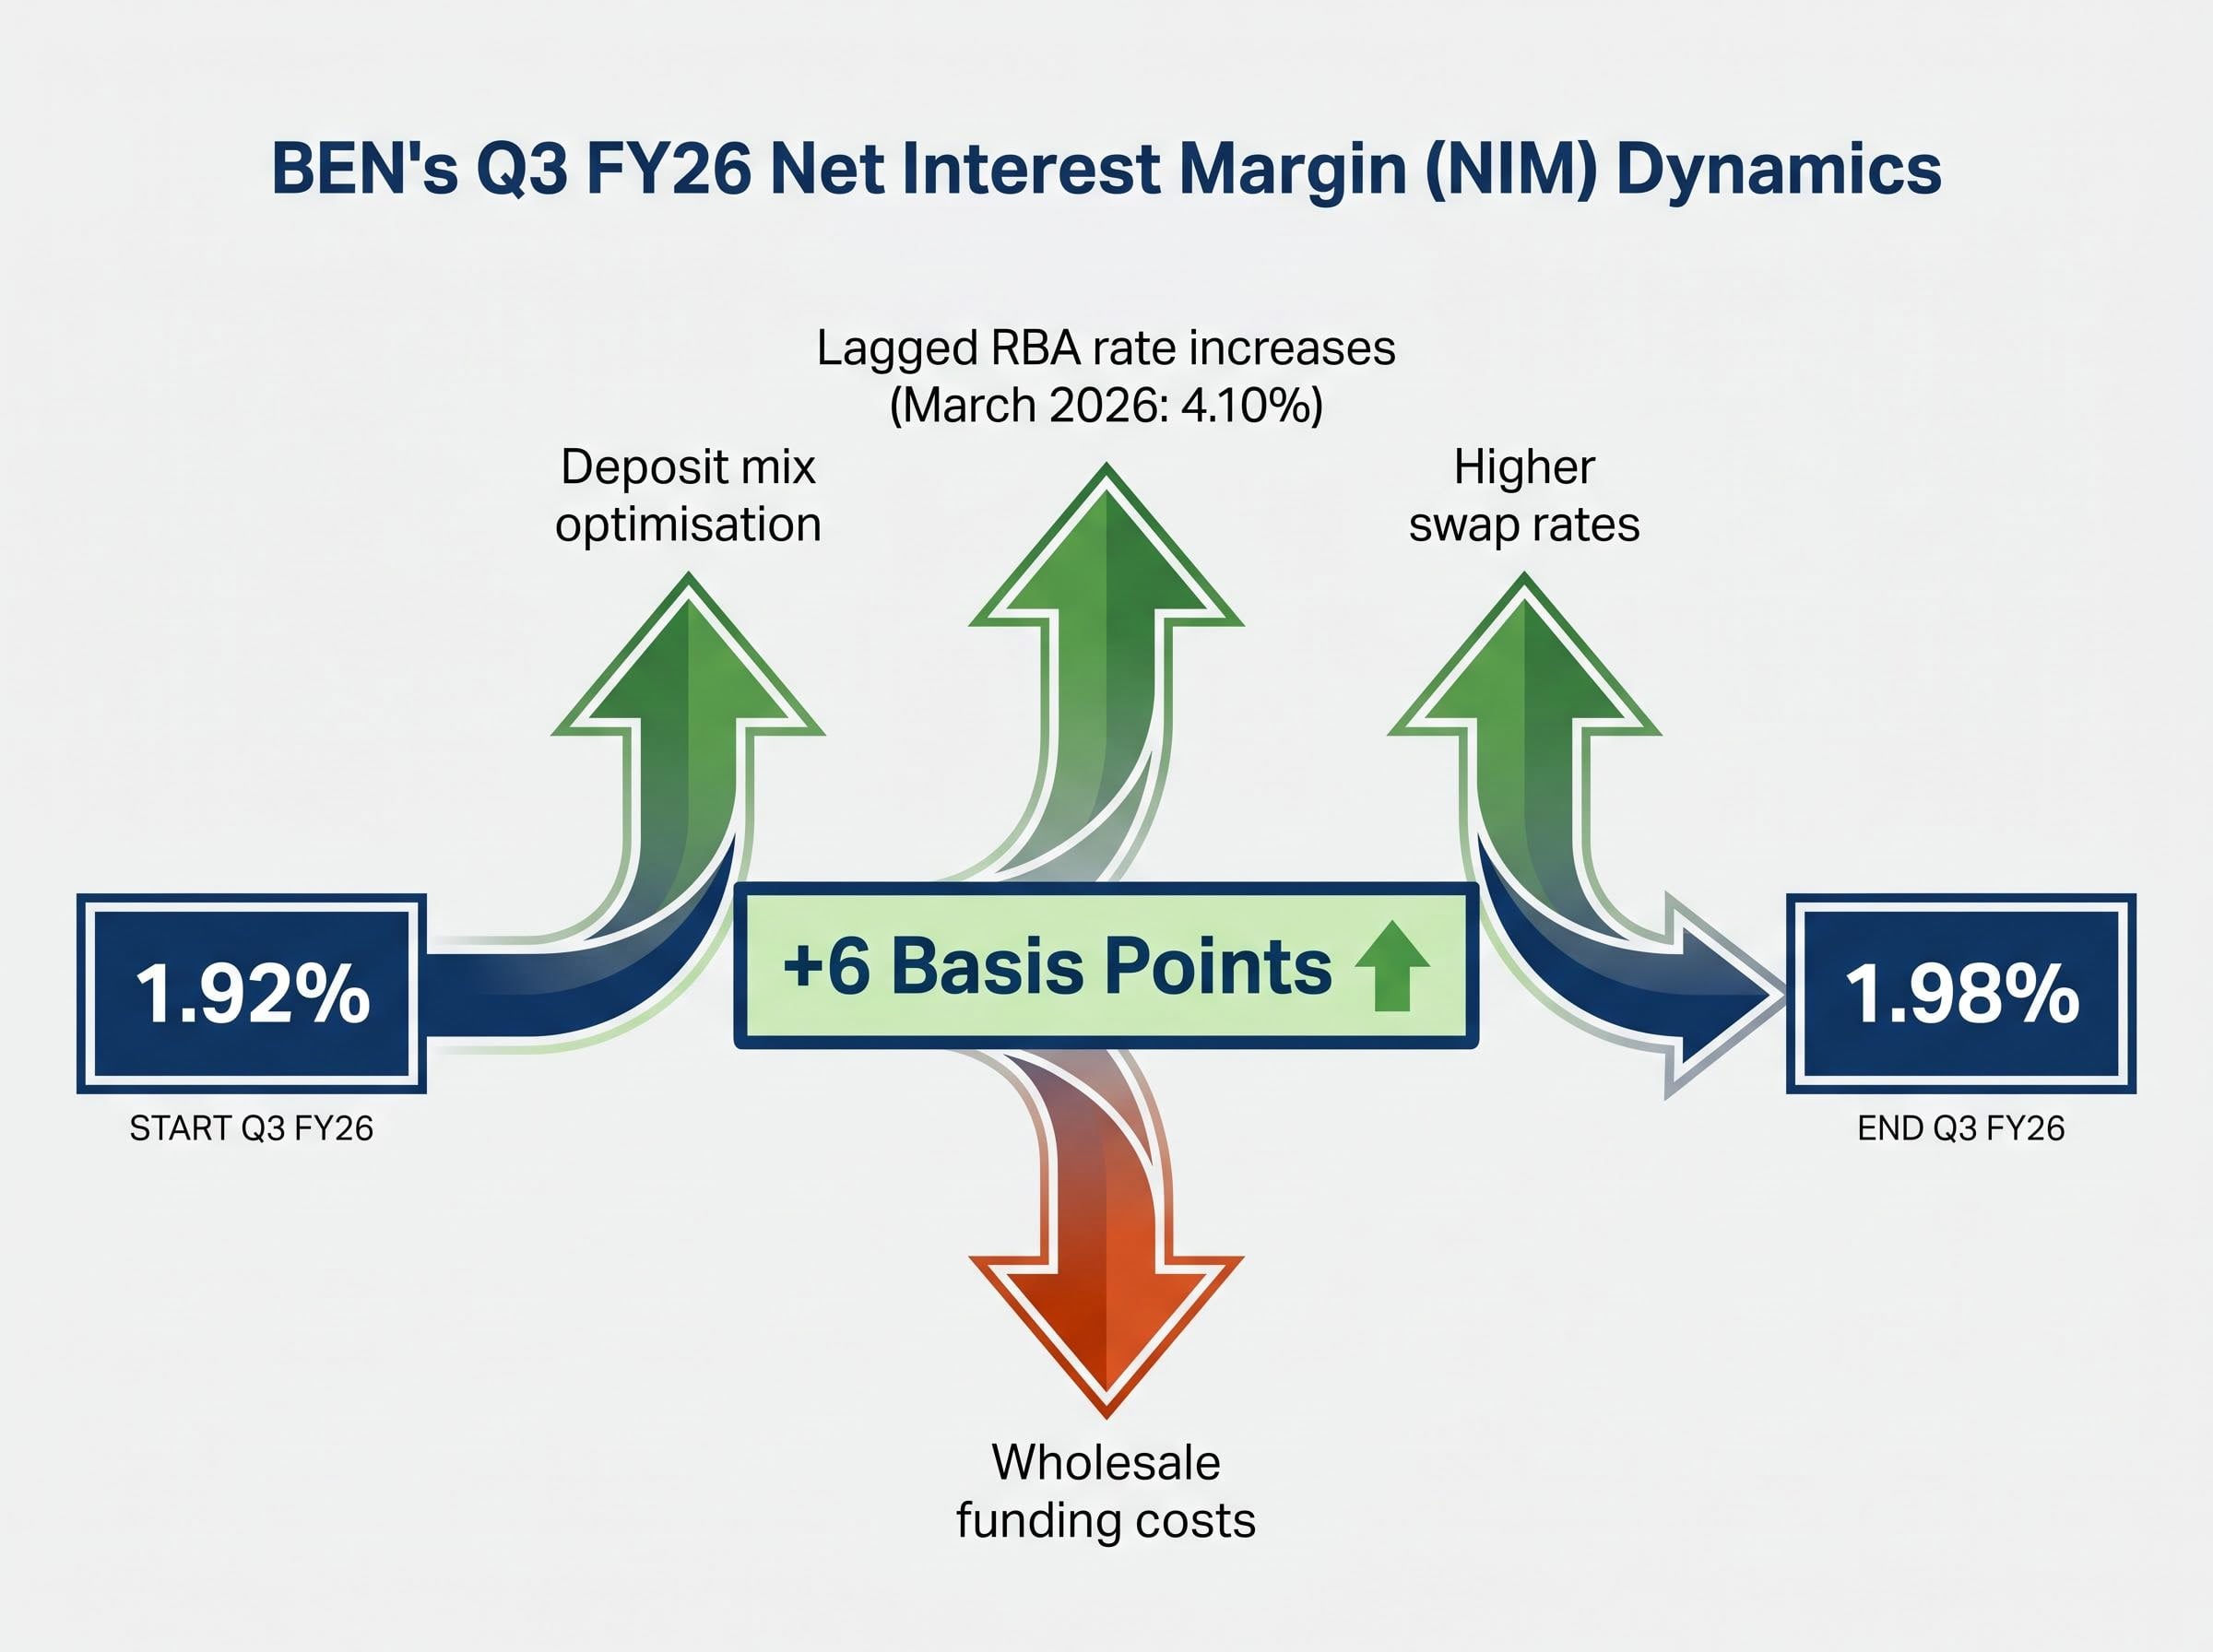
The interplay between these forces is what makes the NIM trajectory uncertain rather than simply positive. As term deposits roll off and are replaced, and as wholesale funding reprices, the net direction of margin will depend on whether asset-side repricing continues to outpace liability-side cost increases.
No RBA rate decision occurred between 9 April and 30 April 2026. The next scheduled meeting falls in May 2026, and any further rate movement would feed into BEN’s asset repricing cycle, though the funding cost headwind management identified could limit the net benefit.
BEN’s aggregate annualised lending growth of 5.6% is respectable. The composition underneath it is more revealing.
| Segment | Annualised Growth Rate | Strategic Significance |
|---|---|---|
| Residential lending | 4.2% | Broadly in line with or modestly above sector pace (approximately 2.1% quarterly sector growth) |
| Business and agri lending | 12.7% | Reflects regional franchise strength; higher-margin segment with SME and agricultural credit demand |
Residential growth at 4.2% annualised places BEN modestly above the broader sector trend of approximately 2.1% quarterly housing credit expansion, though precise RBA statistical data for the March/April 2026 period has not yet been published.
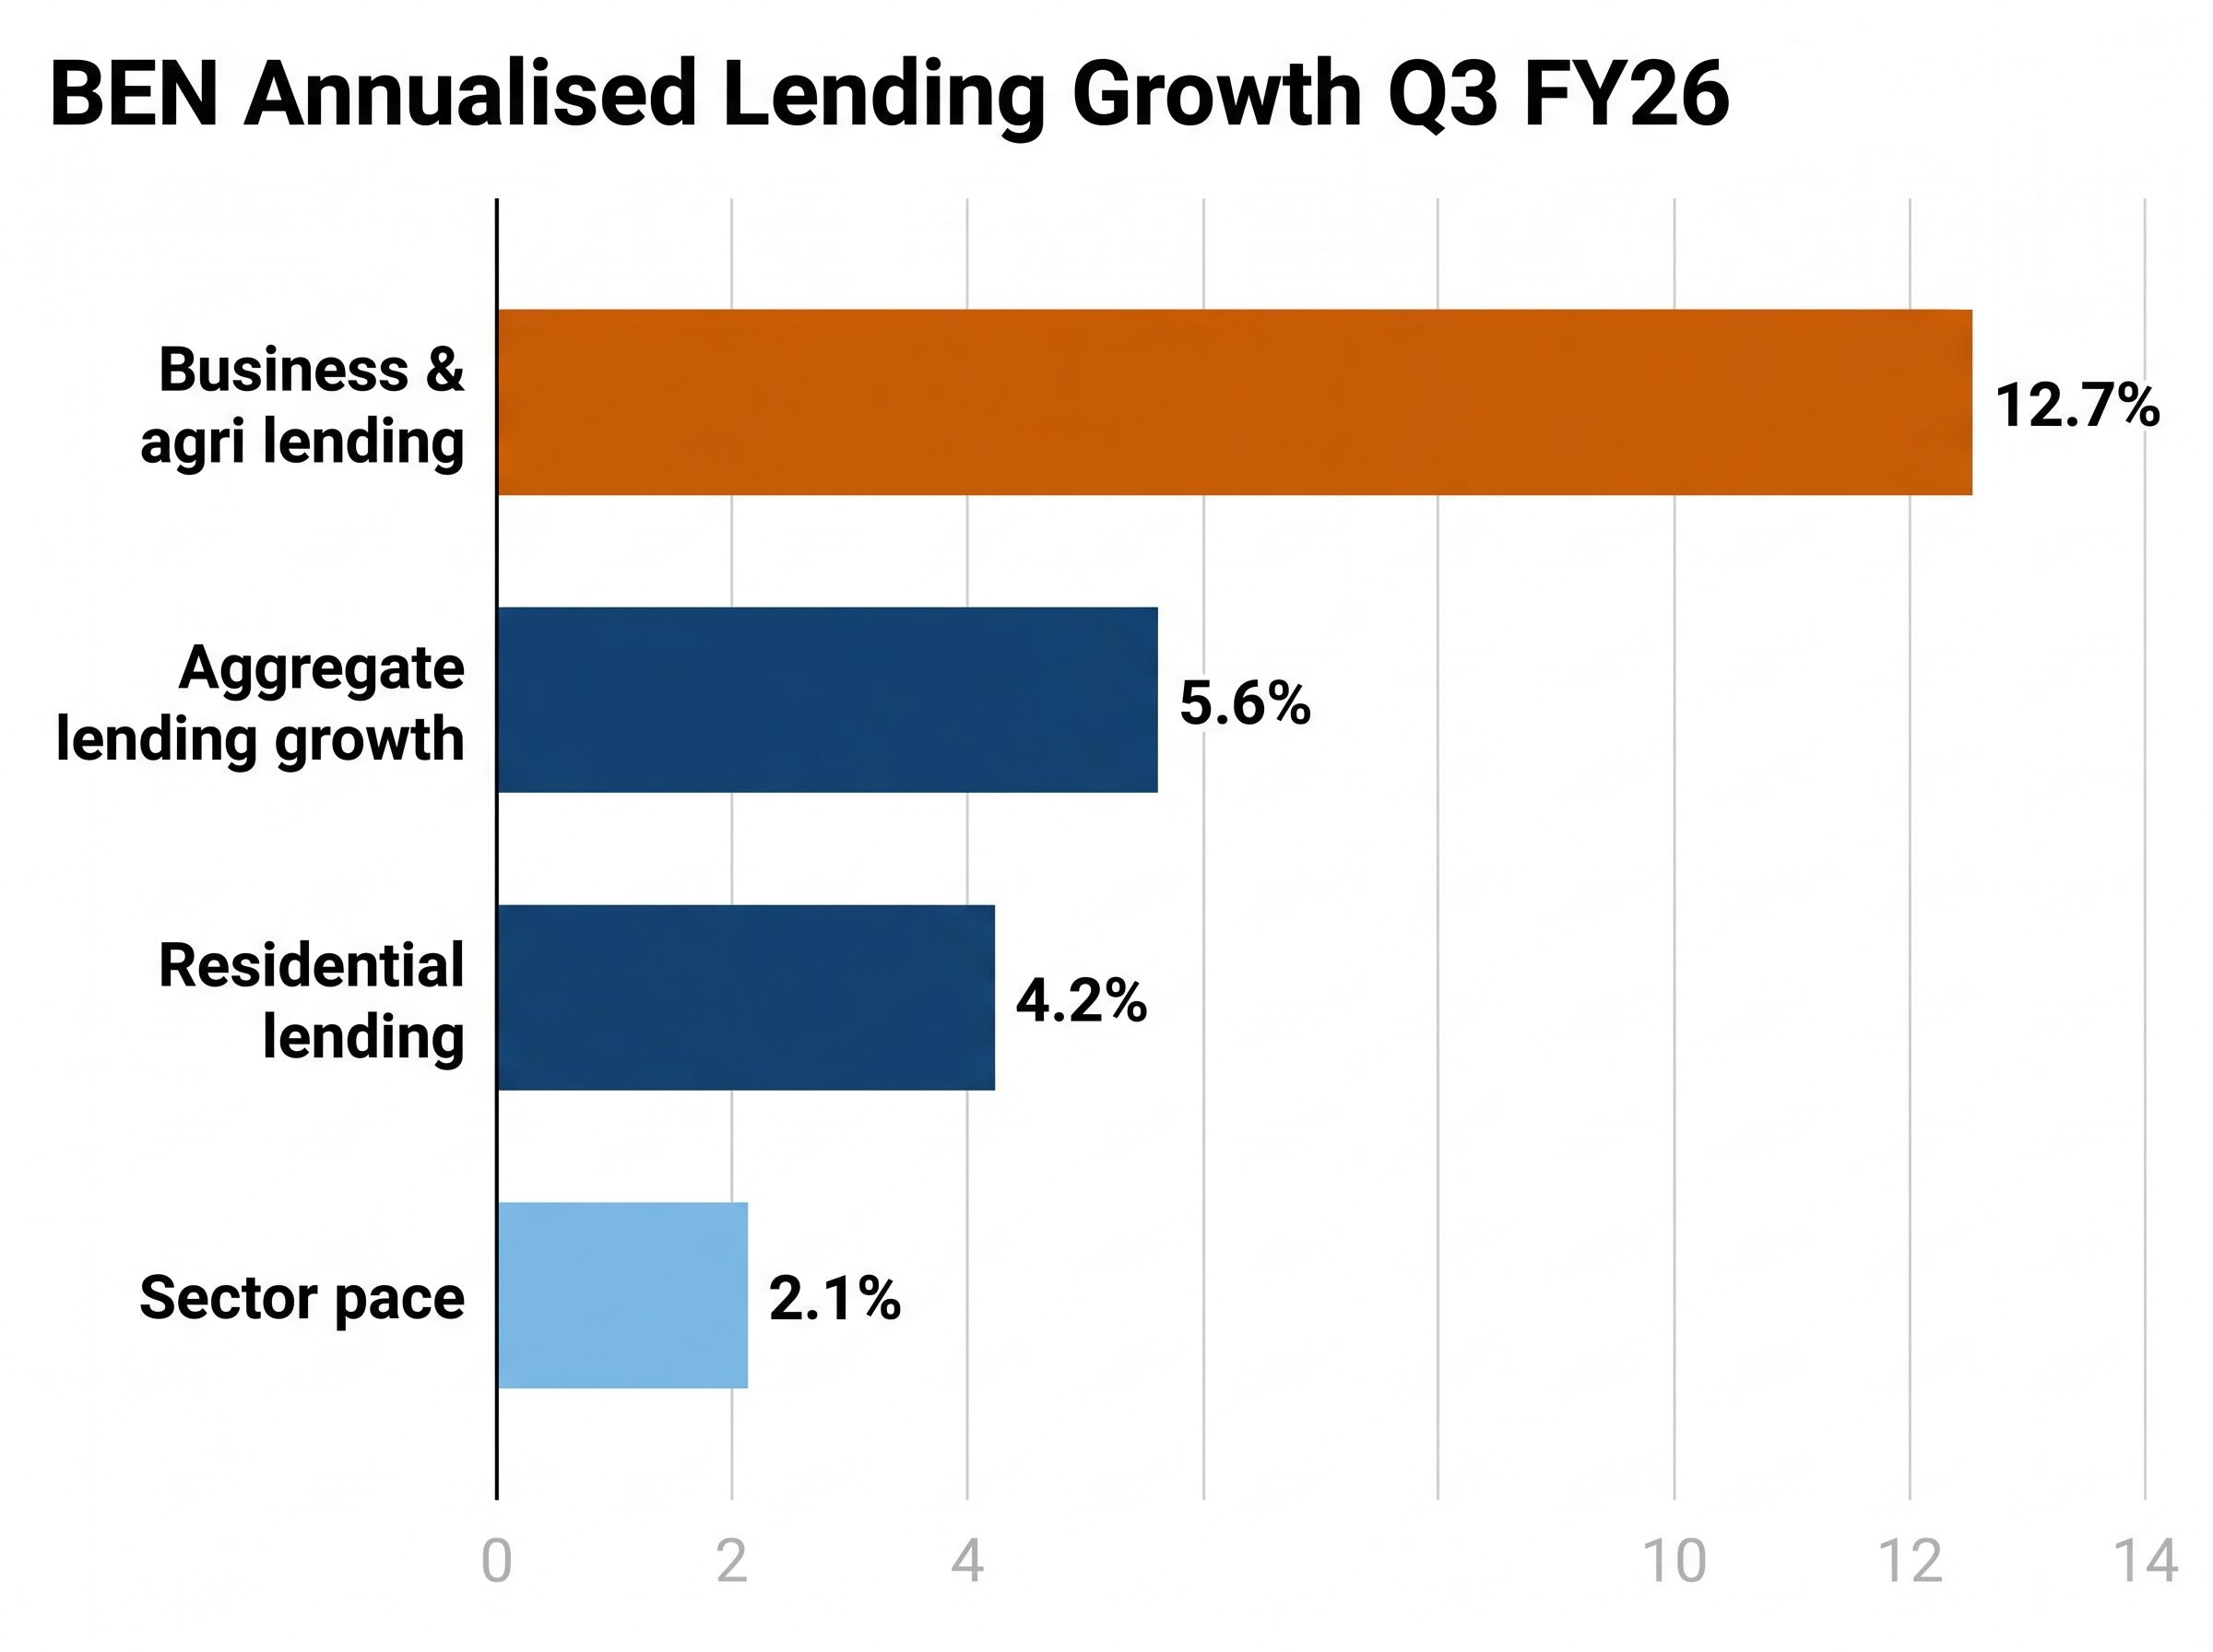
The business and agri segment, growing at three times the residential rate, is the more strategically interesting line. This is where BEN’s regional franchise carries a competitive advantage that major bank peers find difficult to replicate. Agricultural and SME credit demand in regional Australia has remained firm, and this segment typically carries higher margins than vanilla mortgage lending. The composition of growth matters as much as the rate of growth itself.
A portfolio mix shift toward higher-margin lending has driven NIM improvement across more than just the larger regional banks; BNK Banking’s 1H26 result showed a 49 basis point NIM lift to 1.88% as commercial lending and senior secured assets grew from 15% to 43% of total portfolio in twelve months, providing a comparable data point for the returns available from deliberate mix management.
BEN’s productivity programme rests on two strategic outsourcing partnerships. Genpact has been engaged on a 6-year contract focused on process optimisation. Infosys has been confirmed in a long-term strategic arrangement centred on technology and AI capability.
The Infosys and Genpact partnerships were formalised through a seven-year arrangement with Infosys and a six-year arrangement with Genpact, with BEN confirming at announcement that the majority of the $85-95 million transition cost would fall in FY27 before the payback period begins.
The financial arithmetic is straightforward, and both sides of the ledger deserve equal attention.
| Item | Amount | Timing |
|---|---|---|
| Annual net savings target | $65-75m (net of partnership expenses) | By FY28 |
| Upfront transition costs | $85-95m | Predominantly FY27 |
| Cost growth guidance | At or below CPI | Through the economic cycle |
Management target: Business-as-usual cost growth at or below inflation through the economic cycle.
The Q3 operating expense decline of 4.1% already reflects staff reductions linked to the programme’s early stages. The savings are real and visible in the quarterly result. The transition costs, however, have not yet arrived in full. With $85-95 million in upfront costs set to be predominantly recognised in FY27, reported earnings will absorb a material one-off drag even as operational savings begin to accumulate underneath.
The payback period is roughly 14-18 months from peak cost recognition to full annual run-rate savings, assuming the FY28 target holds. Whether the timeline holds, and whether the net savings figure lands at the upper or lower end of the range, will shape BEN’s medium-term earnings trajectory more than any single quarterly NIM movement.
The Q3 result opens more questions than it closes. Four variables deserve specific monitoring:
ASX bank sector valuations have diverged sharply from analyst consensus in 2026, with the Big Four collectively gaining 8.87% year to date while unanimous or near-unanimous sell ratings on several names imply the sector’s price momentum is running well ahead of the fundamental re-rating brokers are prepared to endorse.
12-month context: BEN shares have gained approximately 6% over the past year, compared with a gain of approximately 21% for the S&P/ASX 200 over the same period.
As of 29 April 2026, BEN shares traded at approximately $10.62, giving the bank a market capitalisation of approximately $6.0 billion. The post-results surge of 6-9% on 9 April has largely retraced, suggesting the market absorbed the beat but has not yet re-rated the stock on a sustained basis.
Three genuine positives emerged from Q3: a 7.6% earnings lift against the 1H26 average, a 6 basis point NIM expansion, and a lending mix increasingly weighted toward higher-margin business and agricultural credit growing at 12.7% annualised.
Two structural uncertainties qualify that positive read. Management itself flagged funding cost headwinds that could constrain further NIM gains. And the productivity programme, while already delivering visible cost reductions, carries $85-95 million in transition costs predominantly landing in FY27, a period that will test whether the savings timeline holds.
A strong quarterly result is the beginning of an analytical conversation, not the conclusion of one. Investors tracking the BEN thesis can access the full unaudited quarterly trading update and forthcoming full-year results through Bendigo and Adelaide Bank’s investor relations page for the most current disclosure.
The valuation gap between BEN’s share price performance and a sustained analyst re-rating sits within a broader issue of concentration risk in Australian bank stocks, where Morningstar has flagged the Big Four as overvalued at current multiples and the ASX 200’s year-to-date gain is almost entirely dependent on bank sector performance holding up.
This article is for informational purposes only and should not be considered financial advice. Investors should conduct their own research and consult with financial professionals before making investment decisions. Past performance does not guarantee future results. Financial projections are subject to market conditions and various risk factors.
Bendigo and Adelaide Bank reported Q3 FY26 cash earnings of $137.9 million, up 7.6% versus the 1H26 quarterly average, supported by a 6 basis point NIM expansion to 1.98% and a 4.1% quarter-on-quarter reduction in operating expenses.
Net interest margin (NIM) is the spread between what a bank earns on loans and what it pays on deposits, expressed as a percentage of interest-earning assets; for Bendigo Bank, a 6 basis point rise to 1.98% in Q3 FY26 directly improved core profitability, though management flagged wholesale funding costs as a potential headwind going forward.
Bendigo Bank's outsourcing partnerships with Infosys and Genpact are expected to deliver $65-75 million in annual net savings by FY28, but the programme carries $85-95 million in upfront transition costs that will predominantly be recognised in FY27, creating a near-term drag on reported earnings.
Business and agricultural lending grew at 12.7% annualised in Q3 FY26, three times the residential lending rate of 4.2%, and this segment typically carries higher margins than mortgage lending, meaning the mix shift supports both NIM expansion and long-term earnings quality.
Key variables to monitor include the RBA's May 2026 rate decision and its net impact on BEN's NIM, whether the NIM holds above 1.98% as wholesale funding reprices, the timing and magnitude of FY27 transition cost recognition, and any broker price target revisions that have not yet been published following the April 2026 quarterly update.