
BlackRock Raises AI and Tech Decoupling to Top Risk Tier
21 hrs ago
Westpac hit an all-time high of $43.32 on 25 February 2026, then shed roughly 10% in two months. Yet analysts still describe sentiment toward the stock as neutral rather than bearish. That gap between peak euphoria and present reality is where the analytical value sits.
The 14 April trading update from Westpac contained an unusual combination: a $75 million one-off charge, stable core metrics, stronger provisioning, and a treasury division that actually benefited from global instability. Understanding how those pieces fit together matters for anyone holding or assessing ASX bank exposure in the current environment.
What follows is an evidence-based breakdown of what is driving Westpac’s price behaviour in 2026, what the provisioning shift signals about bank-level risk management, and how the broader big-four sector is positioned ahead of a likely RBA rate move in May.
The price arc tells a two-phase story.
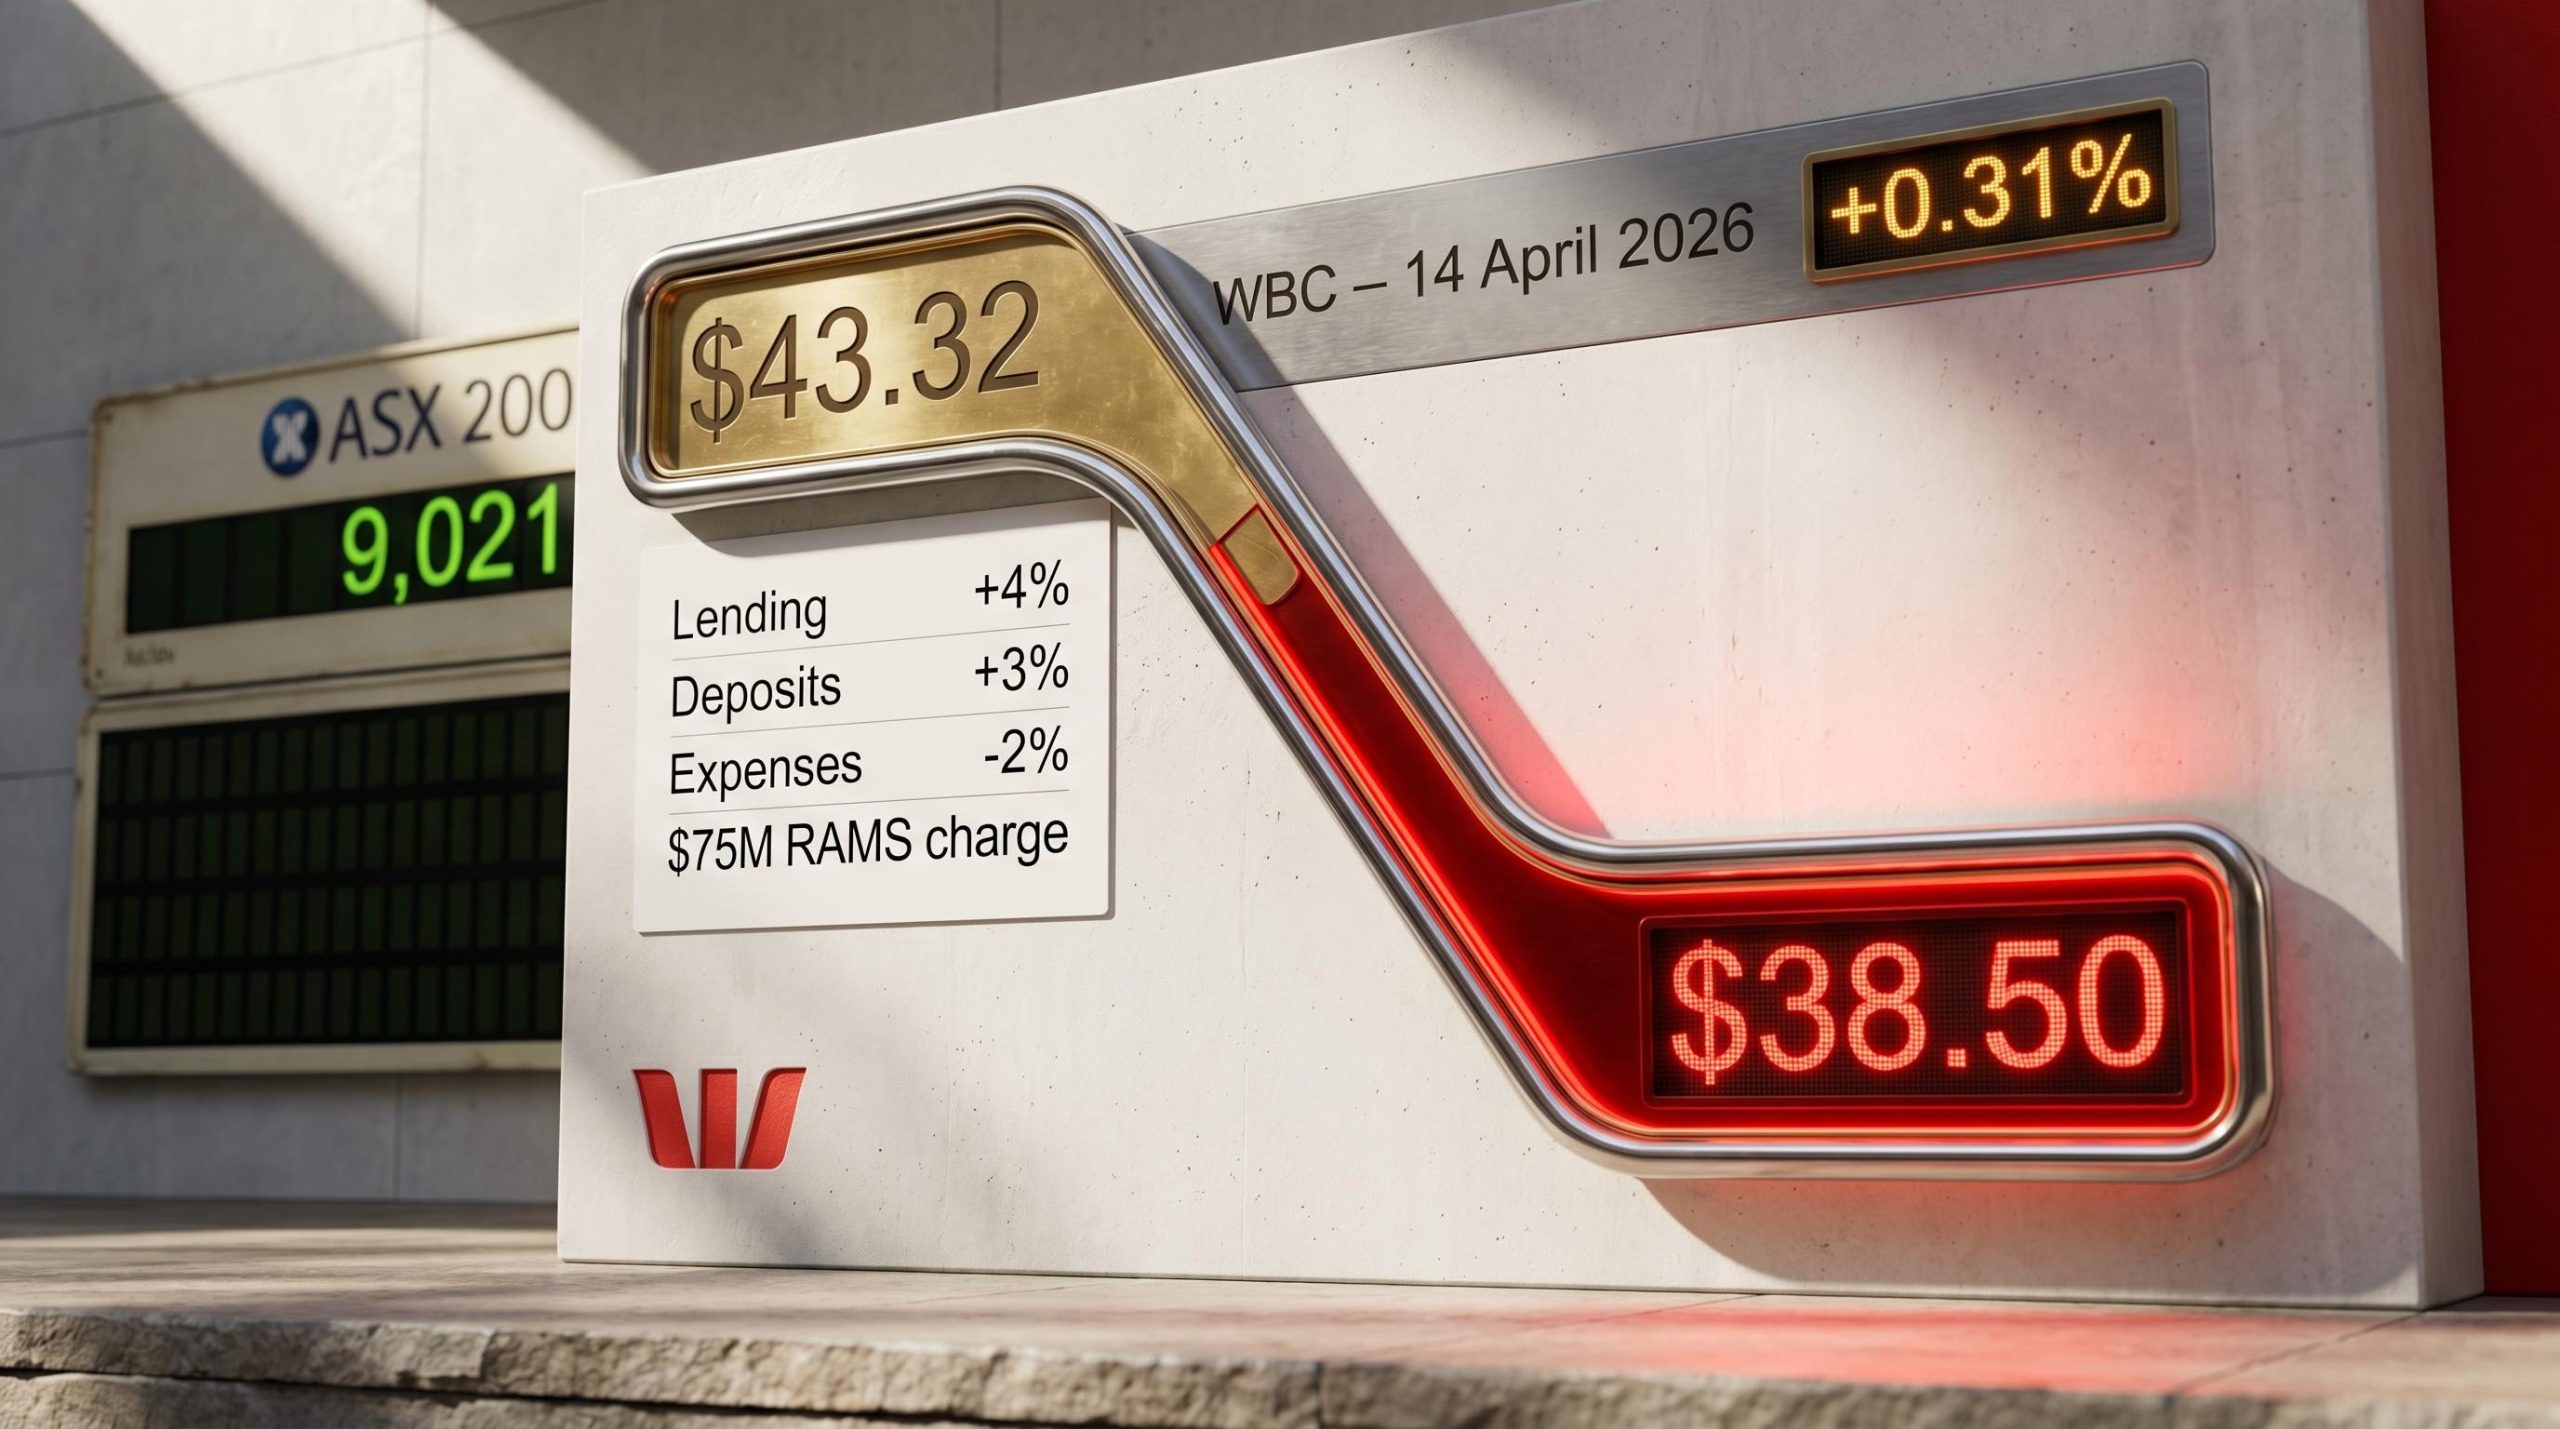
All-time high: $43.32 AUD, 25 February 2026
Phase one was the run to the record. Westpac climbed steadily through January and February, reaching $43.32 on 25 February. By 14 April, the stock sat at $42.72, still carrying approximately 10% in year-to-date gains. Phase two was the unwind. By 30 April, the share price had fallen to $38.50, erasing almost all of those gains and leaving 2026 performance roughly flat.
Three price reference points frame the trajectory:
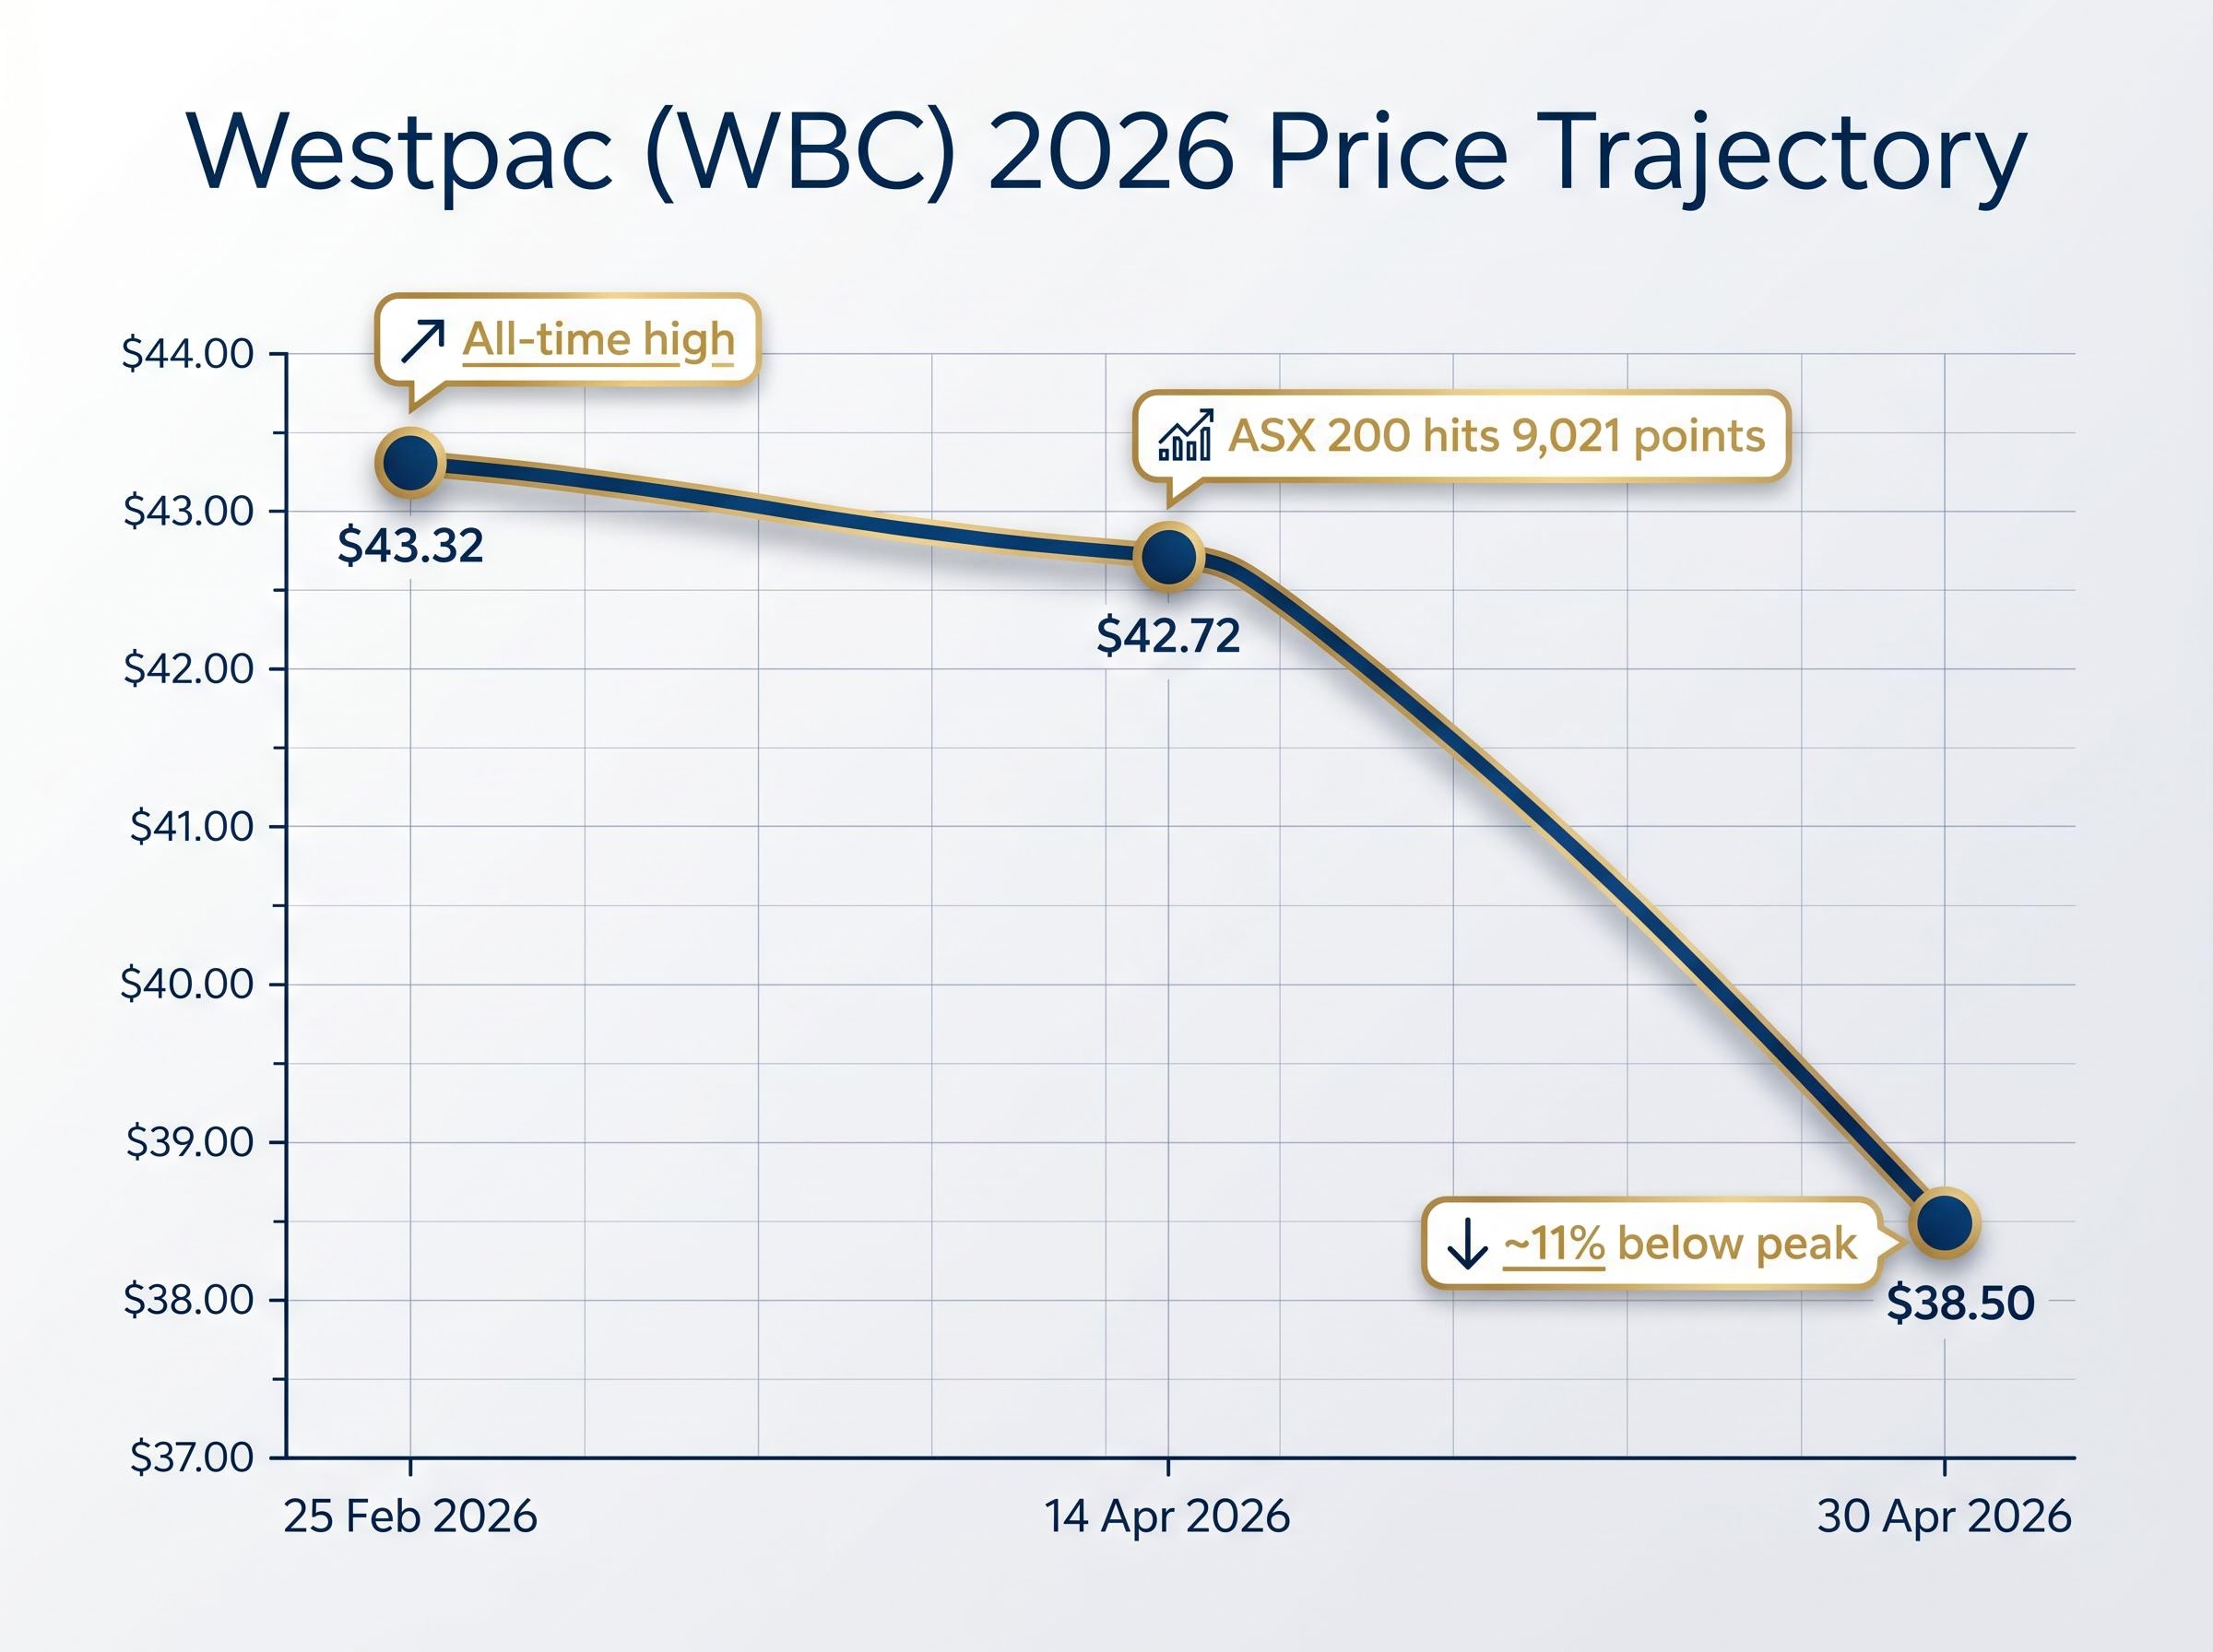
On 14 April, the ASX 200 gained 1.1% to reach 9,021 points. Westpac rose just 0.31% that session. Broad market strength did not translate into proportional outperformance, and the subsequent two weeks saw the stock fall considerably further. The question for investors is not whether the pullback happened, but what is driving it.
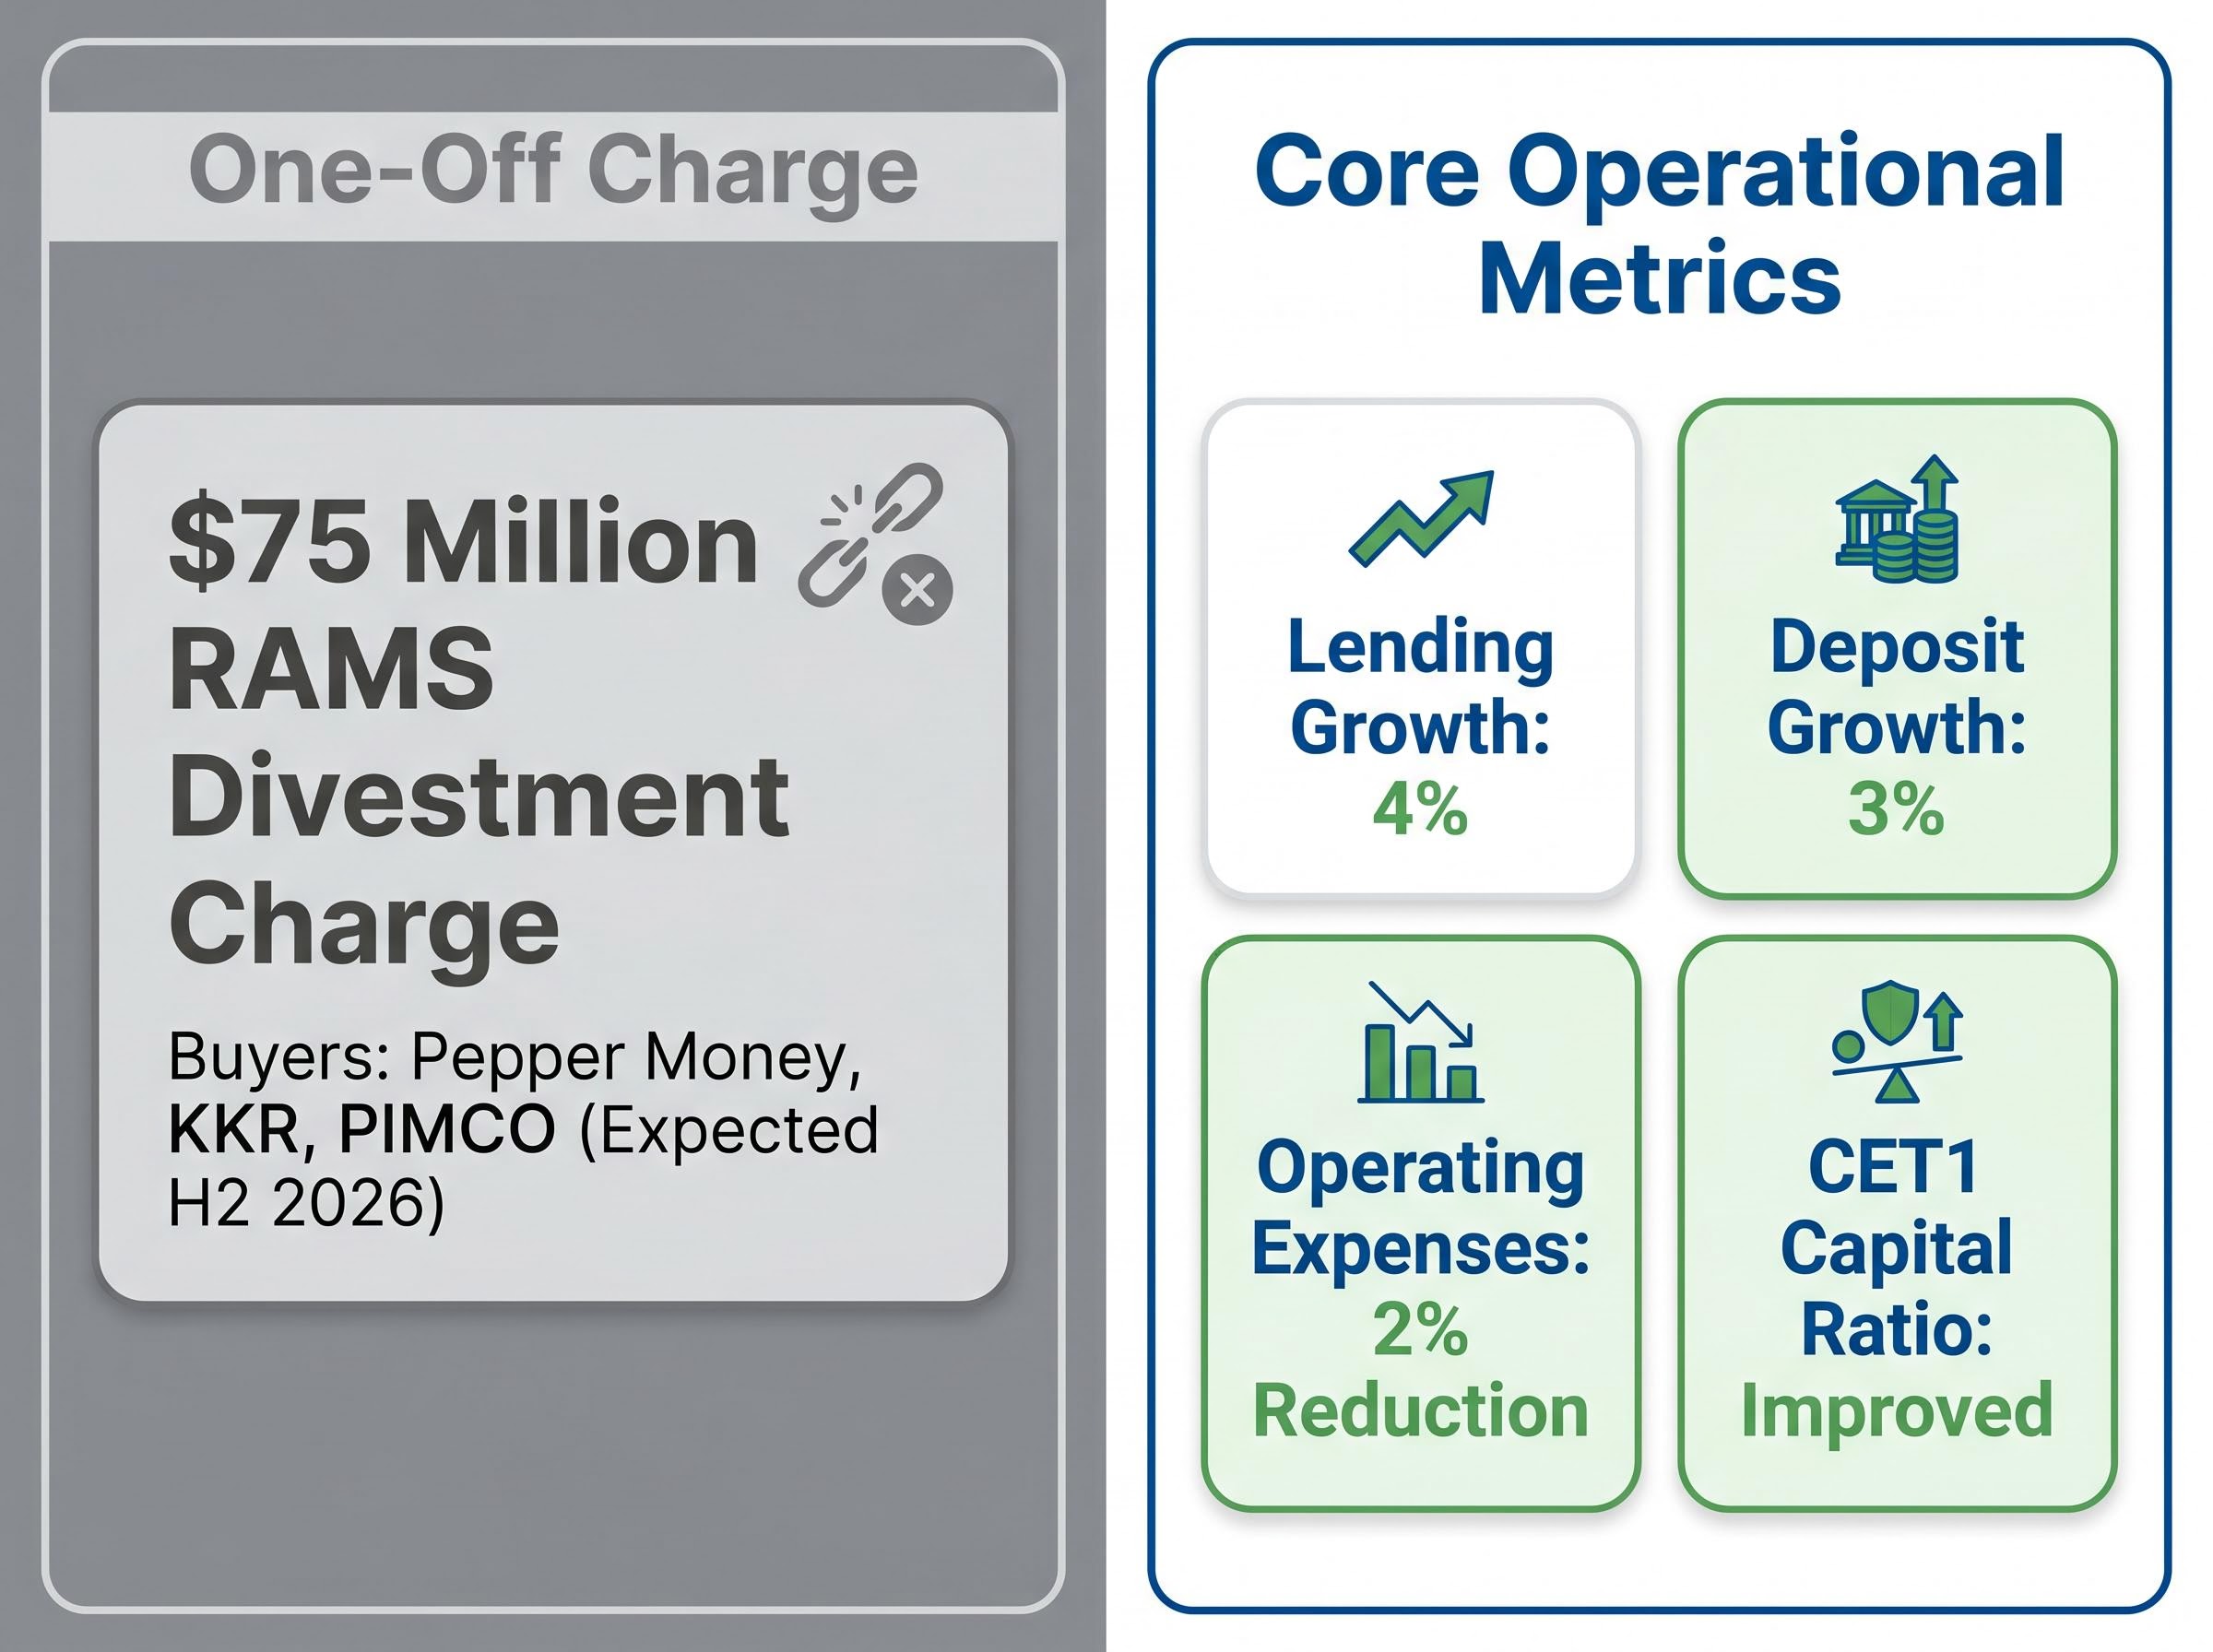
Start with the headline number that spooked some investors. Westpac disclosed a $75 million reduction to reported first-half FY26 net profit after tax, relating to transaction costs from the sale of its RAMS mortgage portfolio. The buyers are Pepper Money (ASX: PPM), KKR, and PIMCO, with completion expected in the second half of 2026.
This is a one-off charge, not a recurring drag on earnings. Treating it as a signal of operational weakness would misread the update entirely.
Westpac’s original ASX announcement on the RAMS portfolio sale confirmed that transaction costs would reduce reported first-half FY26 net profit after tax by $75 million, while simultaneously disclosing a new provision overlay targeting energy-intensive sectors, two separate risk management signals packaged inside a single trading update.
Beneath the RAMS charge, four operational metrics tell a more durable story about the business.
| Metric | Result | Directional Signal |
|---|---|---|
| Lending growth | 4% | Expanding loan book, market share retention |
| Deposit growth | 3% | Stable funding base at lower cost than wholesale |
| Operating expenses | 2% reduction | Cost discipline supporting margins |
| CET1 capital ratio | Improved (no specific figure) | Stronger balance sheet buffer |
Net interest margin remained stable once rate timing effects are excluded, a particularly meaningful detail given the current RBA environment. The CET1 capital ratio improvement, while disclosed directionally rather than numerically, indicates balance sheet resilience is strengthening rather than deteriorating.
Most retail investors associate geopolitical risk with falling bank stocks. That assumption misses a specific revenue mechanism that worked in Westpac’s favour during the first half.
The process operates in three steps:
This is not theoretical. Westpac’s management explicitly disclosed that elevated market volatility supported treasury and markets net interest margin during the first half of FY26.
Westpac’s 14 April ASX announcement noted that elevated volatility contributed positively to treasury and markets net interest margin over the period.
A separate tailwind came from New Zealand dollar depreciation, which improved reported results through foreign currency translation effects. This is a mechanical accounting benefit rather than an operational improvement, and should not be overstated.
The backdrop remains the RBA cash rate at 4.10% as of March 2026, with approximately 75% market-implied probability of a rise to 4.35% in May.
Collective provisions to credit risk-weighted assets: 1.29% in first-half FY26
This ratio measures how much capital a bank has set aside against potential loan losses relative to the risk weighting of its credit exposures. A higher number means a larger buffer. Westpac’s 1.29% represents a deliberate increase, and the context matters more than the direction.
The provisioning build reflects the macroeconomic conditions banks are preparing for:
These conditions, sticky inflation paired with sluggish growth, create the type of environment where loan defaults could rise even without a formal recession. Westpac’s provisioning increase is a precautionary measure against that possibility, not evidence that credit quality has already deteriorated.
Collective provision overlays targeting specific sectors, rather than the loan book as a whole, are becoming a standard risk management tool across Australian banking; Judo Bank added targeted overlays across agriculture, construction, retail trade, manufacturing, and transport in the same April 2026 reporting window that Westpac disclosed its energy-sector provision build, signalling a coordinated shift in how lenders are modelling concentrated credit exposures.
The tension is real, though. Higher provisioning reduces near-term reported earnings. Investors focused on short-term profit growth may view the increase negatively, while those focused on long-term balance sheet resilience may interpret the same data as prudent. The distinction between precautionary buffering and emerging credit losses is one of the most important analytical judgments in bank stock assessment.
Westpac’s pullback did not occur in isolation. The big-four sector broadly underperformed during mid-April, and analyst sentiment across the group is notably cautious.
ASX 200 bank concentration means that investors holding broad index funds or default superannuation options are effectively running an undisclosed sector bet; a coordinated de-rating across all four major banks would remove the primary structural support holding the index’s 2026 year-to-date gain in positive territory.
| Bank | Approximate Price (Late April 2026) | Key Analyst Data Point |
|---|---|---|
| Westpac (WBC) | $38.50 | Neutral consensus; target range $29.32-$40.00 |
| ANZ | ~$35.94 (27 April) | Among three big-four banks rated sell |
| NAB | Not disclosed | Potential downside target ~$30.00 |
| CBA | Not disclosed | Rated sell; limited late-April data available |
Three of the four big-four banks carried sell ratings as of mid-to-late April 2026. Westpac’s neutral consensus is the exception, though the risk/reward profile is compressed. The maximum analyst target of $40.00 represents just 3.9% upside from the $38.50 close, while the minimum target of $29.32 implies potential downside of approximately 24% under adverse conditions.
That asymmetry, limited upside against material downside, is the sector story condensed into a single data point. Position sizing should account for it.
A May RBA rate rise to 4.35% (currently priced at 75% probability) would create a dual effect. On one side, higher rates extend net interest margin support, the spread between what banks charge borrowers and pay depositors widens. On the other, Westpac’s mortgage-heavy loan book faces increased repayment stress among variable-rate borrowers already absorbing 4% inflation and 1% GDP growth.
The RBA’s February 2026 Statement on Monetary Policy projected underlying inflation peaking at 3.7 per cent in mid-2026 and remaining above the 2-3 per cent target band until early 2027, establishing the inflationary baseline that feeds directly into Westpac’s provisioning assumptions and mortgage book stress assessment.
This is a self-limiting dynamic. The same rate rise that supports bank margins can generate the credit stress that forces higher provisioning, partially offsetting the margin benefit.
Treasury and markets income benefited from volatility in the first half, but this revenue stream cannot be modelled as a steady-state contribution. It is episodic by nature, dependent on conditions that may persist, intensify, or normalise without warning. If global volatility eases, this tailwind reverses to neutral.
The two-sided register for the remainder of 2026:
The gap between the $43.32 February high and the $38.50 April close reflects the market’s ongoing attempt to resolve this tension. The neutral analyst consensus appropriately captures an environment where confident directional calls are difficult to sustain.
The underlying business metrics are solid. Lending grew 4%, deposits grew 3%, expenses fell 2%, and the capital ratio improved. The $75 million RAMS charge is a one-off. Treasury income is benefiting from volatility. Yet the stock sits 11% below its all-time high, and the most optimistic analyst target of $40.00 offers limited upside.
The neutral consensus is not a lazy middle ground. It reflects genuine uncertainty: the provisioning build, the rate environment, and the episodic nature of treasury gains all resist confident directional calls. Whether the conditions that drove Westpac to $43.32 in February return, plateau, or reverse is ultimately a macro call.
Westpac’s half-year results, scheduled for 5 May 2026, represent the next hard data point that will either validate the neutral consensus or force a directional reassessment, with net interest margin trajectory, credit quality disclosures, and the interim dividend declaration all carrying potential to move the stock materially in either direction.
Investors should ensure their position reflects their own view on that outcome.
This article is for informational purposes only and should not be considered financial advice. Investors should conduct their own research and consult with financial professionals before making investment decisions. Past performance does not guarantee future results. Financial projections are subject to market conditions and various risk factors.
Westpac hit an all-time high of $43.32 on 25 February 2026 and subsequently declined roughly 11% to $38.50 by late April, driven by a $75 million one-off RAMS divestment charge, rising provisioning ratios, and broader big-four sector underperformance amid a cautious macro environment.
The RAMS mortgage portfolio sale to Pepper Money, KKR, and PIMCO reduces Westpac's reported first-half FY26 net profit after tax by $75 million in transaction costs, but this is a one-off charge rather than a recurring drag on the underlying business.
Analyst consensus on Westpac is neutral as of late April 2026, with price targets ranging from $29.32 to $40.00, meaning the maximum upside from the $38.50 close is approximately 3.9% while the downside under adverse conditions could reach around 24%.
A rate rise to 4.35% (priced at 75% probability for May 2026) would widen net interest margins, benefiting bank earnings, but would also increase repayment stress on variable-rate mortgage borrowers, potentially driving higher loan losses and provisioning costs that partially offset the margin benefit.
Westpac raised its collective provisions to credit risk-weighted assets ratio to 1.29% as a precautionary buffer against a challenging macro backdrop, including projected CPI of approximately 4%, GDP growth of only around 1%, and an anticipated RBA rate rise, conditions that could increase loan defaults even without a formal recession.