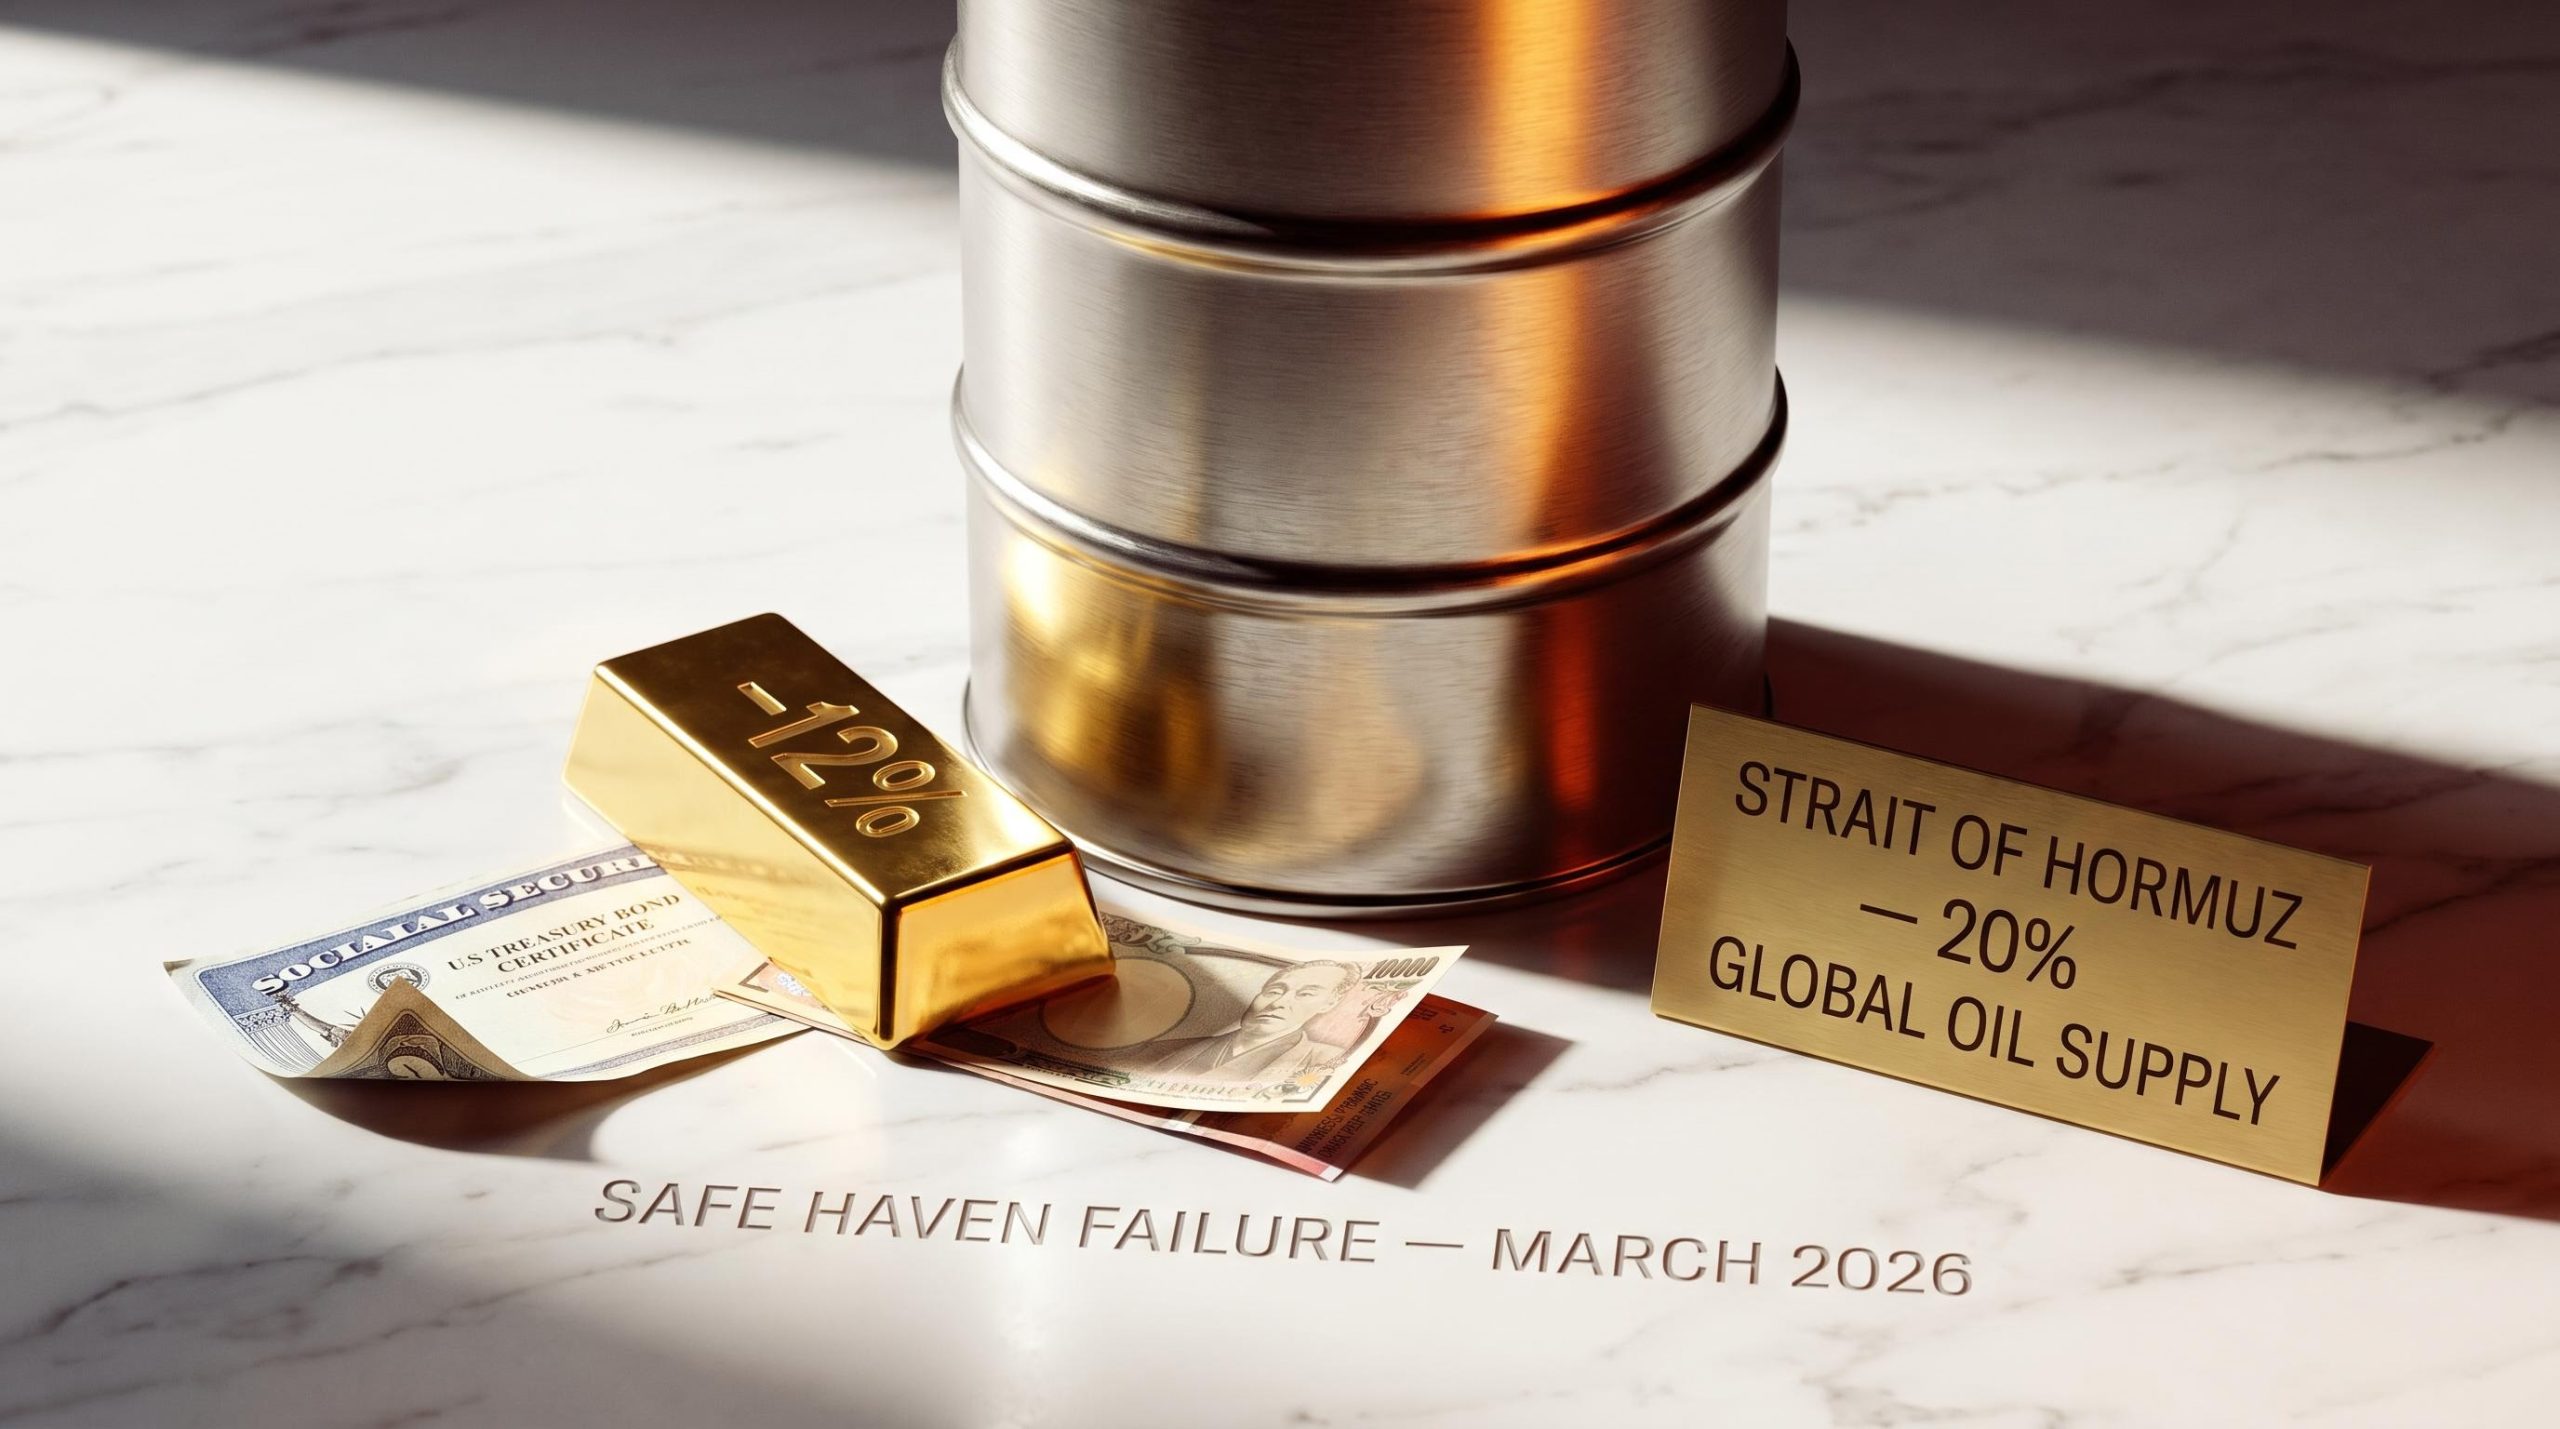
Four of the most trusted defensive assets in modern portfolio construction, gold, US Treasuries, the Japanese yen, and the Swiss franc, all fell simultaneously when the Iran War escalated in early 2026. For Australian investors holding what they believed were well-hedged portfolios, the result was losses across the board at precisely the moment protection was most needed. The Iran War has produced what analysts describe as the largest oil supply shock in recorded history, with the Strait of Hormuz effectively closed to commercial shipping. This is not a demand-collapse crisis. It is a supply shock, and that distinction changes everything about how safe haven assets behave. What follows is an analysis of the specific macro mechanism causing traditional defensive positions to fail, which assets have actually functioned as expected, and what the implications are for Australian investors reassessing their positioning right now.
The supply-shock problem that broke the rulebook
The defensive playbooks that have guided portfolio construction for the past four decades were built on demand-collapse events. In a recession, a banking crisis, or a pandemic-driven shutdown, central banks cut rates, government bonds rally, and the negative correlation between equities and fixed income delivers the hedge that balanced portfolios depend on.
Supply shocks invert that dynamic. When the source of the crisis is a physical constraint on energy or goods rather than a collapse in spending, inflation stays elevated or rises even as growth deteriorates. Central banks face an impossible choice: cut rates to support growth and risk unanchoring inflation, or hold rates and watch the economy slow without offering relief.
Three conditions define this supply-shock macro regime:
- Sticky or rising inflation driven by physical scarcity rather than excess demand
- Rate-hold or rate-hike pressure from central banks unable to ease without fuelling further price increases
- Growth deterioration as higher input costs compress margins and reduce consumer spending power
The Strait of Hormuz normally carries approximately 20% of worldwide oil and liquefied natural gas (LNG) supply. By March 2026, traffic had fallen to approximately 154 vessel transits, a fraction of normal capacity. The resulting energy shock is directly comparable to 2022, when pandemic supply chain disruptions combined with the Ukraine War energy shock caused bonds to lose their protective role at the same time equities sold off. The 1970s stagflation parallel is even more instructive: weak growth, elevated inflation, and high borrowing costs all occurring simultaneously.
The House of Commons Library Hormuz briefing, published in April 2026, corroborates that the closure reduced vessel transits to approximately 5% of pre-conflict levels by March 2026, placing the supply disruption among the most severe recorded for a single maritime chokepoint.
How supply shocks kill the 60/40 hedge
In a demand-collapse crisis, bonds rally because central banks cut rates and investors flee to safety. This offsets equity losses in a 60/40 portfolio, the negative correlation that makes the hedge work.
In a supply-shock crisis, bonds sell off alongside equities because inflation expectations prevent rate cuts. The negative correlation that underpins the entire 60/40 framework disappears. Analysis from Allianz Trade, replicating the Cheema et al. (2025) framework, identifies inflation as the specific fault line where this correlation breakdown occurs. When inflation is the dominant macro regime, bonds and equities fall together.
Every individual safe haven failure that follows is a symptom of this single mechanism.
The mechanism is not new to this conflict: inflation’s effect on safe haven assets has been documented across multiple prior cycles, and the consistent finding is that conventional defensive instruments are designed to hedge financial risk rather than the physical commodity scarcity that drives stagflationary episodes.
When big ASX news breaks, our subscribers know first
Gold’s 12% crash and why crowded trades unwind badly
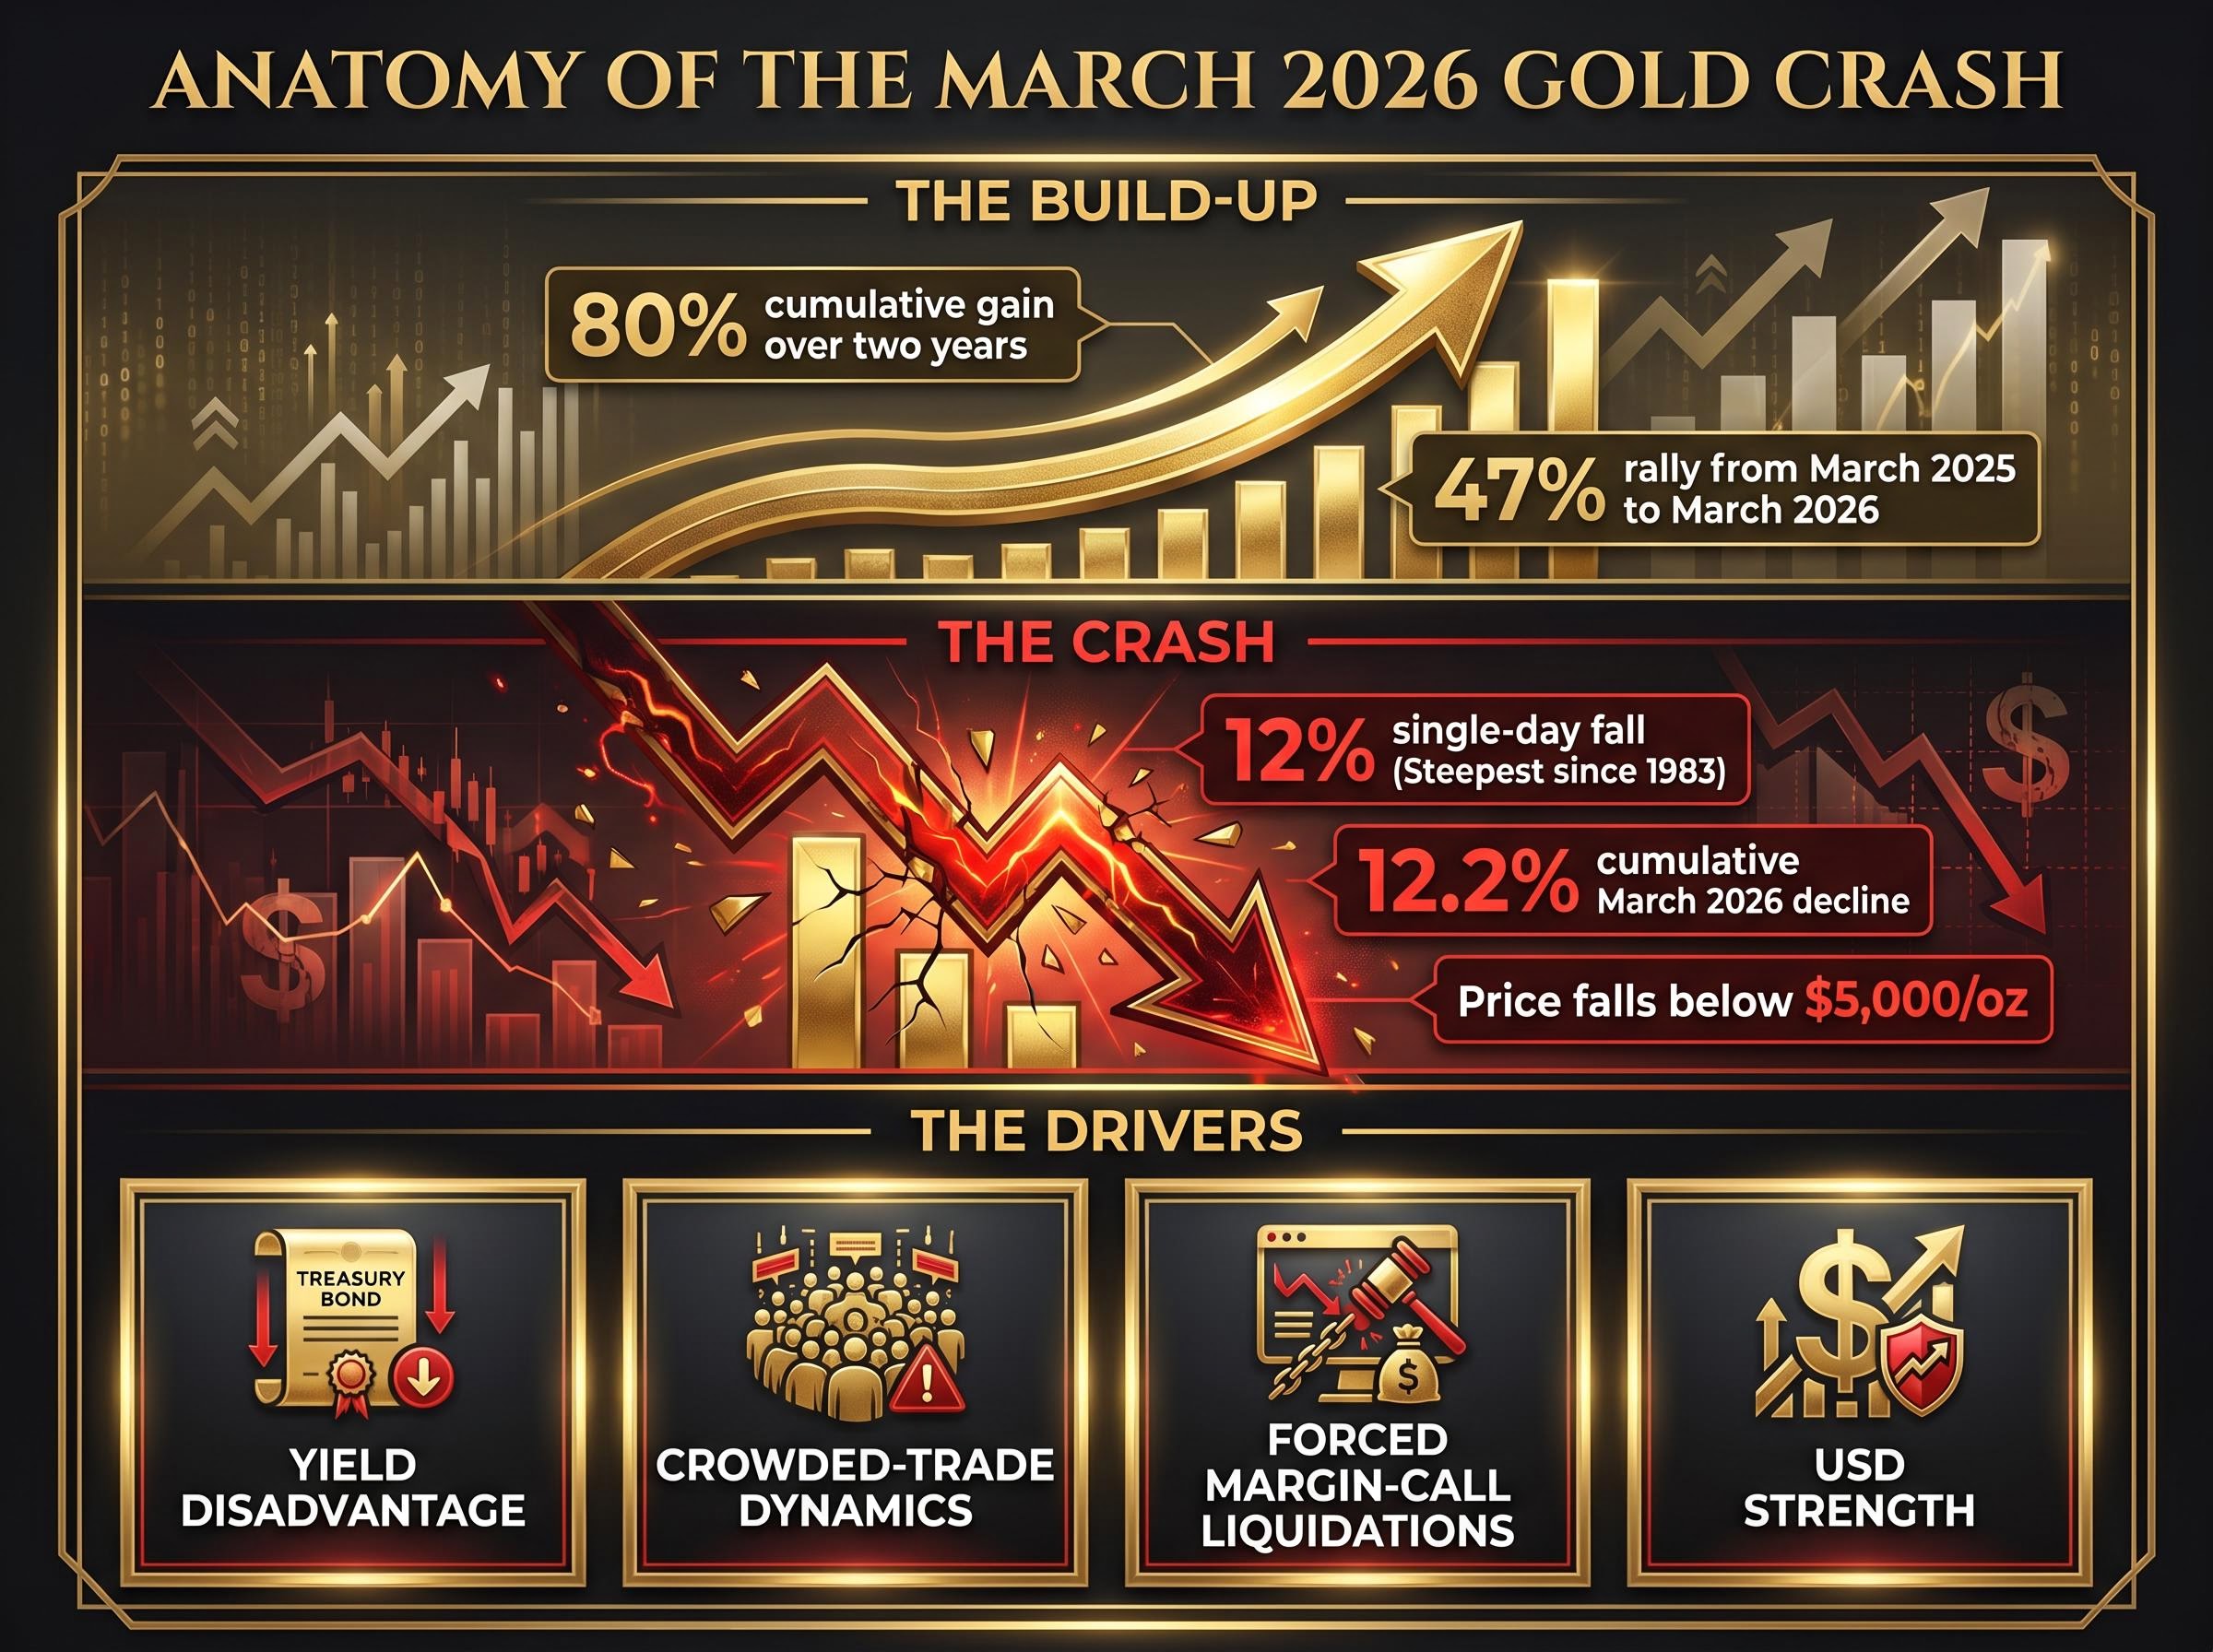
Gold had rallied approximately 47% from March 2025 to March 2026, making it one of the most crowded trades in global markets. Over the two years prior to the crash, the cumulative gain was approximately 80%, according to Selfwealth analysis. That positioning set the stage for what came next.
Gold fell approximately 12% in a single day in March 2026, its steepest daily decline since 1983.
The cumulative decline over March 2026 reached approximately 12.2%, with gold falling below $5,000 per ounce during Asian trading. Four compounding mechanisms drove the crash:
- Yield disadvantage: Gold generates zero income. When rates stay high, the opportunity cost of holding a non-yielding asset rises, and capital rotates toward instruments that pay coupons.
- Crowded-trade dynamics: The sheer scale of speculative positioning meant that when selling began, it fed on itself as stop-losses and algorithmic triggers amplified downward pressure.
- Forced margin-call liquidations: Leveraged holders were compelled to sell not because their view on gold changed, but because their brokers required it.
- USD strength: A rising dollar increased the effective cost of gold for non-dollar buyers, suppressing international demand at the moment supply of sellers was surging.
WealthMunshi analysis cautioned that the decline reflects forced liquidations rather than a permanent fundamental shift. ANZ maintains that gold’s long-term underpinning remains intact despite the near-term failure. Australian investors who allocated to gold exchange-traded funds (ETFs) as part of the $5.6 billion in net ETF inflows recorded in March 2026 need to understand these mechanics before deciding whether to hold, add, or exit.
Why bonds lost their defensive role at the worst possible moment
Bonds were under pressure from both ends of the yield curve simultaneously, making the failure structural rather than incidental.
At the short end, inflation expectations pushed short-duration Treasury yields higher as markets priced in rate holds or hikes rather than cuts. At the long end, fiscal concerns about sustained government borrowing, should the conflict prolong, drove longer-dated yields higher independently of near-term rate expectations. The result was losses across the entire curve.
| Asset | Expected behaviour in crisis | Actual behaviour in Iran War | Key driver of divergence |
|---|---|---|---|
| Short-duration Treasuries | Modest rally as rate cuts priced in | Fell as yields rose | Inflation expectations preventing rate cuts |
| Long-duration Treasuries | Strong rally as flight-to-safety demand surges | Fell as yields rose | Fiscal deficit concerns from prolonged conflict |
US Treasury ETFs and the Bloomberg Multiverse global government bond index both fell approximately 2% in March 2026. Both indices remain down approximately 14% over five years, reflecting cumulative damage from prior inflation shocks. Data from LSEG charting shows the breakdown in correlation between the FTSE Global All-World Index and FTSE World Government Bond Index returns, confirming that the hedging relationship has deteriorated materially.
The silver lining: income returns are improving
Coupon payments continue regardless of price volatility and act as a stabilising component of total return. With 10-year US Treasury yields comfortably above 4%, institutional investors have become more constructive on fixed income at these levels. This represents a materially better income entry point than investors had access to through much of the 2010s, improving the forward case for bonds even as price performance has disappointed. For Australian superannuation members and balanced fund investors who hold large fixed income allocations as a structural defensive weight, the income improvement is a partial offset to the hedging failure.
The yen, the franc, and the energy dependency trap
The Japanese yen’s safe haven status rested on Japan’s large trade surpluses, substantial overseas investment assets, and historically low correlation with risk assets. The Swiss franc carried a similar reputation, reinforced by Switzerland’s political neutrality and current account surplus.
Both properties failed the Iran War stress test, and for the same reason: energy dependency. Japan is a significant net oil importer. When the dominant macro shock is a physical constraint on energy supply, the trade position that underpinned the yen’s defensive quality reverses. Instead of benefiting from crisis-driven capital flows, Japan’s import bill surges, weakening the currency precisely when investors expect it to strengthen.
Quantitative analysis confirms the inconsistency. The JPY’s safe haven beta for Chinese equities was -0.09, meaning it did act as a regional hedge for that specific exposure. For developed market equities, however, the beta was +0.17, indicating the yen moved with risk assets rather than against them.
The Swiss franc showed the same inconsistency, undermined by the identical inflation-dominated regime that broke gold and bonds. During the Ukraine War, the CHF strengthened against the euro, a conventional safe haven response. In the Iran War, that pattern did not hold.
| Currency | Energy position | Iran War behaviour | Ukraine War behaviour |
|---|---|---|---|
| JPY | Net energy importer | Failed as broad safe haven | Inconsistent performance |
| CHF | Net energy importer | Failed as safe haven | Strengthened vs EUR |
| AUD | Net energy exporter | +0.35% vs USD over conflict | Mixed performance |
| CAD | Net energy exporter | Relative resilience | Relative resilience |
| USD | Net energy exporter / self-sufficient | Primary safe haven | Primary safe haven |
The pattern is clear. According to Morningstar and Macrobond data from 17 March 2026, currencies of net energy-exporting nations demonstrated greater resilience relative to the USD than those of energy importers. The AUD/USD moved from 0.705615 on 28 February 2026 to 0.708083 on 29 April 2026, a net gain of approximately +0.35% over the conflict period. The property previously labelled “safe haven” was, in energy-shock conditions, actually “energy-neutral or energy-positive.” The Iran War has made that hidden variable visible.
The granular mechanics of forex valuation during the Hormuz crisis, including USD/JPY reaching 160.395, the Bank of Japan’s policy paralysis, and the six-month shipping backlog estimate that sets the timeline for any reversal, provide the quantitative scaffolding behind the currency table outlined above.
Why the US dollar held up when every other major safe haven did not
After the failures of gold, bonds, the yen, and the franc, the DXY strengthened and emerged as the primary functioning safe haven during the Iran War escalation. This is consistent with its behaviour during the Ukraine War. The same energy-dependency framework that explains the yen’s failure explains the dollar’s success.
The US is not materially exposed to the energy supply shock as an importer. In fact, the US has boosted its own energy exports during the conflict, effectively assuming what analysts describe as the “swing producer crown” previously held by OPEC members.
The UAE announced its exit from OPEC amid the war, signalling a material decline in the cartel’s institutional influence. The US, with its domestic production capacity and willingness to export, has stepped into the role of swing producer at a moment when Gulf-based supply is physically constrained by the Hormuz blockade.
Three conditions underpinned USD strength during the escalation:
- Energy self-sufficiency insulating the US economy from the import cost shock that hit Japan, Europe, and most emerging markets
- Safe haven demand displacement as capital exiting gold, bonds, JPY, and CHF flowed into dollar-denominated assets as the remaining liquid refuge
- Rate differential maintenance as the Federal Reserve held rates at restrictive levels, preserving the yield advantage of holding USD
Australian investors with unhedged USD exposure, including through international equity ETFs such as VGS, have inadvertently held the one major safe haven that worked. The benefit was accidental for most. Understanding why it happened allows more deliberate positioning going forward.
Selfwealth analysis notes that the current shock is more narrowly concentrated in energy than the 2022 episode, leaving potential for rapid reversal once a credible path to resolution emerges. Some USD strength may fade if the conflict prolongs and US fiscal or growth concerns re-emerge, and markets may currently be overpricing the extent of future rate increases given that rates are already at restrictive levels.
What Australian investors should actually do now
The Reserve Bank of Australia warned on 25 March 2026 that a prolonged Middle East conflict could hit Australian growth and unmoor inflation expectations, potentially delaying rate cuts. That warning frames the specific Australian policy risk: the same supply-shock mechanism that broke global safe havens is now actively constraining the RBA’s ability to ease.
For Australian investors, stagflation investing in a supply-shock regime requires a fundamentally different toolkit from the growth-recession playbooks that have dominated financial planning since the 1990s, with the RBA’s projected terminal cash rate and rising domestic consumer costs compressing the options available to both policymakers and households.
How the AUD’s energy position changes the calculus for Australian investors
The AUD’s +0.35% net gain against the USD over the conflict period reflects Australia’s energy export status, providing a partial natural hedge for investors with domestic portfolios. This resilience is contingent, however, on the conflict remaining primarily an energy-price shock. A prolonged growth deterioration would erode the advantage as commodity demand expectations fell.
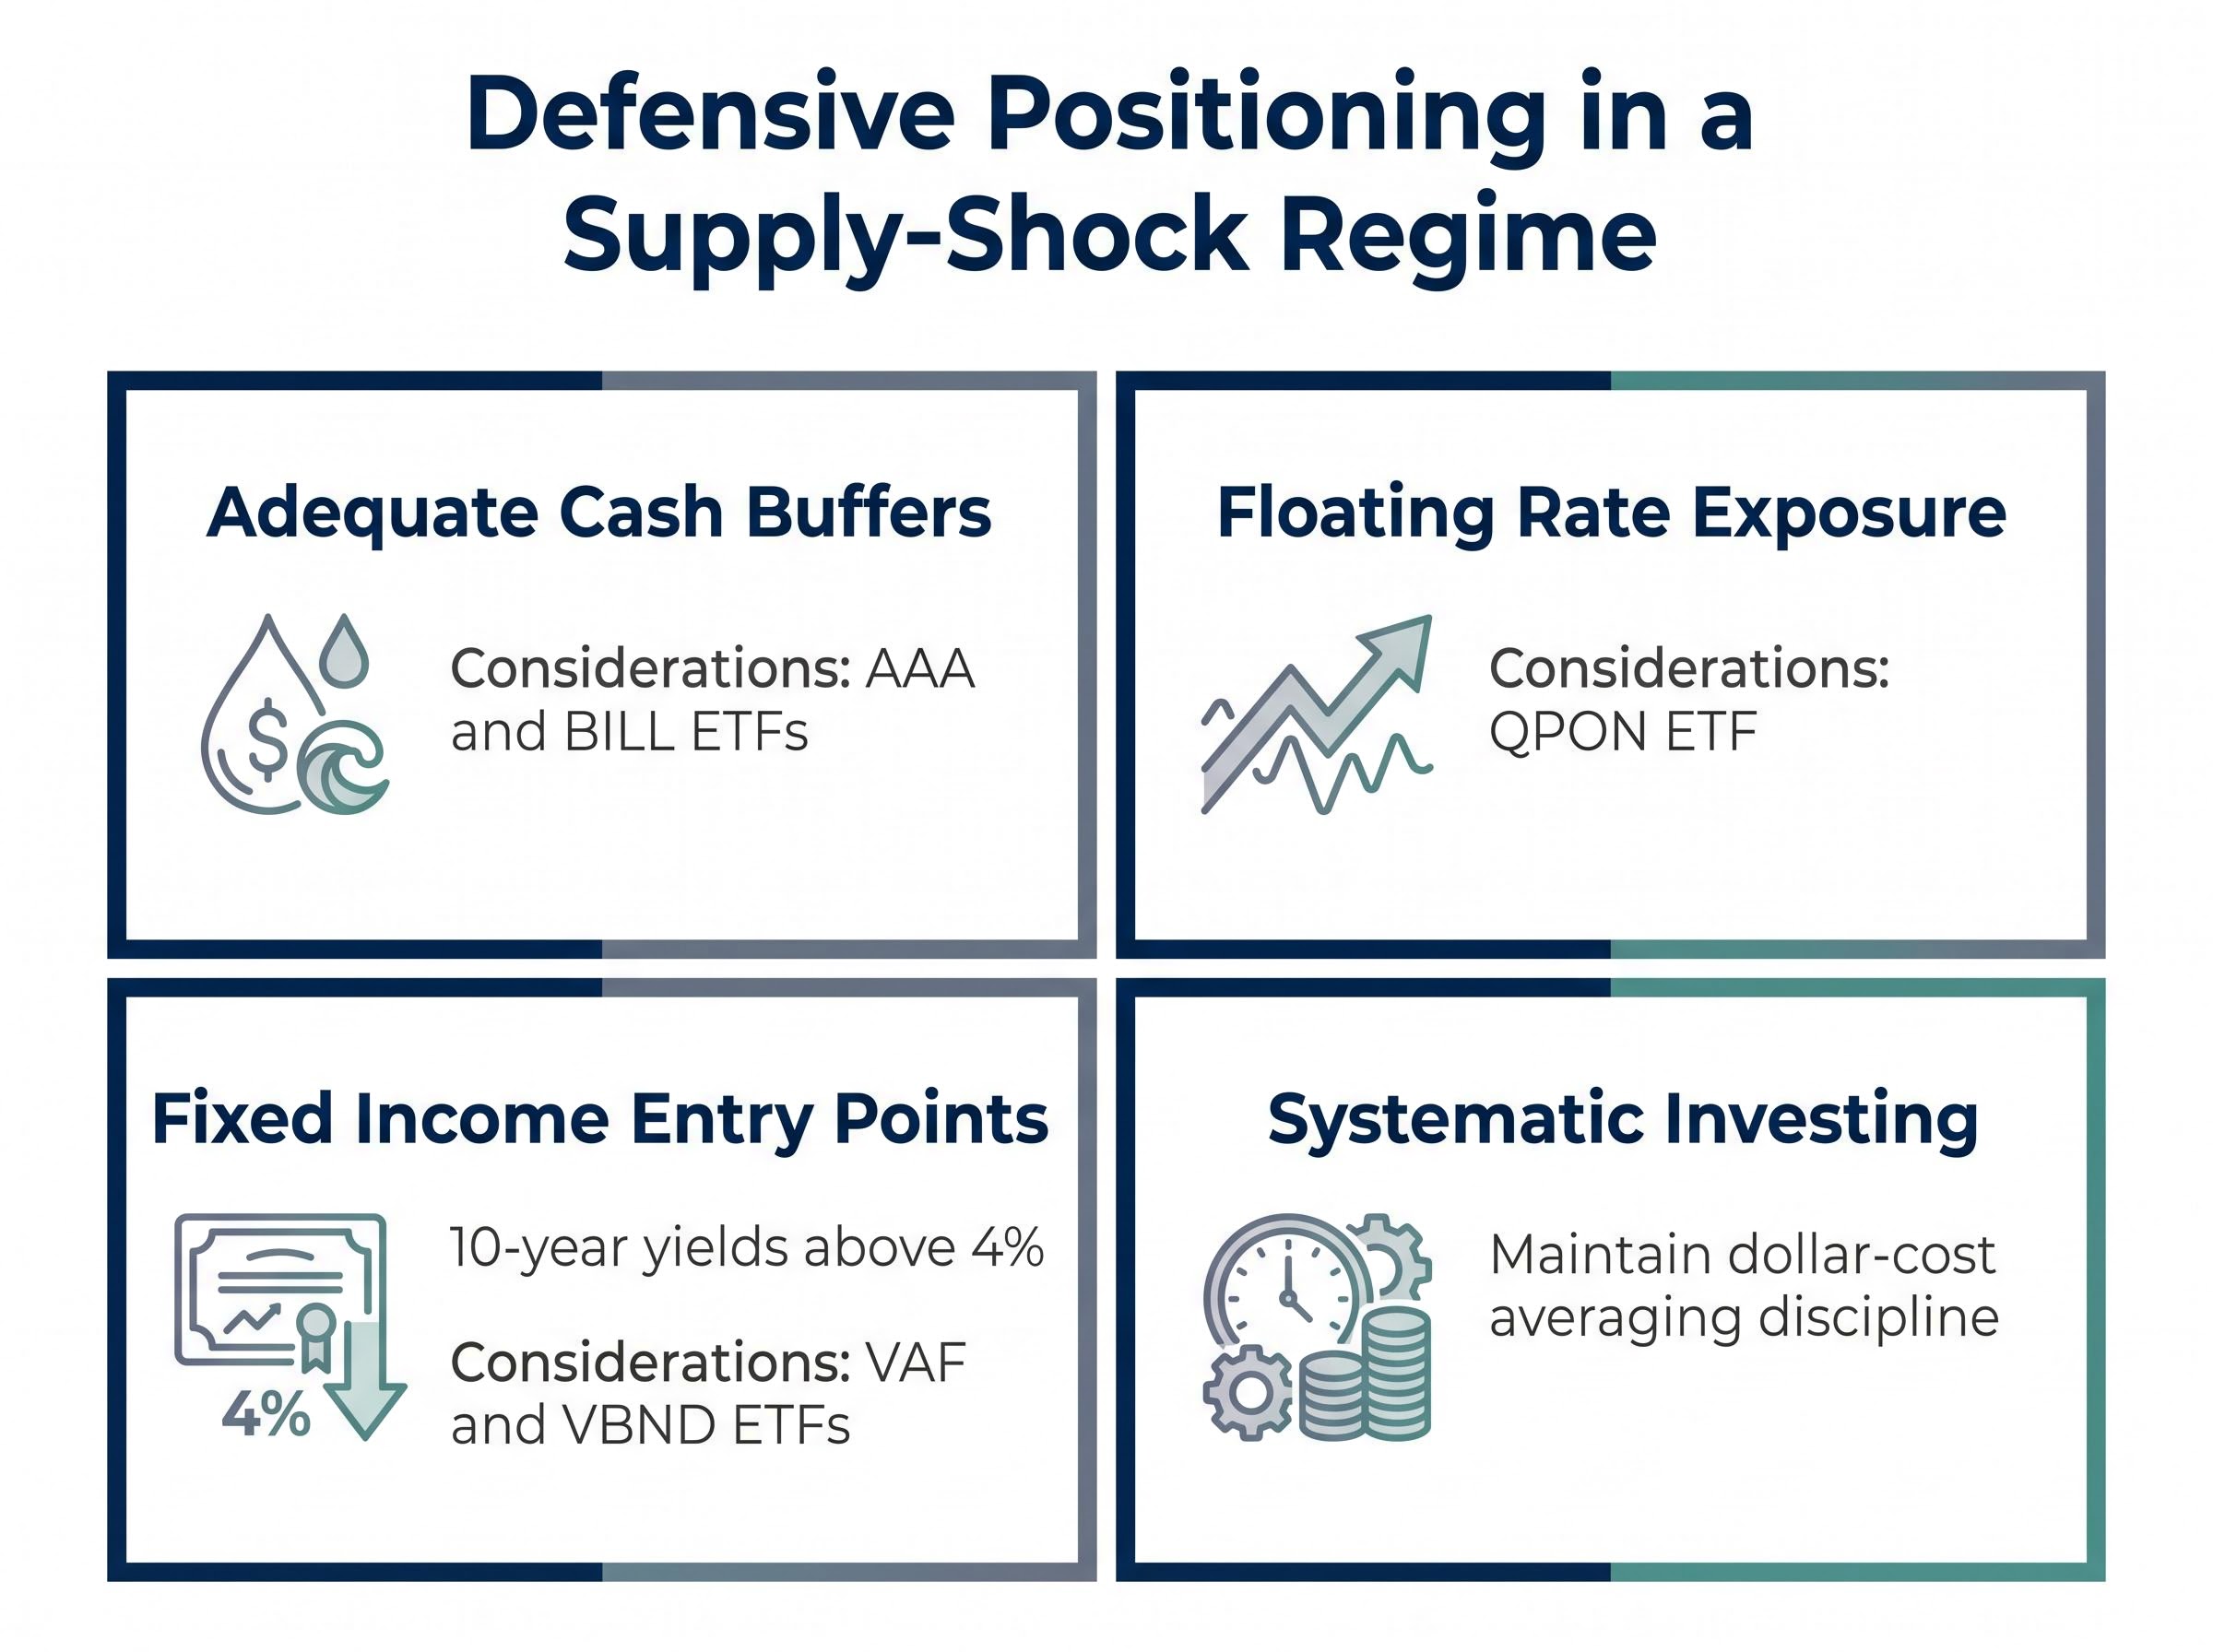
For investors reassessing defensive positioning, four considerations flow directly from the supply-shock framework:
- Adequate cash buffers: High-interest cash instruments (such as AAA and BILL ETFs) provide liquidity and a positive real return while avoiding the duration risk that has damaged bond portfolios. In a supply-shock regime, cash is not dead weight; it is optionality.
- Floating rate bond exposure: Instruments like QPON adjust coupon payments as rates move, providing income that keeps pace with the inflation that is eroding fixed-rate bond returns.
- Fixed income at current yields: With 10-year yields above 4%, the income case for bonds (via instruments such as VAF and VBND) has improved materially. The entry point matters, and current yields are significantly more attractive than those available through much of the prior decade.
- Systematic investing discipline: For investors with long time horizons and adequate risk tolerance, dollar-cost averaging through volatility has historically outperformed attempts to time re-entry after conflict resolution.
Australian investors allocated $5.6 billion in net inflows to ASX-listed ETFs in March 2026, with total ASX ETF assets reaching $329 billion. The broader ASX rallied amid de-escalation hopes, but energy stocks failed to participate, signalling sector-specific headwinds. ANZ observes that if the conflict prolongs, central banks may be forced into dovish pivots to support growth, which could eventually support risk assets post-volatility. WealthMunshi cautions against over-rotating out of gold based solely on the conflict-period drawdown.
Investors wanting to translate the supply-shock framework into a specific allocation structure will find our dedicated guide to inflation portfolio construction for 2026 useful; it walks through a revised 40% equities, 30% bonds, 20% alternatives, and 10% cash framework with specific ASX ETF recommendations for each sleeve, including the floating rate and high-interest cash instruments mentioned above.
This article is for informational purposes only and should not be considered financial advice. Investors should conduct their own research and consult with financial professionals before making investment decisions.
Past performance does not guarantee future results. Financial projections are subject to market conditions and various risk factors.
The playbook has not failed, but it has conditions
The supply-shock macro regime is the single condition that deactivated gold, bonds, the yen, and the franc simultaneously. That condition is specific and identifiable rather than random. The Iran War has made the implicit conditions of safe haven assets explicit: gold requires a rate-cutting environment to function as a crisis hedge; bonds require inflation to be falling or stable; currency safe havens require the issuing nation to be insulated from the specific shock in question.
Ceasefire talks stalled as of 28 April 2026. The ANZ baseline view had characterised direct conflict as likely short-lived; that view has not been borne out, shifting the risk distribution toward extended energy inflation and delayed rate cuts.
Selfwealth analysis observes that markets historically recover from conflicts once a credible path to resolution emerges, even without a complete peace agreement. Rate-sensitive assets could experience sharp recoveries once geopolitical tensions ease, given that interest rates are already at restrictive levels and have limited room to rise further.
The tools still exist. Each one now carries a visible condition attached to it. Australian investors who understand those conditions, and the supply-shock regime that activates them, are better positioned than those who treated defensive assets as unconditional guarantees.