
JPMorgan Flags $165 Billion in Quarter-End Equity Selling Pressure
11 hrs ago
As of late April 2026, the S&P 500 and Nasdaq continue to push toward unprecedented heights. A glaring contradiction sits beneath the surface, as traditional industrial benchmarks quietly languish below their early-year peaks. Financial professionals are dusting off the Dow Theory framework to assess whether this modern equity surge has genuine structural integrity or if it masks underlying fragility. The ongoing market action presents a complex puzzle for portfolio managers attempting to gauge forward momentum. This divergence forces analysts to ask if the broader market rally is built on a solid foundation.
Readers will learn how to apply time-tested technical analysis principles to current market data. By examining the recent fluctuations, investors can understand why a singular stock anomaly might be throwing off reliable historical warning signals. This knowledge provides a critical lens for separating genuine economic expansion from isolated, speculative bursts. Ultimately, parsing these technical nuances helps market participants manage the elevated volatility defining the second quarter.
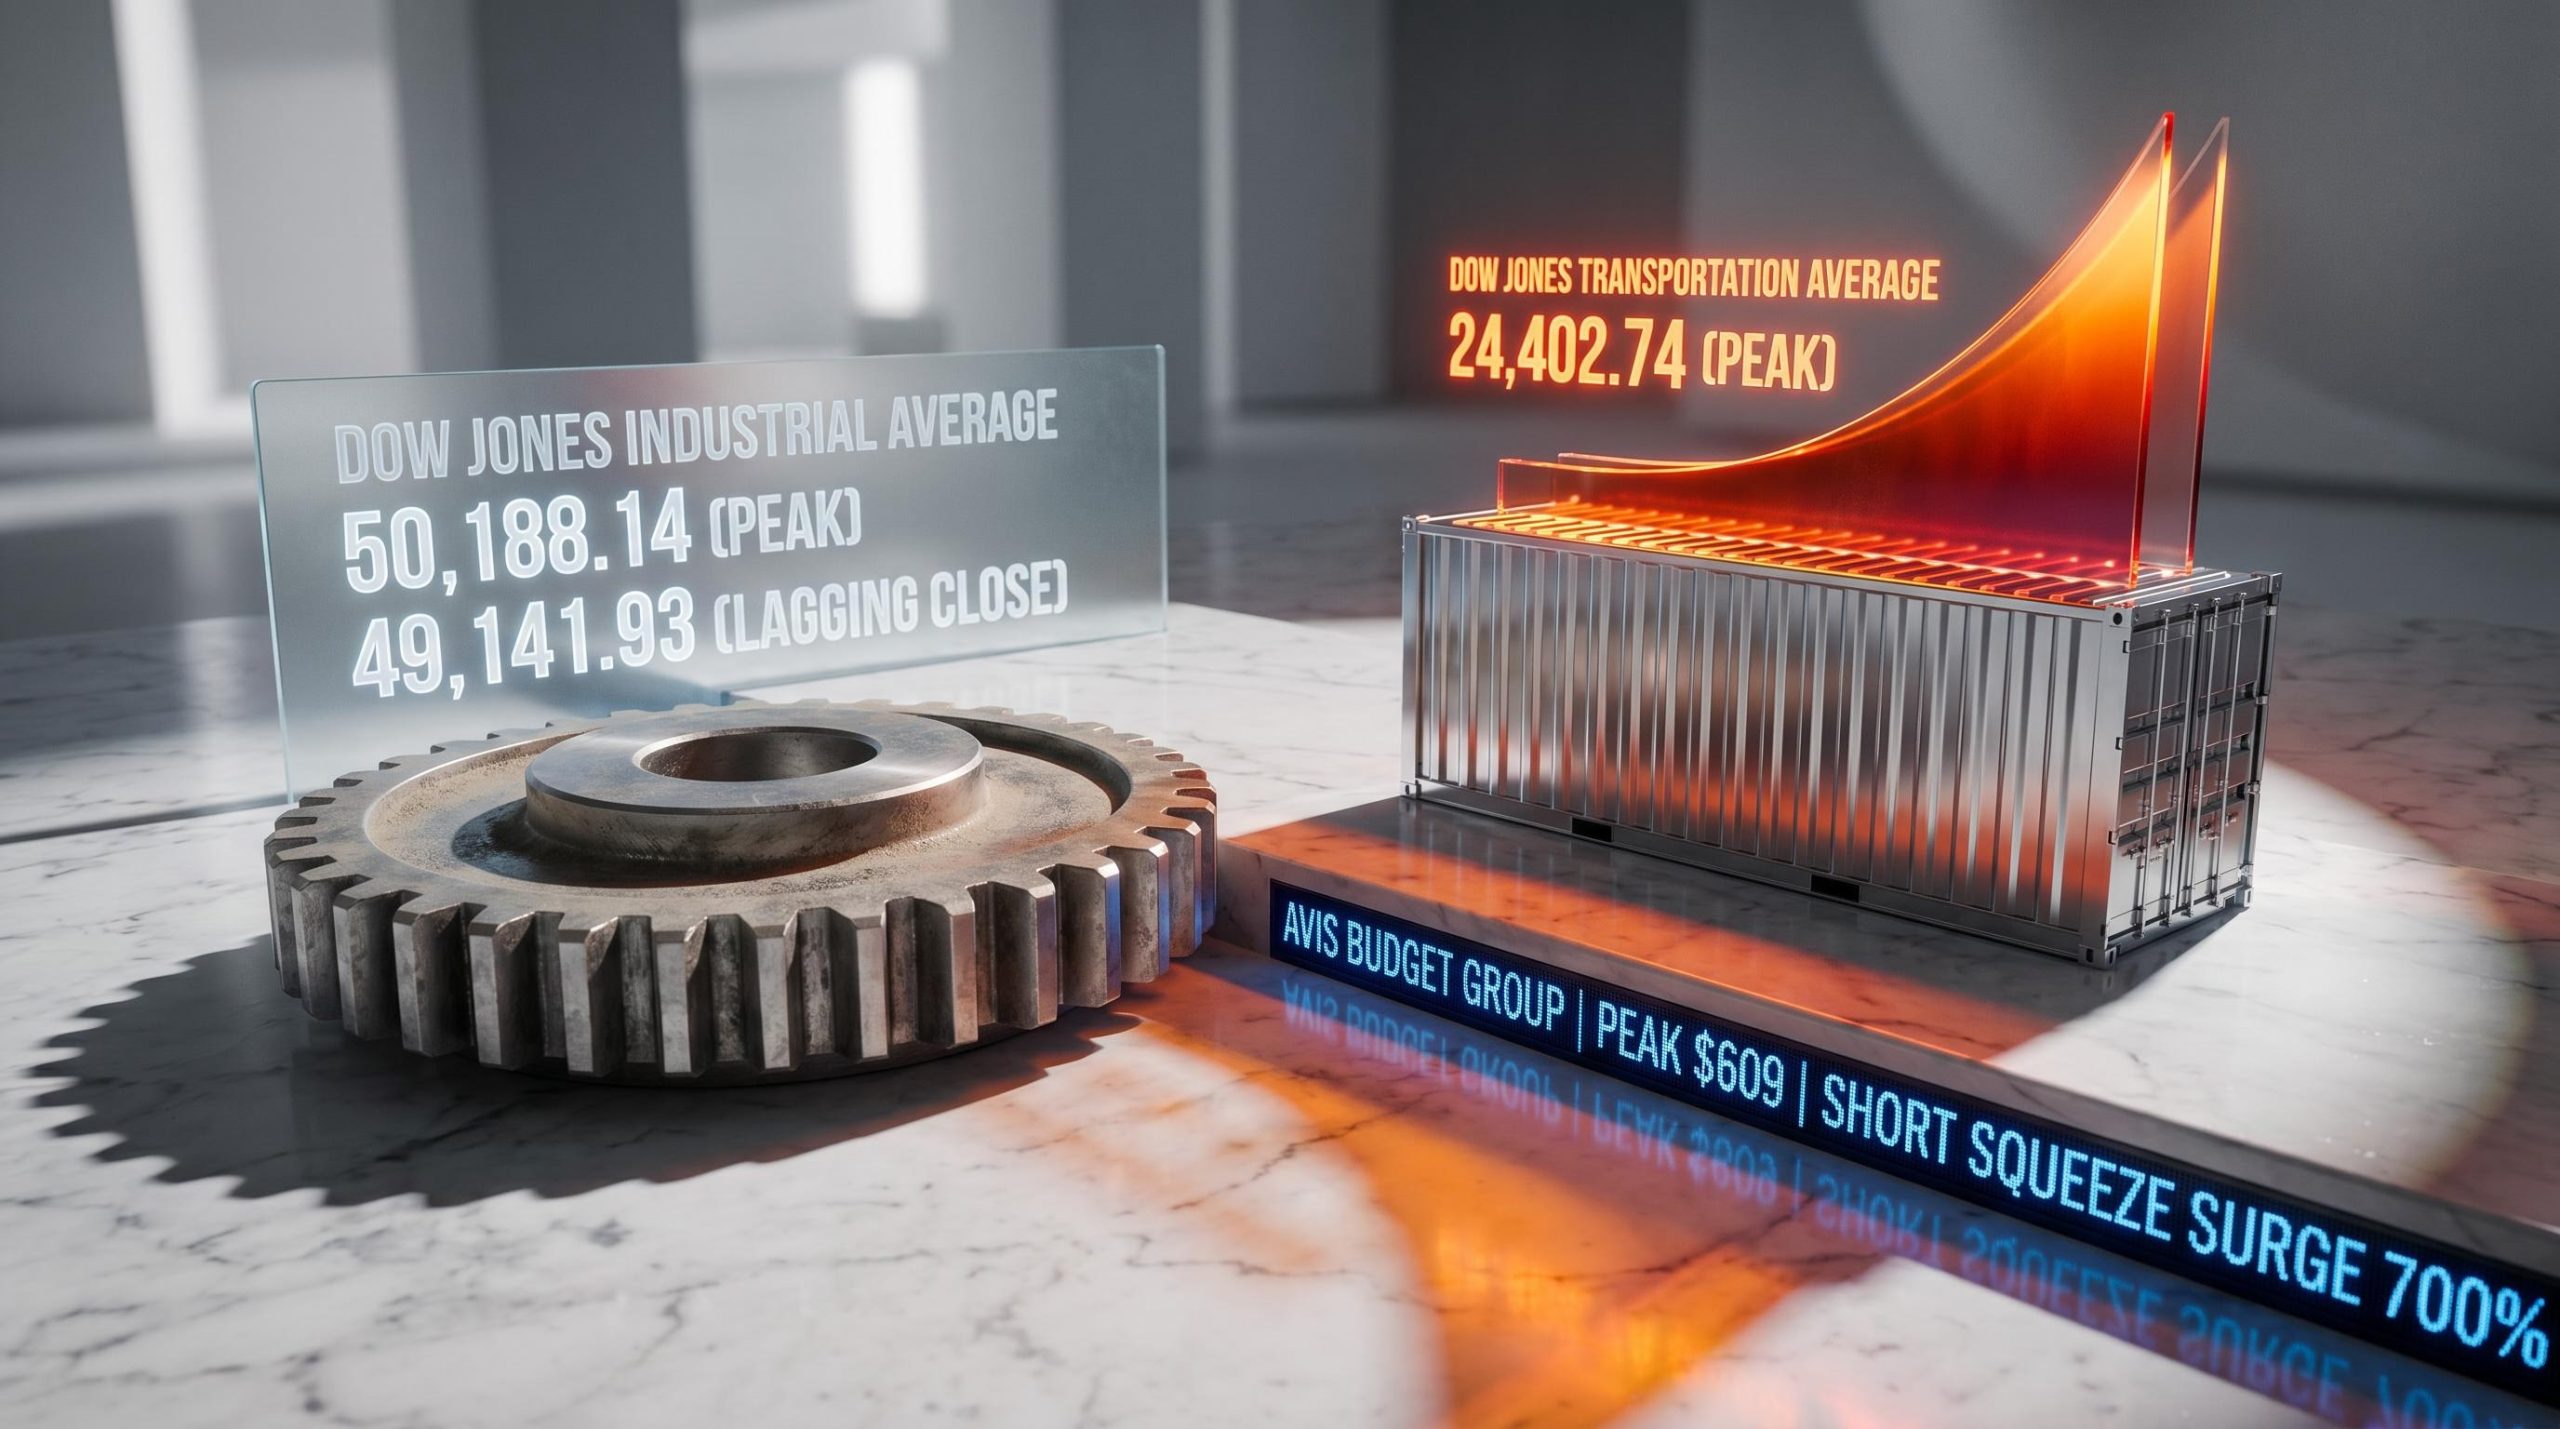
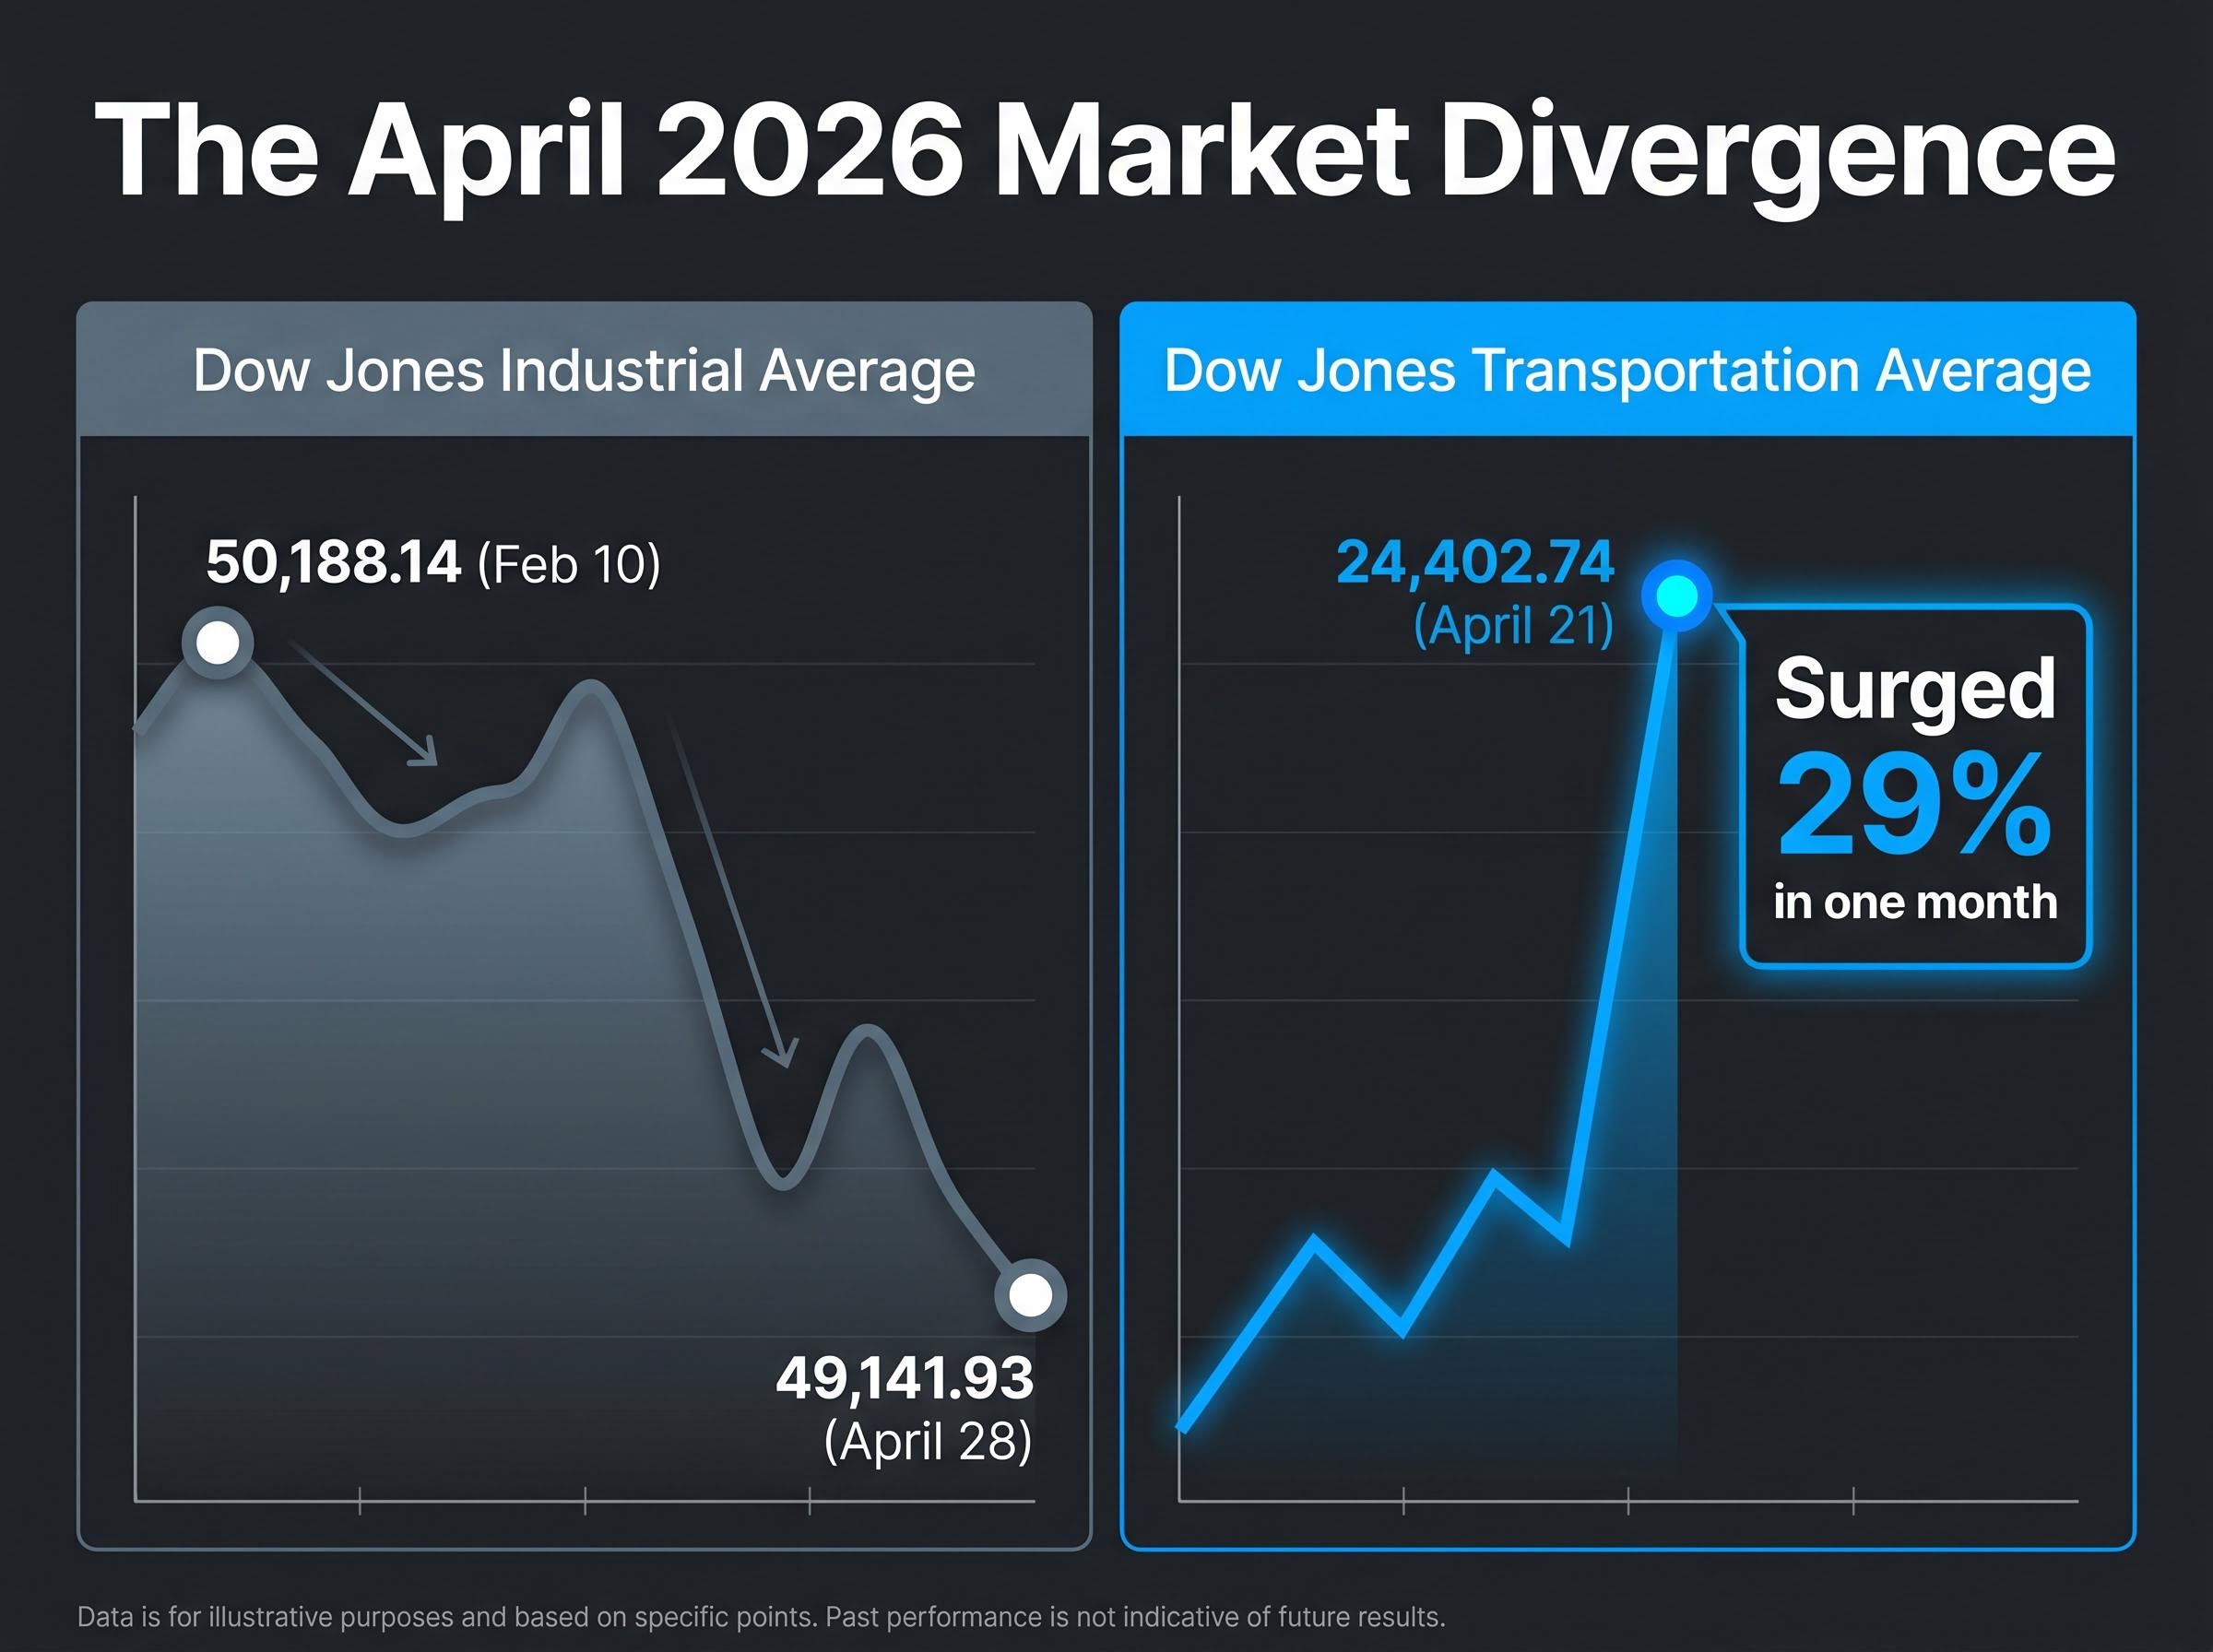
The divergence across major market benchmarks became mathematically undeniable in April 2026. While technology-heavy indices captured daily headlines with record highs, the Dow Jones Industrial Average painted a remarkably different picture. The industrial benchmark closed at 49,141.93 on April 28, remaining 2.1% below its February 10 peak of 50,188.14.
This sluggishness left the industrial average with a modest year-to-date gain of 2.5% as of April 27. In stark contrast, the Dow Jones Transportation Average surged to a record intraday high of 24,402.74 on April 21.
This created a massive structural divergence between the two highly watched indicators.
Market technicians view this specific non-confirmation as a recognised danger signal. According to data from LSEG, analysts note that a rally lacking broad participation often precedes a trend reversal. When the transportation sector accelerates but industrial stocks stall, the disconnect suggests goods are moving but manufacturing growth has plateaued.
This imbalance rarely sustains a prolonged bull market without eventual correction.
A growing chorus of financial experts warns that early index target fulfillment may be masking underlying stock market risk, particularly as retail optimism clashes with escalating geopolitical threats in the commodity sector.
| Market Benchmark | Status as of Late April 2026 | Year-to-Date Performance |
|---|---|---|
| Dow Jones Industrial Average | Closed at 49,141.93 (2.1% below peak) | +2.5% |
| Dow Jones Transportation Average | Reached intraday peak of 24,402.74 | Surged 29% in one month |
| S&P 500 | Pushing toward record highs | Significantly outperforming industrials |
This abstract technical concept translates directly into real-time portfolio risk. Financial analysts are expressing caution despite the headline-grabbing market highs, warning that the rally lacks the broad foundation necessary for sustained growth. By ignoring this structural warning, retail investors risk increasing their exposure at the precise moment institutional capital begins taking defensive postures.
To understand the severity of this market divergence, investors must look to the foundational rules of traditional technical analysis. The approach relies on observing how different segments of the economy interact to validate overall growth. At the core of this system is the principle of mutual confirmation.
The CFA Institute framework for mutual confirmation establishes that both averages must move synchronously to generate reliable buy or sell signals, a principle that remains central to evaluating structural market health.
This foundational concept dictates that both the industrial and transportation averages must reach new highs together to validate a bull market trend. The theoretical premise states that market trends are assumed to persist until they are definitively reversed. However, a trend is only considered healthy when it exhibits broad economic participation across complementary sectors.
Historically, industrials represent companies making goods, while the transportation sector represents the companies moving those goods. They are intrinsically linked in a functioning economy. A disruption in one invariably signals future headwinds for the other.
When one index fails to confirm the other’s high, it acts as a structural warning sign of a potential trend reversal. If factories are producing goods but transport companies are not seeing record shipping volumes, the economic narrative fractures. Understanding these rules allows investors to confidently interpret complex technical data, separating genuine growth from isolated sector bubbles. This theoretical background transforms abstract chart patterns into actionable economic insights.
The massive transportation rally in April 2026 initially looked like a definitive vote of economic confidence. A closer inspection of the data reveals a localised flaw that artificially inflated the benchmark. Broad confirmation requires widespread sector participation across multiple logistics and shipping equities, not isolated speculative surges.
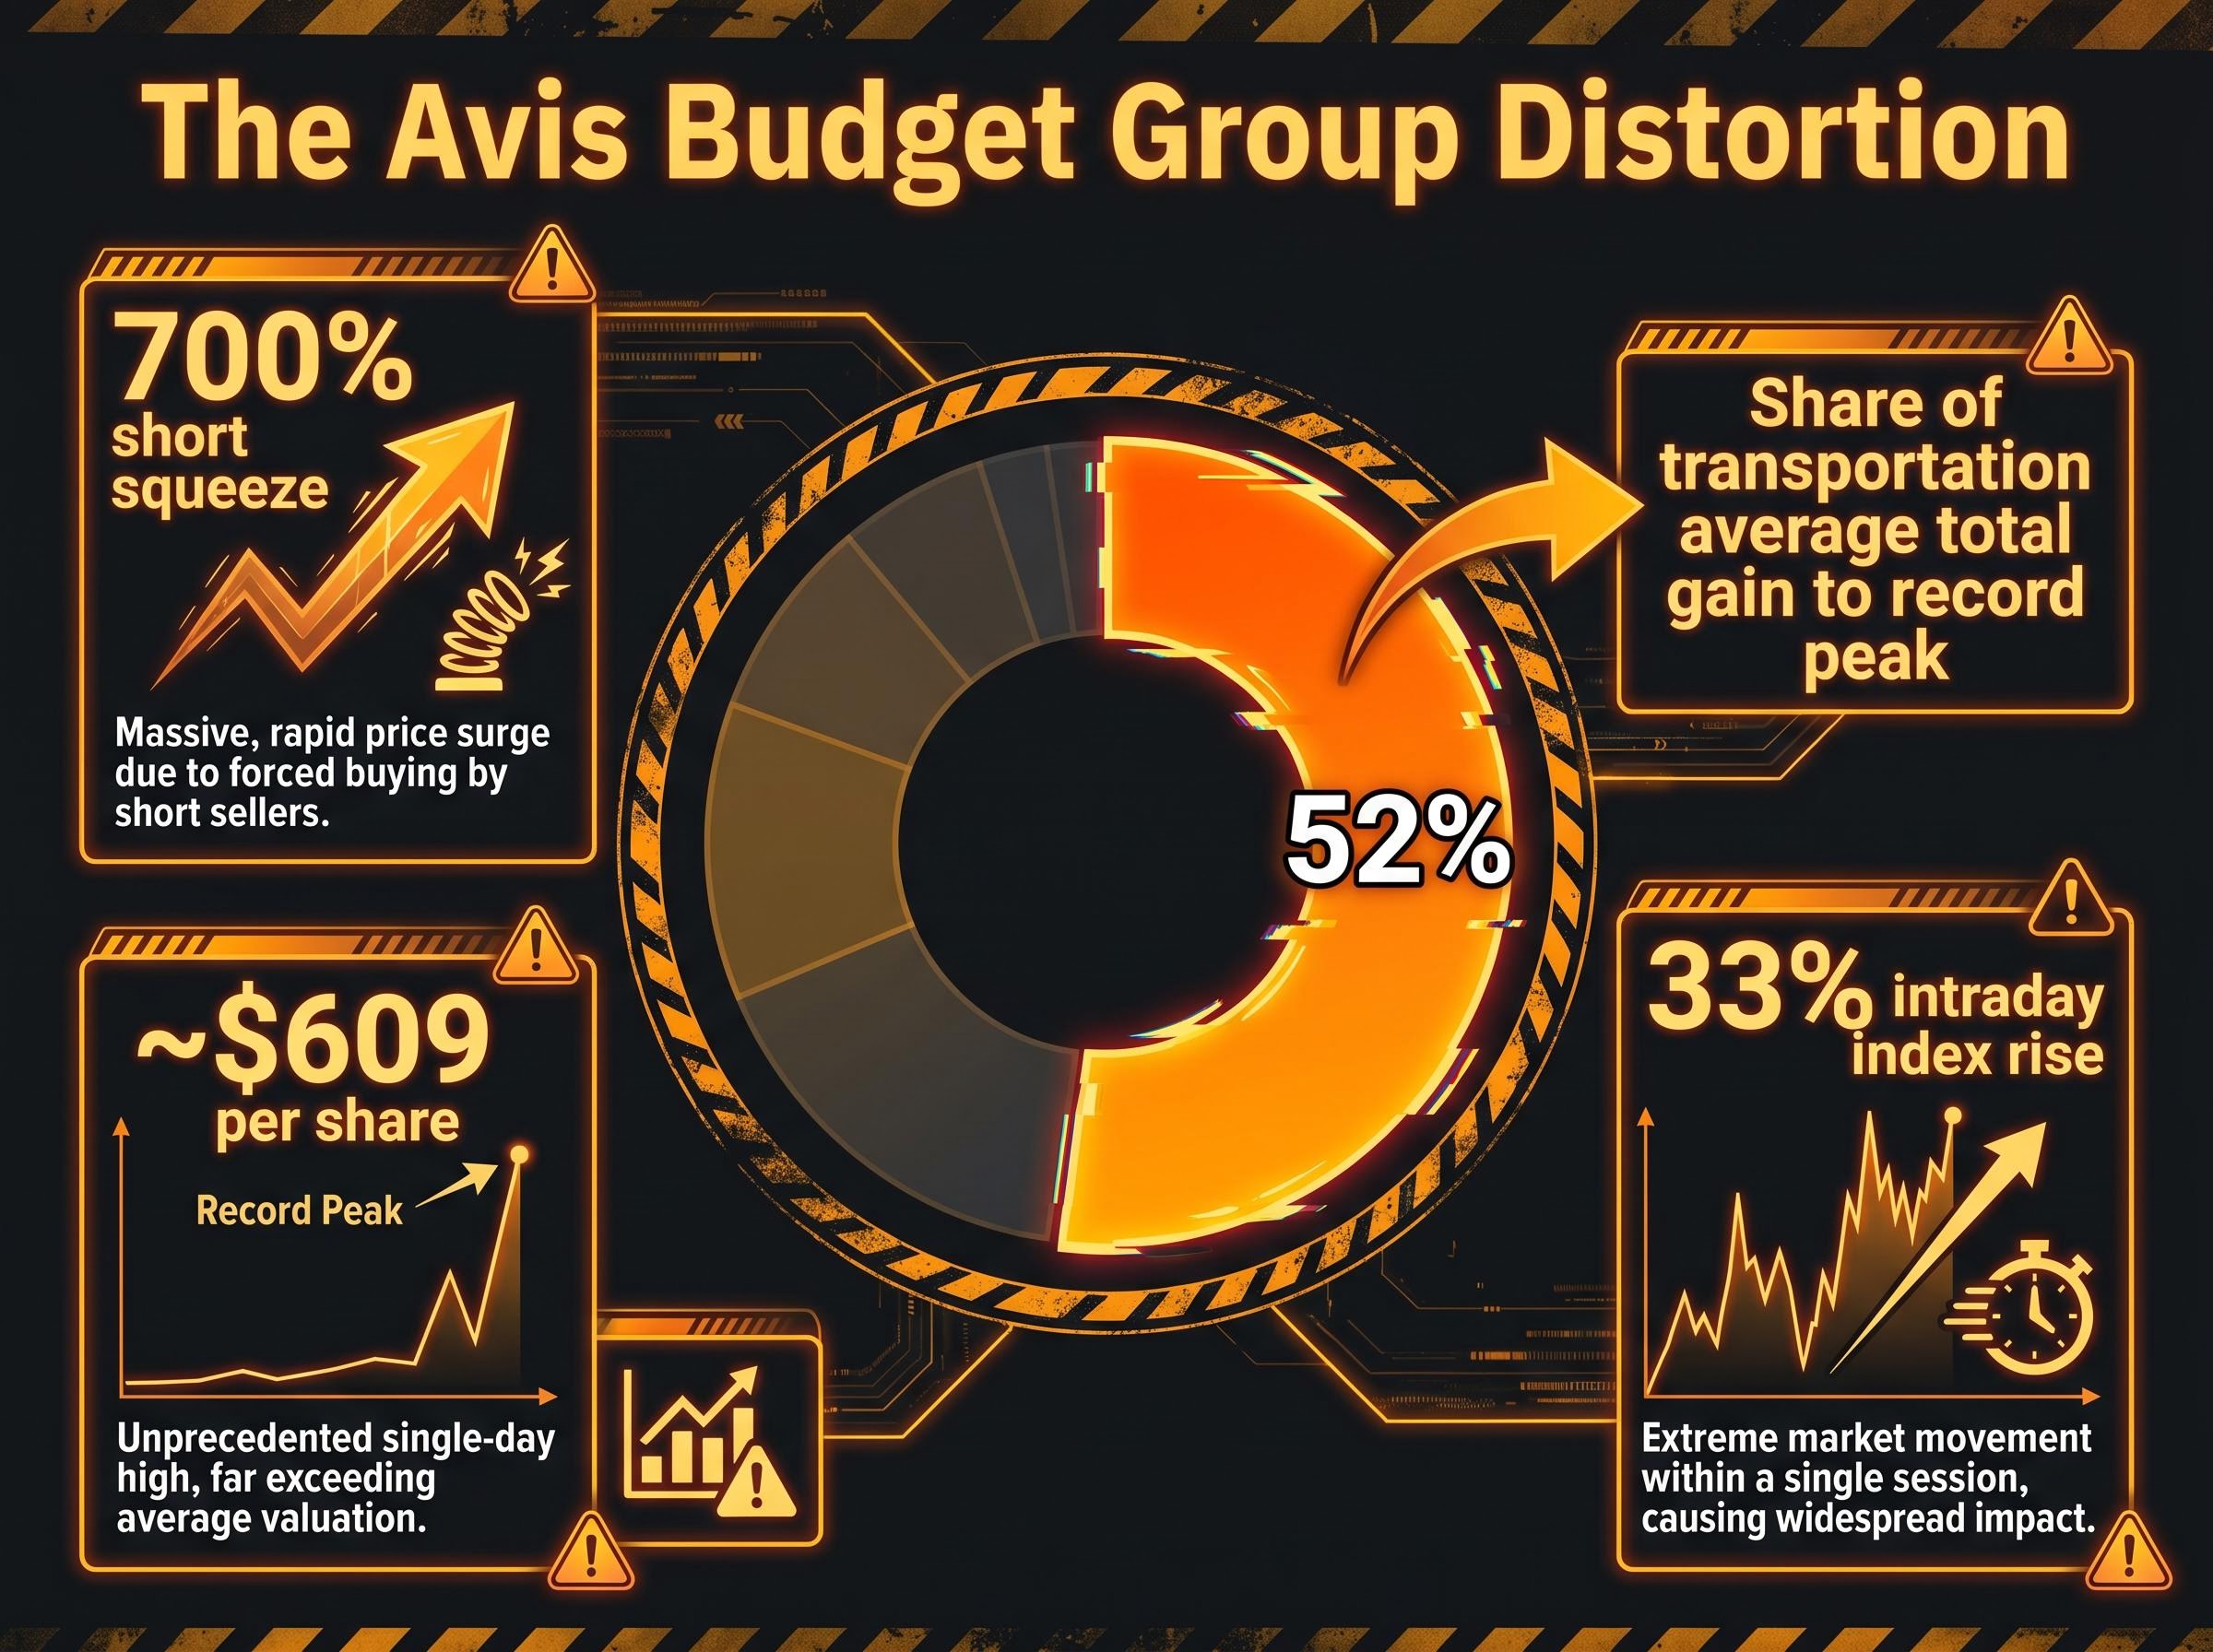
The distortion originated with Avis Budget Group, which experienced a massive 700% short squeeze driven by retail investors. The stock reached staggering highs around $609 per share during the month. This single retail-driven anomaly accounted for approximately 52% of the transportation average’s total gain to its record peak. The concentration of gains in one equity completely undermined the benchmark’s role as a broad economic indicator.
At its height, this single-stock momentum caused a 33% intraday rise in the broader index. The transportation average is price-weighted, meaning stocks with higher share prices disproportionately impact the overall index value.
Market Technician Warning “The unconfirmed surge in the transportation sector represents a prominent bearish indicator. A benchmark driven by a singular retail short squeeze rather than broad logistics growth is a definitive danger signal for the wider market.”
The structural fragility of the transportation peak quickly became apparent in the subsequent trading sessions.
Following the artificial high, the benchmark plunged 8.4%, eventually closing at 20,843.82 on April 27. This rapid unwinding erased a significant portion of the retail-driven gains.
This rapid decline validated the historical framework’s warning against unconfirmed highs. The sudden correction reveals the vulnerability of price-weighted averages to modern retail trading phenomena. Investors must look beneath index-level data to ensure a rally is driven by genuine economic expansion rather than isolated short squeezes.
Technical divergences do not occur in a vacuum, as they ultimately reflect tangible real-world economic pressures. The industrial sector’s inability to match the broader market’s momentum stems directly from fundamental macroeconomic headwinds. While technology stocks continue to soar, traditional blue-chip companies face a distinctly different operating environment defined by escalating input costs.
The structural composition differences between the industrial average and the S&P 500 dictate their divergent performance. The industrial benchmark carries heavy exposure to energy-sensitive manufacturing businesses. These companies are bearing the brunt of rising input costs and supply chain complications, preventing them from achieving the margins seen in software and services.
The Bureau of Labor Statistics PPI data for March 2026 reveals a significant jump in processed energy goods pricing, directly explaining the margin compression restricting traditional manufacturing companies.
Several specific macroeconomic factors are currently weighing on blue-chip performance:
Middle East Instability: Ongoing geopolitical conflict is driving up global energy prices and straining international supply chains. Persistent Inflation: Rising energy costs are keeping inflation firmer than anticipated, directly impacting manufacturing margins. Stagflation Concerns: The combination of sticky inflation and plateauing manufacturing output is raising fears of economic stagnation. Growth Downgrades: Institutional analysts are recalibrating their expectations, with UBS recently lowering its 2026 target for the S&P 500 due to mounting growth risks.
The timeline perfectly illustrates this fundamental pressure. The industrial benchmark has failed to establish a new peak since February 10, a date that immediately preceded the onset of renewed Middle Eastern hostilities. These charts are reflections of geopolitical realities that directly restrict corporate profitability. The traditional manufacturing base simply cannot absorb the shock of sustained energy price increases as easily as the broader market.
The divergence between lagging industrials and surging technology benchmarks forces investors to evaluate whether the broader upward trajectory is truly validated. Historical principles suggest extreme caution, yet modern market mechanics complicate these traditional signals. The resilience of tech-heavy indices overcoming international stability concerns demonstrates how artificial intelligence momentum can decouple certain sectors from the physical economy.
However, the persistent elevation in domestic fuel prices continues to flash historical stock market warning signs that have traditionally preceded broad equity declines across the wider economy.
Retail trading surges, like the one seen with Avis Budget Group, further distort the data. These modern distortions mean technical signals cannot be treated as binary buy or sell commands. Instead, they provide a nuanced analytical framework for measuring market health and identifying underlying fragilities. The challenge for analysts lies in filtering out retail noise to find the genuine economic signal.
To officially validate the transportation sector’s recent highs and signal a healthy rally, the industrial benchmark must break through its current resistance. The specific index movement required is for the industrial average to surpass its February 10 peak of 50,188.14. Only then can the market confirm a coordinated expansion across both manufacturing and logistics.
Until that precise technical overhang is cleared, the broader market remains in a state of non-confirmation. Patience is required when interpreting these traditional signals, as trend validation often unfolds over several weeks or months. Investors must watch this specific milestone closely to judge the underlying structural health of the ongoing equity expansion.
The headline-grabbing market highs of April 2026 mask a fundamental disconnect beneath the surface. The failure of the industrial average to confirm the transportation sector’s record peaks serves as a structural warning that the economic expansion lacks broad participation. While modern market distortions like the short squeeze complicate the data, the core principles of mutual confirmation remain highly relevant.
A genuine bull market requires both the makers and the movers of goods to demonstrate simultaneous growth. Investors must prioritise stringent risk management in this fragmented environment. Portfolio strategies should remain defensive until the industrial benchmark successfully breaches its critical February resistance level. Monitoring these technical levels provides an important safeguard against unexpected market reversals.
For readers wanting to model the downside probabilities if these structural warnings play out, our detailed coverage of S&P 500 recession risk examines institutional probability models and historic index drawdowns during official economic contractions.
This article is for informational purposes only and should not be considered financial advice. Investors should conduct their own research and consult with financial professionals before making investment decisions. Past performance does not guarantee future results. Financial projections are subject to market conditions and various risk factors.
Dow Theory is a framework for technical analysis that assesses market health by observing how different economic sectors, particularly industrial and transportation averages, confirm each other's trends. Its relevance lies in signaling potential trend reversals when these sectors diverge.
Non-confirmation, where one average reaches a new high but the other does not, indicates a lack of broad economic participation and often precedes a trend reversal. This suggests underlying fragility in a bull market that lacks broad foundation.
The April 2026 divergence occurred because the Dow Jones Industrial Average lagged due to macroeconomic headwinds, while the Dow Jones Transportation Average was artificially inflated by a massive short squeeze in Avis Budget Group, a single stock.
To officially validate the current equity rally, the industrial average must surpass its February 10 peak of 50,188.14, confirming coordinated expansion across both manufacturing and logistics sectors.