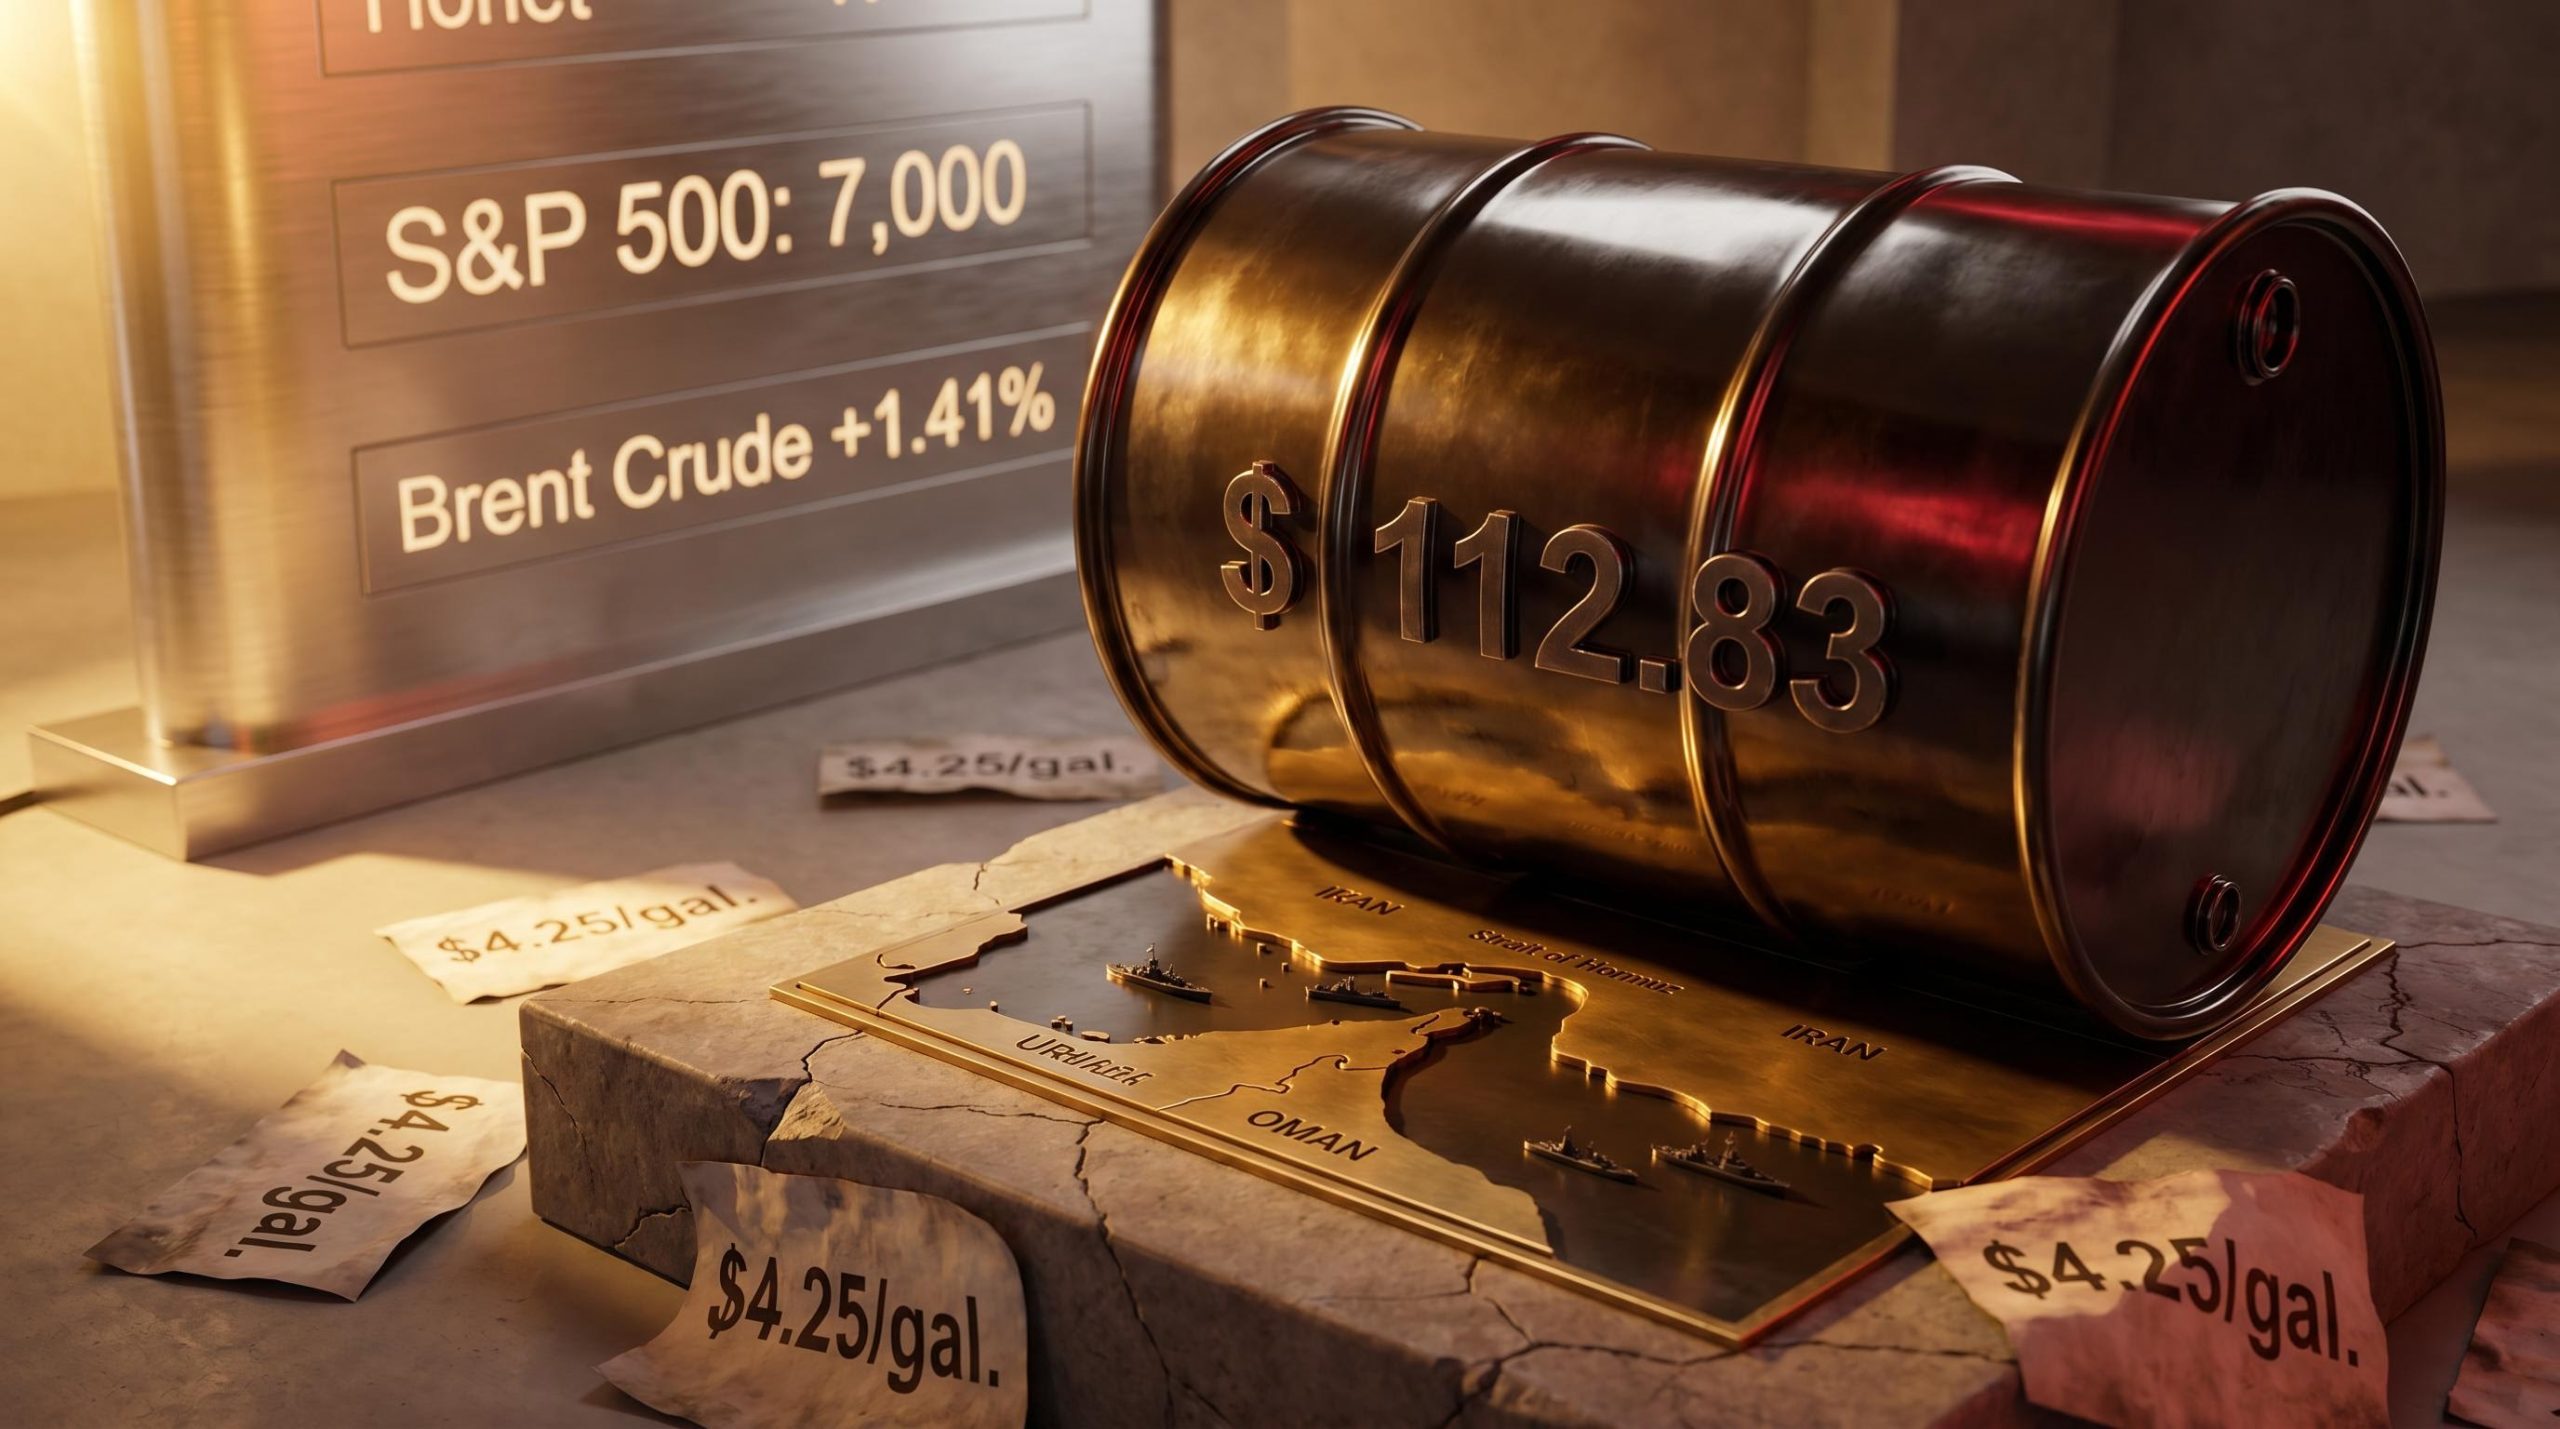
Brent crude hit $112.83 per barrel on 29 April 2026, and roughly two-thirds of S&P 500 companies have already flagged rising energy costs in their quarterly earnings, even as the index sits at record highs near 7,000. The collision between surging oil prices and a stock market at its peak is not hypothetical. It is happening in real time.
The Strait of Hormuz, the narrow chokepoint through which a significant share of the world’s seaborne oil passes, remains largely closed following the Iran conflict. Iran’s new Supreme Leader has signalled the closure should persist as a strategic pressure instrument. US naval forces are enforcing a blockade on Iranian-linked shipping, and mines have been reported in the channel. This is not a brief disruption; the supply shock is structural and deepening.
What follows traces the causal chain from the Hormuz closure through the oil price surge to the specific, historically grounded mechanisms by which elevated energy costs erode equity market returns, giving readers the analytical framework to assess what comes next for both markets.
Why the Strait of Hormuz closure is unlike previous oil shocks
Tanker traffic through the Strait of Hormuz has slowed to a near standstill. Iranian forces have laid mines using smaller vessels, according to US officials, while a US naval blockade is actively constraining Iranian-linked shipping from either side. The physical environment in the strait is not one of reduced flow; it is one of near-total interruption.
The EIA Strait of Hormuz chokepoint analysis quantifies the share of global petroleum liquids and liquefied natural gas that transits the strait annually, establishing the baseline supply volume against which the current near-total interruption should be measured.
What removes the assumption of a quick resolution is intent. Iran’s new Supreme Leader, Mojtaba Khamenei, has explicitly stated that the closure should continue as a pressure instrument against adversaries.
Mojtaba Khamenei has stated that the Strait of Hormuz should remain closed to pressure adversaries, signalling that the disruption is a deliberate strategic choice, not a temporary escalation.
Three compounding factors make this closure structurally distinct from previous oil supply disruptions:
- Mines in the shipping channel, laid by Iranian forces, creating navigational hazards that persist regardless of diplomatic progress
- A US naval blockade actively constraining Iranian-linked tanker movements, adding a second layer of physical obstruction
- Infrastructure damage and storage capacity limitations that have forced producers to cut output, meaning price normalisation would be a slow process even if political conditions shifted overnight
Past oil shocks were largely logistical. This one combines a physical blockade, deliberate strategic intent from the controlling party, and production-level damage, making it the most durable supply disruption in recent memory.
When big ASX news breaks, our subscribers know first
From $65 to $112: how fast oil moved and where banks say it goes next
Brent crude opened 2026 near $65 per barrel. For the first three months of the year, prices drifted within a narrow range. Then the Hormuz closure changed the trajectory entirely.
By 27 April, Brent had exceeded $100, representing roughly a 17% weekly gain at that stage. Two days later, the confirmed price reached $112.83, up 1.41% day-over-day. The move from $65 to $112 took roughly four months, with the sharpest acceleration concentrated in the final weeks of April.
Where prices go from here depends on who you ask, and the range of answers reveals how wide the uncertainty band has become.
| Institution | Forecast price | Scenario / condition | Date issued |
|---|---|---|---|
| Morgan Stanley | $110/bbl | Q2 2026 base case | 13 April 2026 |
| Goldman Sachs | $90/bbl | Q4 2026; assumes resolution | April 2026 |
| Citigroup | $150/bbl | If disruption persists through 2026 | April 2026 |
| JPMorgan | Higher than $60/bbl base | Prior base case overtaken by events | April 2026 |
The spread between Goldman’s $90 and Citigroup’s $150 is not a methodological disagreement. It is a disagreement about how long the strait stays closed, the single variable investors cannot model with confidence right now.
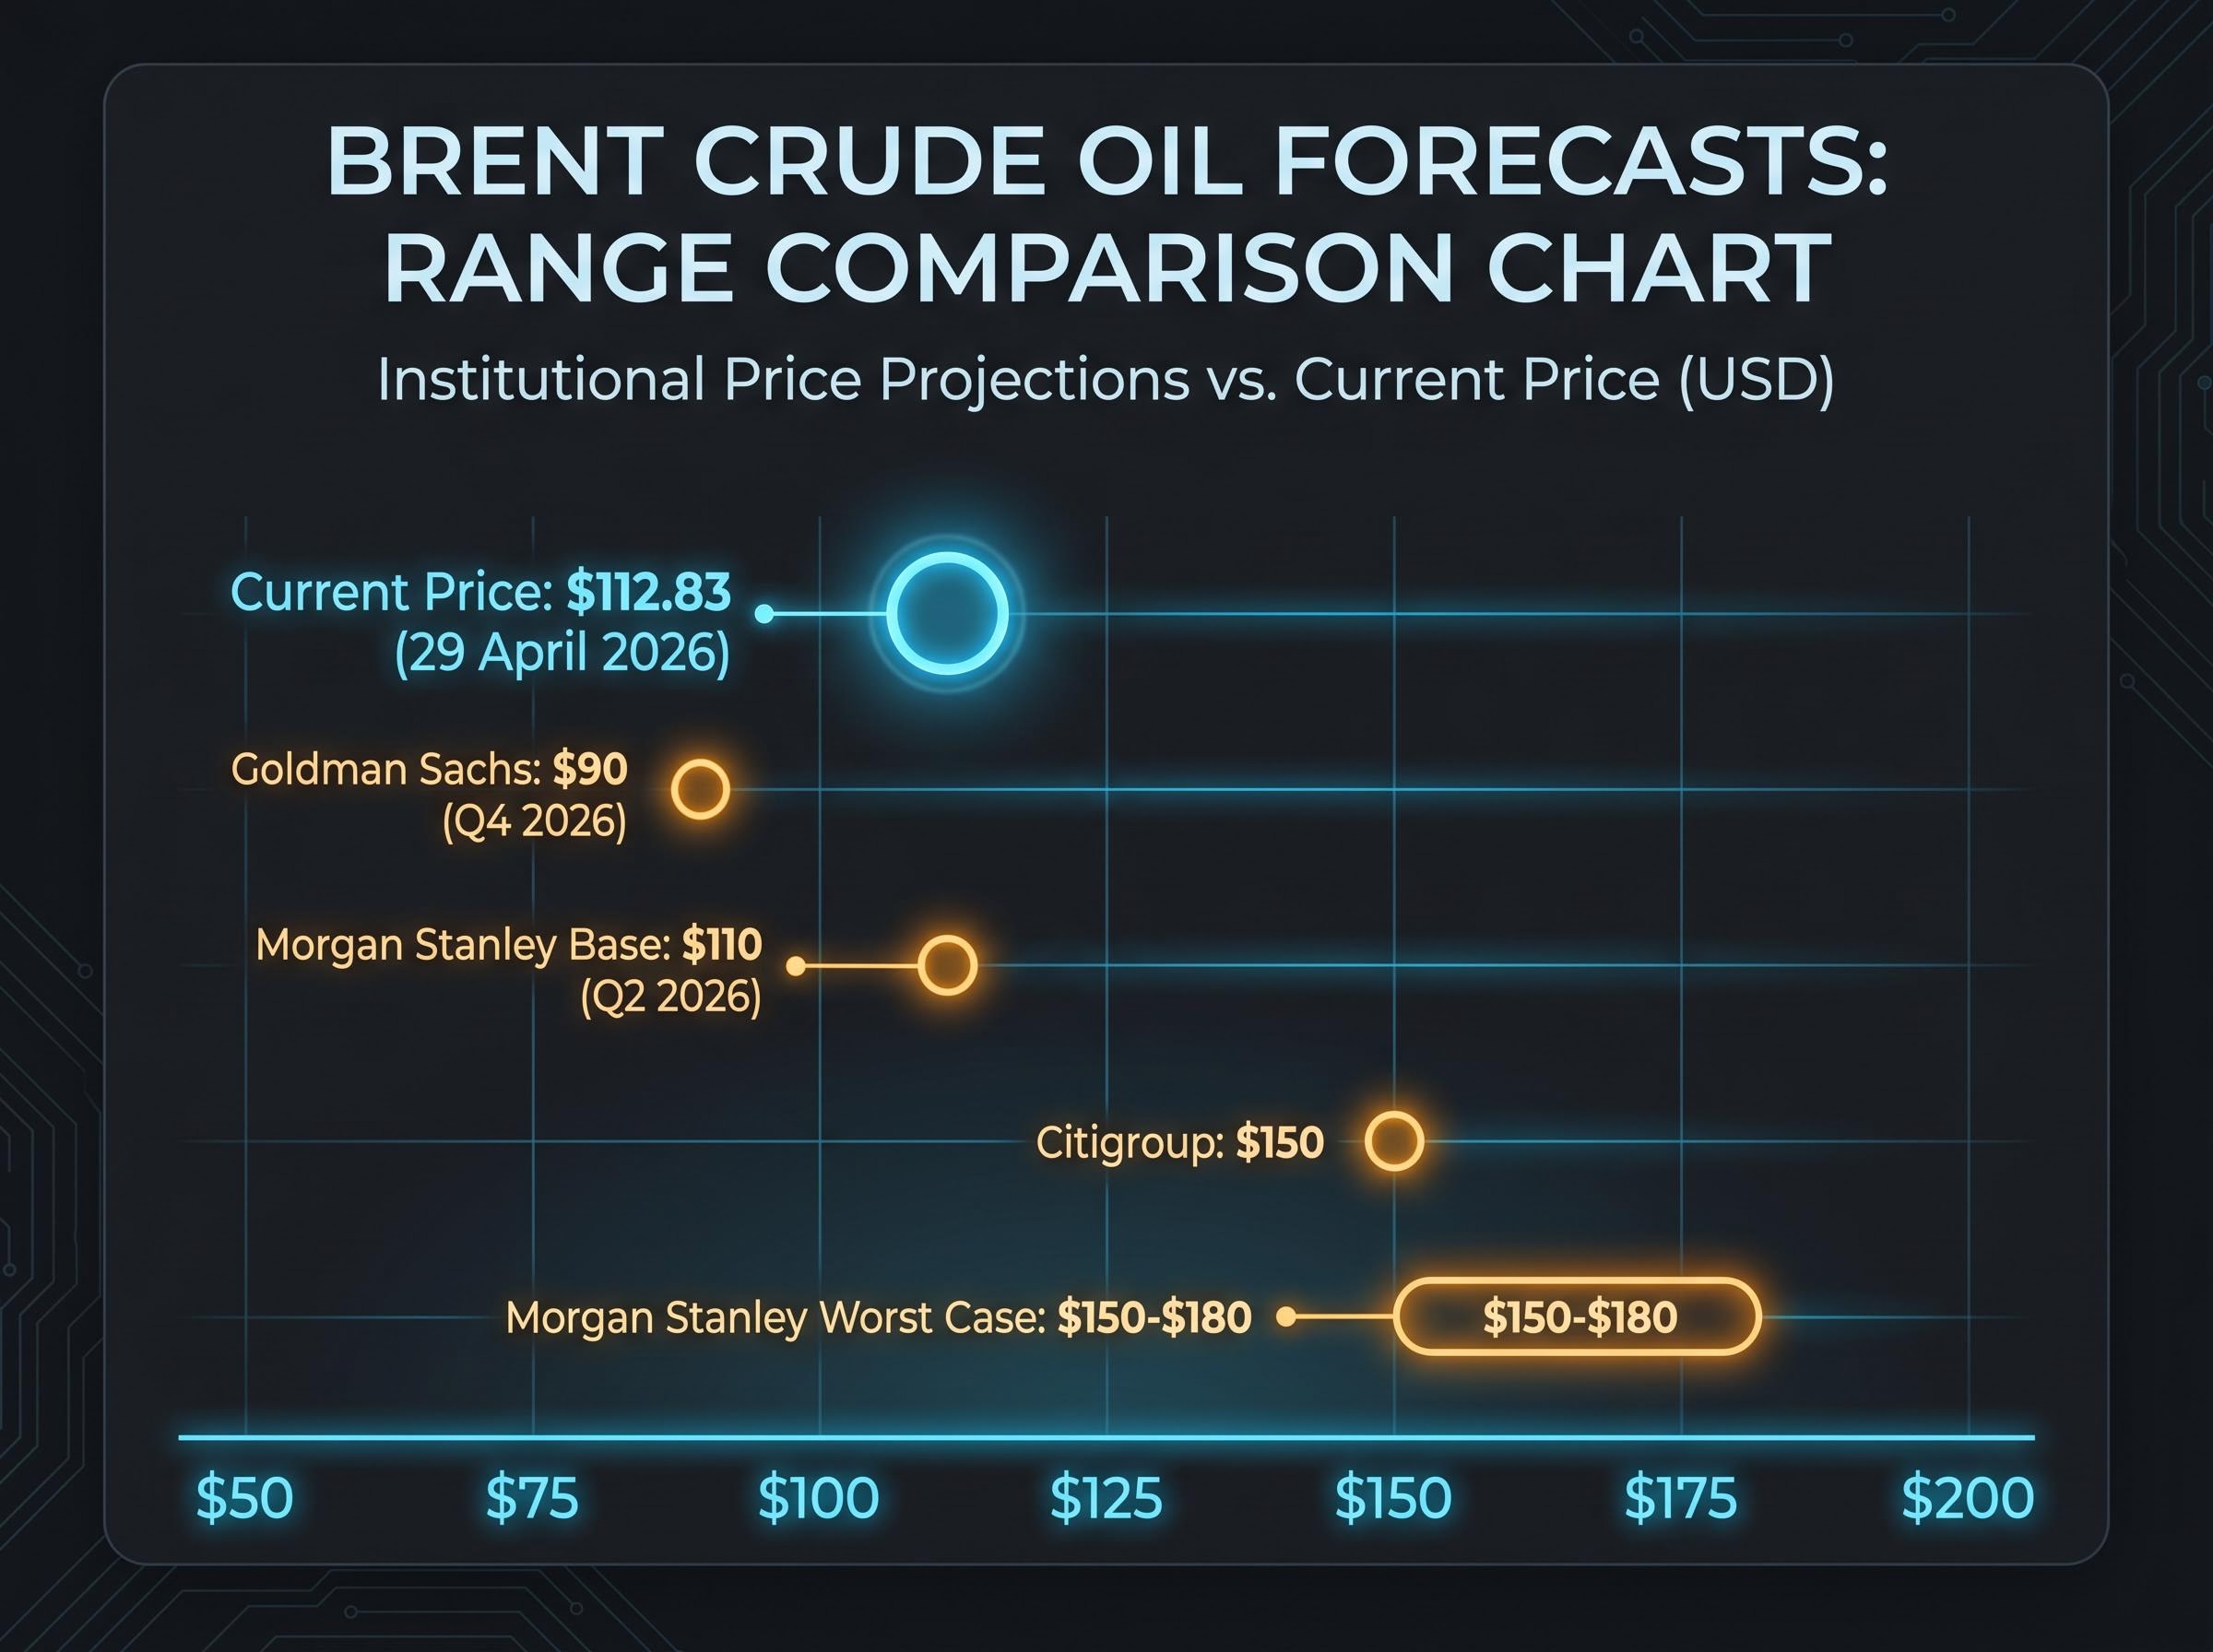
Morgan Stanley’s worst-case scenario: If the Hormuz closure extends for several months, Brent could reach $150-$180 per barrel, a range that would place the current price barely past the halfway point of the potential move.
A Russian envoy separately forecast Brent exceeding $150 within two to three weeks, though this projection comes from a diplomatic rather than financial-analyst source and should be weighted accordingly.
How $4 gasoline squeezes consumers and threatens economic growth
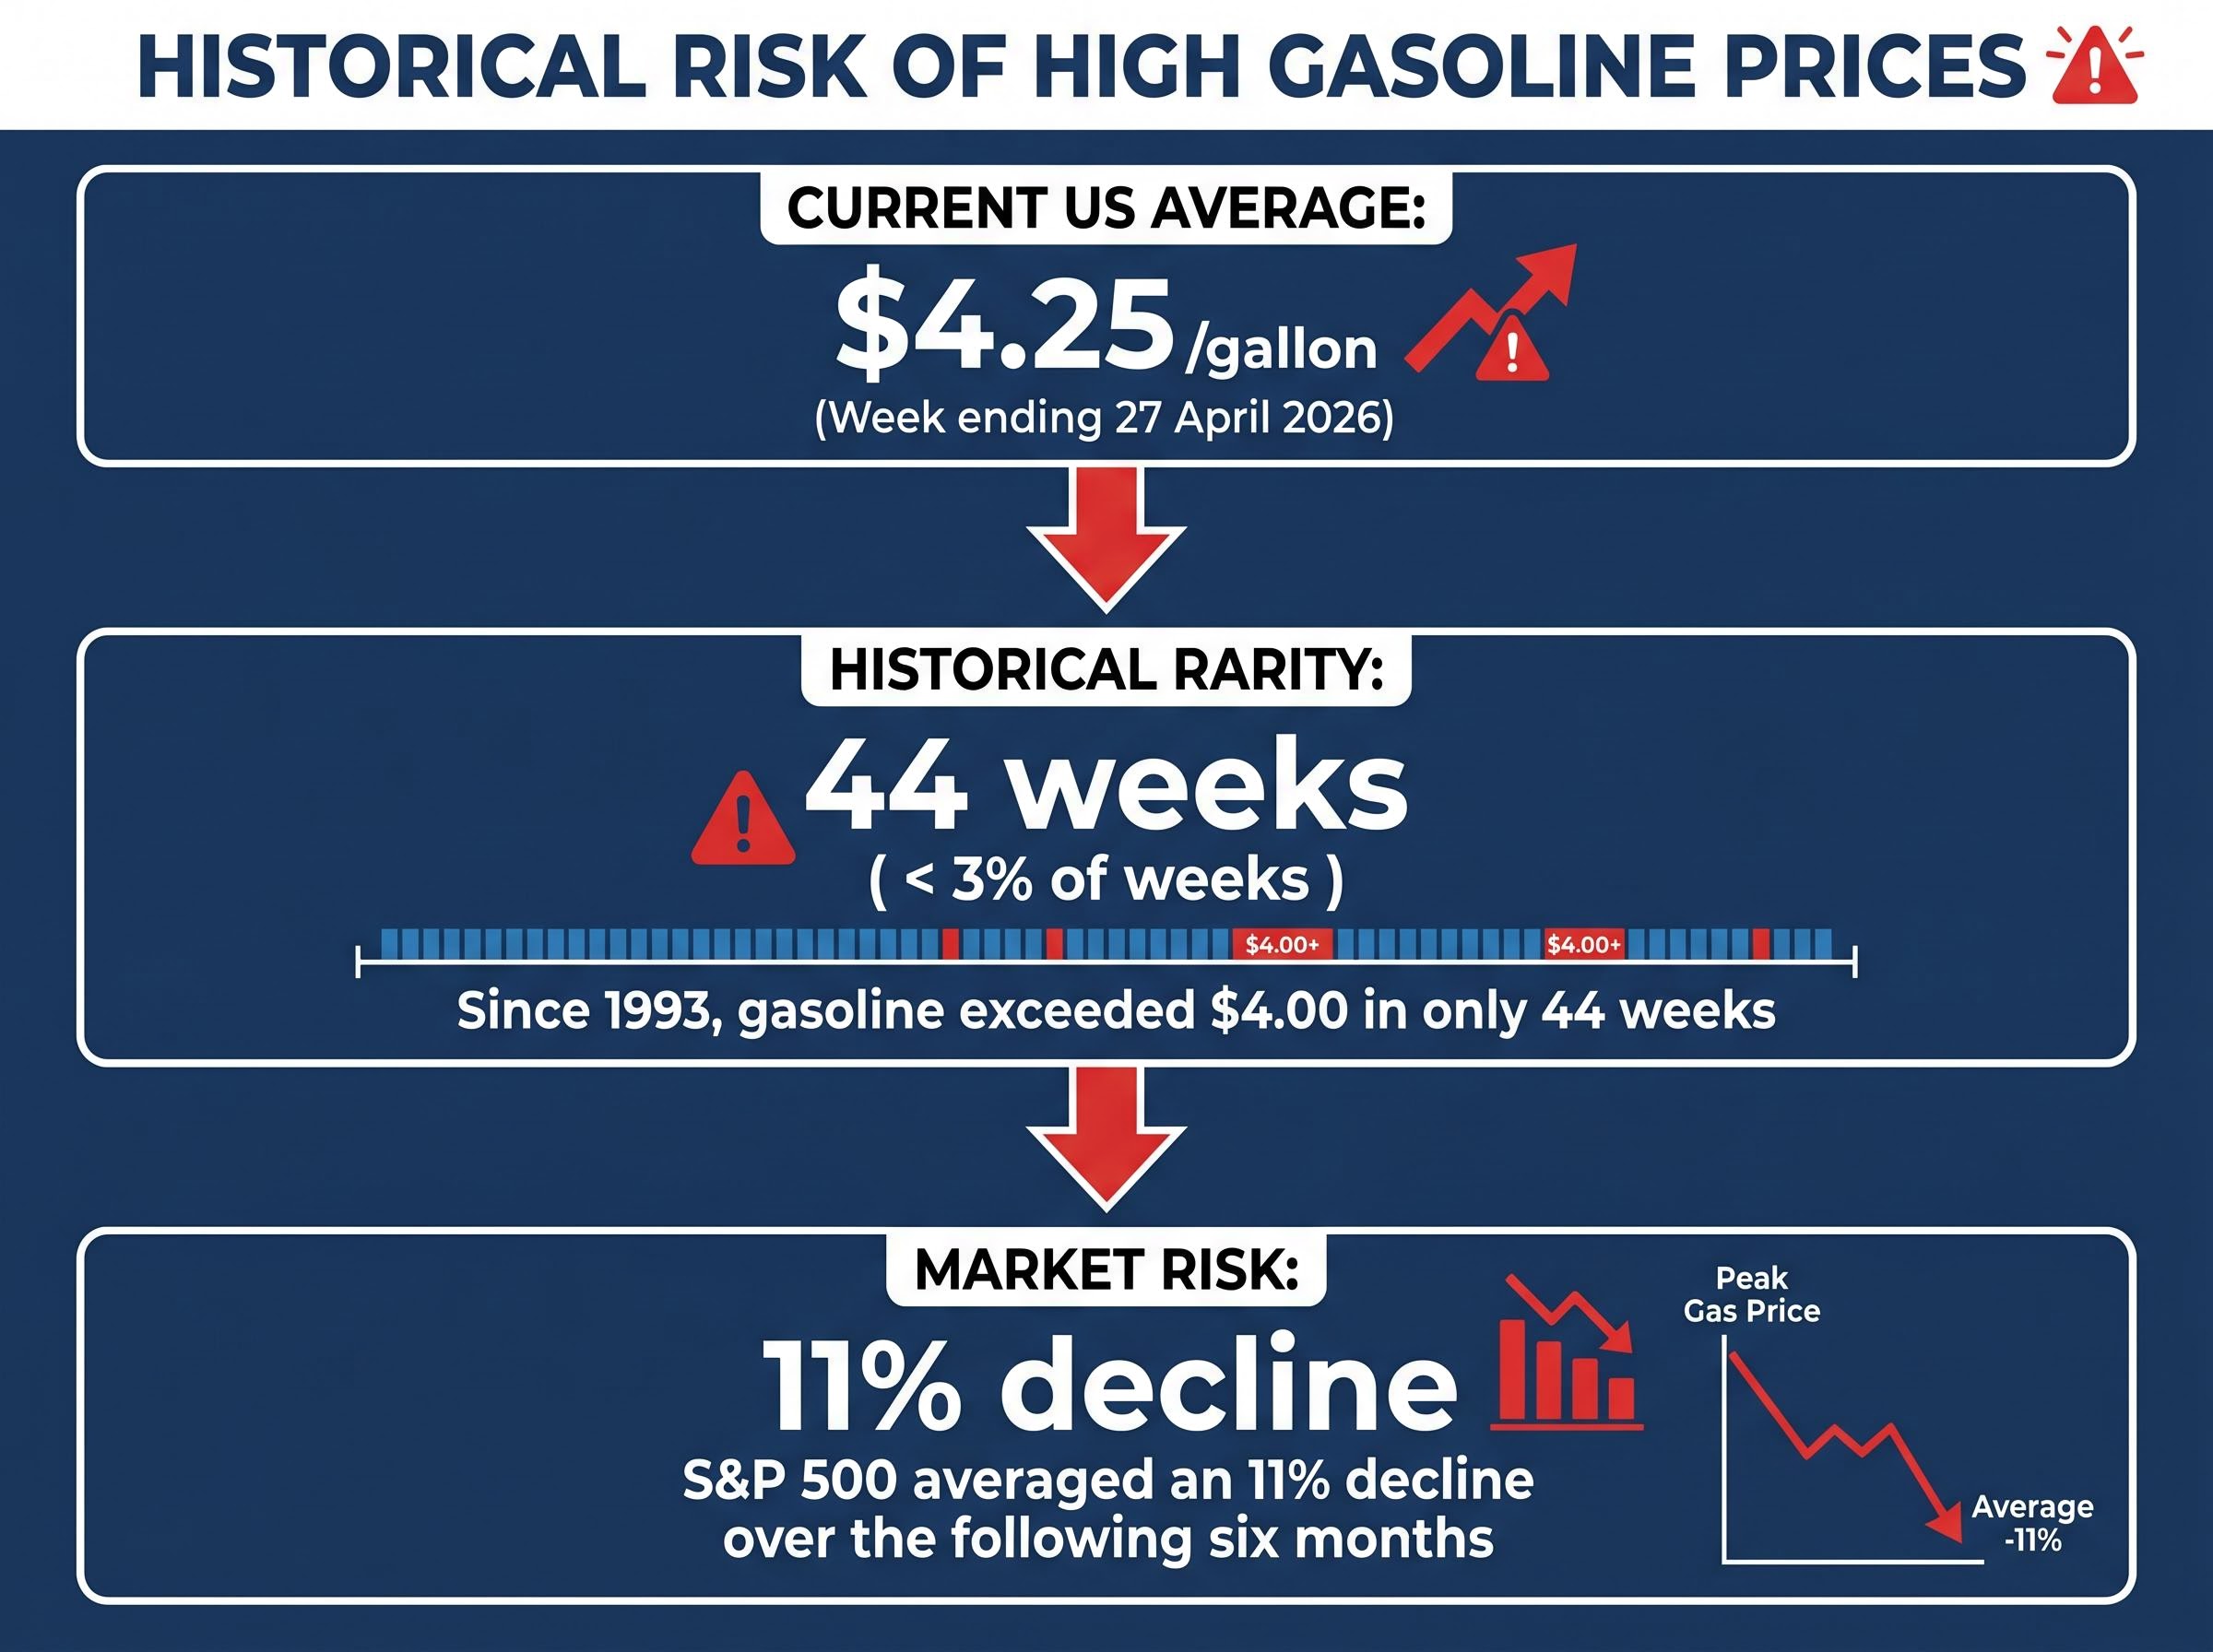
US average gasoline prices (all grades) reached $4.25 per gallon for the week ending 27 April 2026, according to the US Energy Information Administration (EIA). That figure represents a roughly 45% increase year-to-date and matches highs last recorded in August 2022.
The EIA weekly retail gasoline price data covering all grades and formulations provides the official government series against which the current $4.25 reading is measured, a dataset that extends back to 1990 and confirms how rarely this threshold has been breached.
The rarity of that price level is what makes the current moment worth examining closely. Since 1993, gasoline has exceeded $4.00 per gallon in only 44 weeks, representing fewer than 3% of all weekly readings over that period.
In the 44 weeks since 1993 when US average gasoline exceeded $4.00 per gallon (fewer than 3% of all weeks), the S&P 500 averaged an 11% decline over the following six months.
That statistic is a historical risk signal, not a guarantee. But the transmission mechanism behind it is straightforward: elevated fuel costs compress household spending capacity through two channels.
The full 30-year gasoline price and S&P 500 history behind that statistic reveals that sustained episodes, where prices held above $4.00 for multiple consecutive weeks, were associated with peak-to-trough bear market declines averaging 41%, a materially worse outcome than the 11% average figure that blends brief and prolonged high-price episodes together.
- Direct household impact: Higher prices at the pump reduce discretionary income immediately, weakening the consumer spending that drives roughly two-thirds of US GDP
- Indirect business cost pass-through: Rising transportation and energy input costs for companies are eventually passed to consumers through higher prices on goods and services, compounding the squeeze
The $4.25 reading means the clock on that six-month historical risk window started this week.
What the S&P 500 does during recessions, and why economists are already warning
Since the S&P 500’s establishment in 1957, the index has averaged a 32% loss during recessionary periods. That is the baseline for understanding downside risk if GDP contracts.
The S&P 500 currently sits at record highs near 7,000, up roughly 13% from its 30 March low. The index fell approximately 9% from its March peak when the conflict began; that decline has since been fully recovered. The recovery, however, does not mean the economic risk has passed.
Mark Zandi, Chief Economist at Moody’s, has offered the most concrete assessment of the damage floor. According to his analysis shared on X, even a swift wind-down of the Iran conflict and a rapid oil price decline would still result in no GDP growth and no job creation for the remainder of 2026.
Mark Zandi, Chief Economist, Moody’s: Even a swift resolution of the Iran conflict and rapid oil price pullback would still produce no GDP growth and no job creation for the remainder of 2026.
Three economic damage indicators are already visible in the data:
- March 2026 US inflation jumped 0.9%, reflecting the war’s direct impact on oil and refined products
- Unemployment is expected to continue rising regardless of the conflict resolution timeline
- GDP forecasts have been downshifted, with economists projecting a drag of 0.5% to 1.5% one year ahead following oil spikes of this magnitude
The gap between where the S&P 500 sits and what the macroeconomic evidence suggests is widening, not narrowing.
Recession probability estimates across institutions show a striking gap between what equity prices imply and what macroeconomic models project: Goldman Sachs, JPMorgan, and Moody’s Analytics have placed 12-month US recession probability at 30%, 35%, and 48.6% respectively, a range that translates to an implied S&P 500 decline toward 4,788 if the historical 32% recessionary average is applied to the current index level near 7,000.
What the energy shock means for the S&P 500’s record-high rally right now
What drove the rally back to record highs
The S&P 500’s 13% recovery from its 30 March low has been powered by strong Q1 corporate earnings. When the conflict began and the index shed roughly 9%, investor capital rotated into Treasuries and money market funds. The return of that capital to equities reflects earnings optimism, not a resolution of the underlying geopolitical risk.
What the record high is masking
Those same earnings reports tell a less comfortable story. Approximately two-thirds of S&P 500 companies reporting Q1 2026 results have cited rising energy cost concerns, the highest frequency of energy warnings in several years.
OANDA analyst Kelvin Wong has stated that oil prices will remain elevated given the prolonged closure risk.
VT Markets has highlighted supply-side risk as the primary price driver, with Hormuz transit volumes and US policy signals identified as the variables the market is watching most closely.
Strong earnings can sustain a rally for a quarter. Sustained energy cost pressure compounds across quarters, which is why the two-thirds citation rate from S&P 500 companies is the metric to watch as Q2 reporting begins.
Goldman Sachs has defined a specific Goldman Sachs sell-off threshold tied to Brent crude levels, at which the bank projects a 5-10% S&P 500 decline, and Brent at $112.83 sits less than $2 above that trigger; forward earnings estimates have not yet absorbed a sustained oil shock, which means the earnings support currently underpinning the rally rests on assumptions the market has not yet tested.
The variables that will determine whether oil pressure becomes a market crisis
Three variables will determine whether this remains a manageable energy shock or becomes a full equity market drawdown. Investors who understand which levers drive the upside and downside scenarios are better positioned to interpret incoming news as either risk-reducing or risk-amplifying.
- Hormuz closure duration: This is the master variable. Citigroup’s $150 forecast only materialises if the disruption persists; Goldman Sachs’ $90 forecast implies resolution. Every diplomatic signal, military development, or ceasefire report moves this needle directly.
- Policy response from the SPR and Federal Reserve: As of 29 April 2026, no confirmed Strategic Petroleum Reserve release or Federal Reserve monetary policy signal tied to the oil shock has been reported. This absence limits the market’s ability to price a cushion against further escalation.
- The six-month gasoline threshold window: The historical data showing an average 11% S&P 500 decline following $4-plus gasoline weeks defines the risk period. That clock is now running.
| Variable | Closure resolves soon | Closure extends for months |
|---|---|---|
| Brent crude price | Falls toward $80-$90 (Goldman base case) | Rises toward $150-$180 (Morgan Stanley worst case) |
| S&P 500 implication | Earnings-driven rally may hold | Historical 11% decline risk elevated; recession risk rises |
| GDP impact | No growth in 2026, per Zandi | Drag of 0.5%-1.5%; recession probability increases |
A rally built on unresolved foundations
The S&P 500 sits at record highs near 7,000. Every material risk indicator identified in this analysis, the Hormuz closure, $112 oil, $4.25 gasoline, two-thirds of reporting companies flagging energy costs, and Moody’s Zandi projecting no growth even in the best case, remains live and unresolved.
Three forward-looking variables merit close monitoring: the Hormuz closure status, the presence or absence of a policy cushion from the Strategic Petroleum Reserve or Federal Reserve, and the six-month gasoline threshold clock that began this week.
Strong earnings are real. They do not, however, neutralise geopolitical supply shocks. What history shows is that the damage from sustained energy costs tends to arrive with a lag, not all at once. The S&P 500’s recovery has been a story of corporate profits outrunning macro risk. Whether that can continue for another quarter depends almost entirely on what happens in a 50-kilometre stretch of water between Iran and Oman.
This article is for informational purposes only and should not be considered financial advice. Investors should conduct their own research and consult with financial professionals before making investment decisions. Past performance does not guarantee future results. Financial projections are subject to market conditions and various risk factors.