Washington Charges 38 Entities in $10M AI Crypto Fraud Sweep
7 hrs ago

Crude oil prices surged above $100 per barrel in April 2026, capping a two-month climb that began when coordinated U.S.-Israeli strikes against Iran on 28 February triggered the largest supply disruption in the history of global oil markets. American drivers now pay over $4 per gallon at the pump for the first time since August 2022, while inflation has spiked to 3.3% and the Federal Reserve has shelved rate cut expectations for the year. The crisis centres on the Strait of Hormuz, where Iranian retaliation and mine deployments have choked off the waterway through which 20-25% of the world’s seaborne oil historically flowed, leaving analysts divided on whether prices will moderate toward $88 by year end or spike past $115 if the fragile ceasefire collapses.
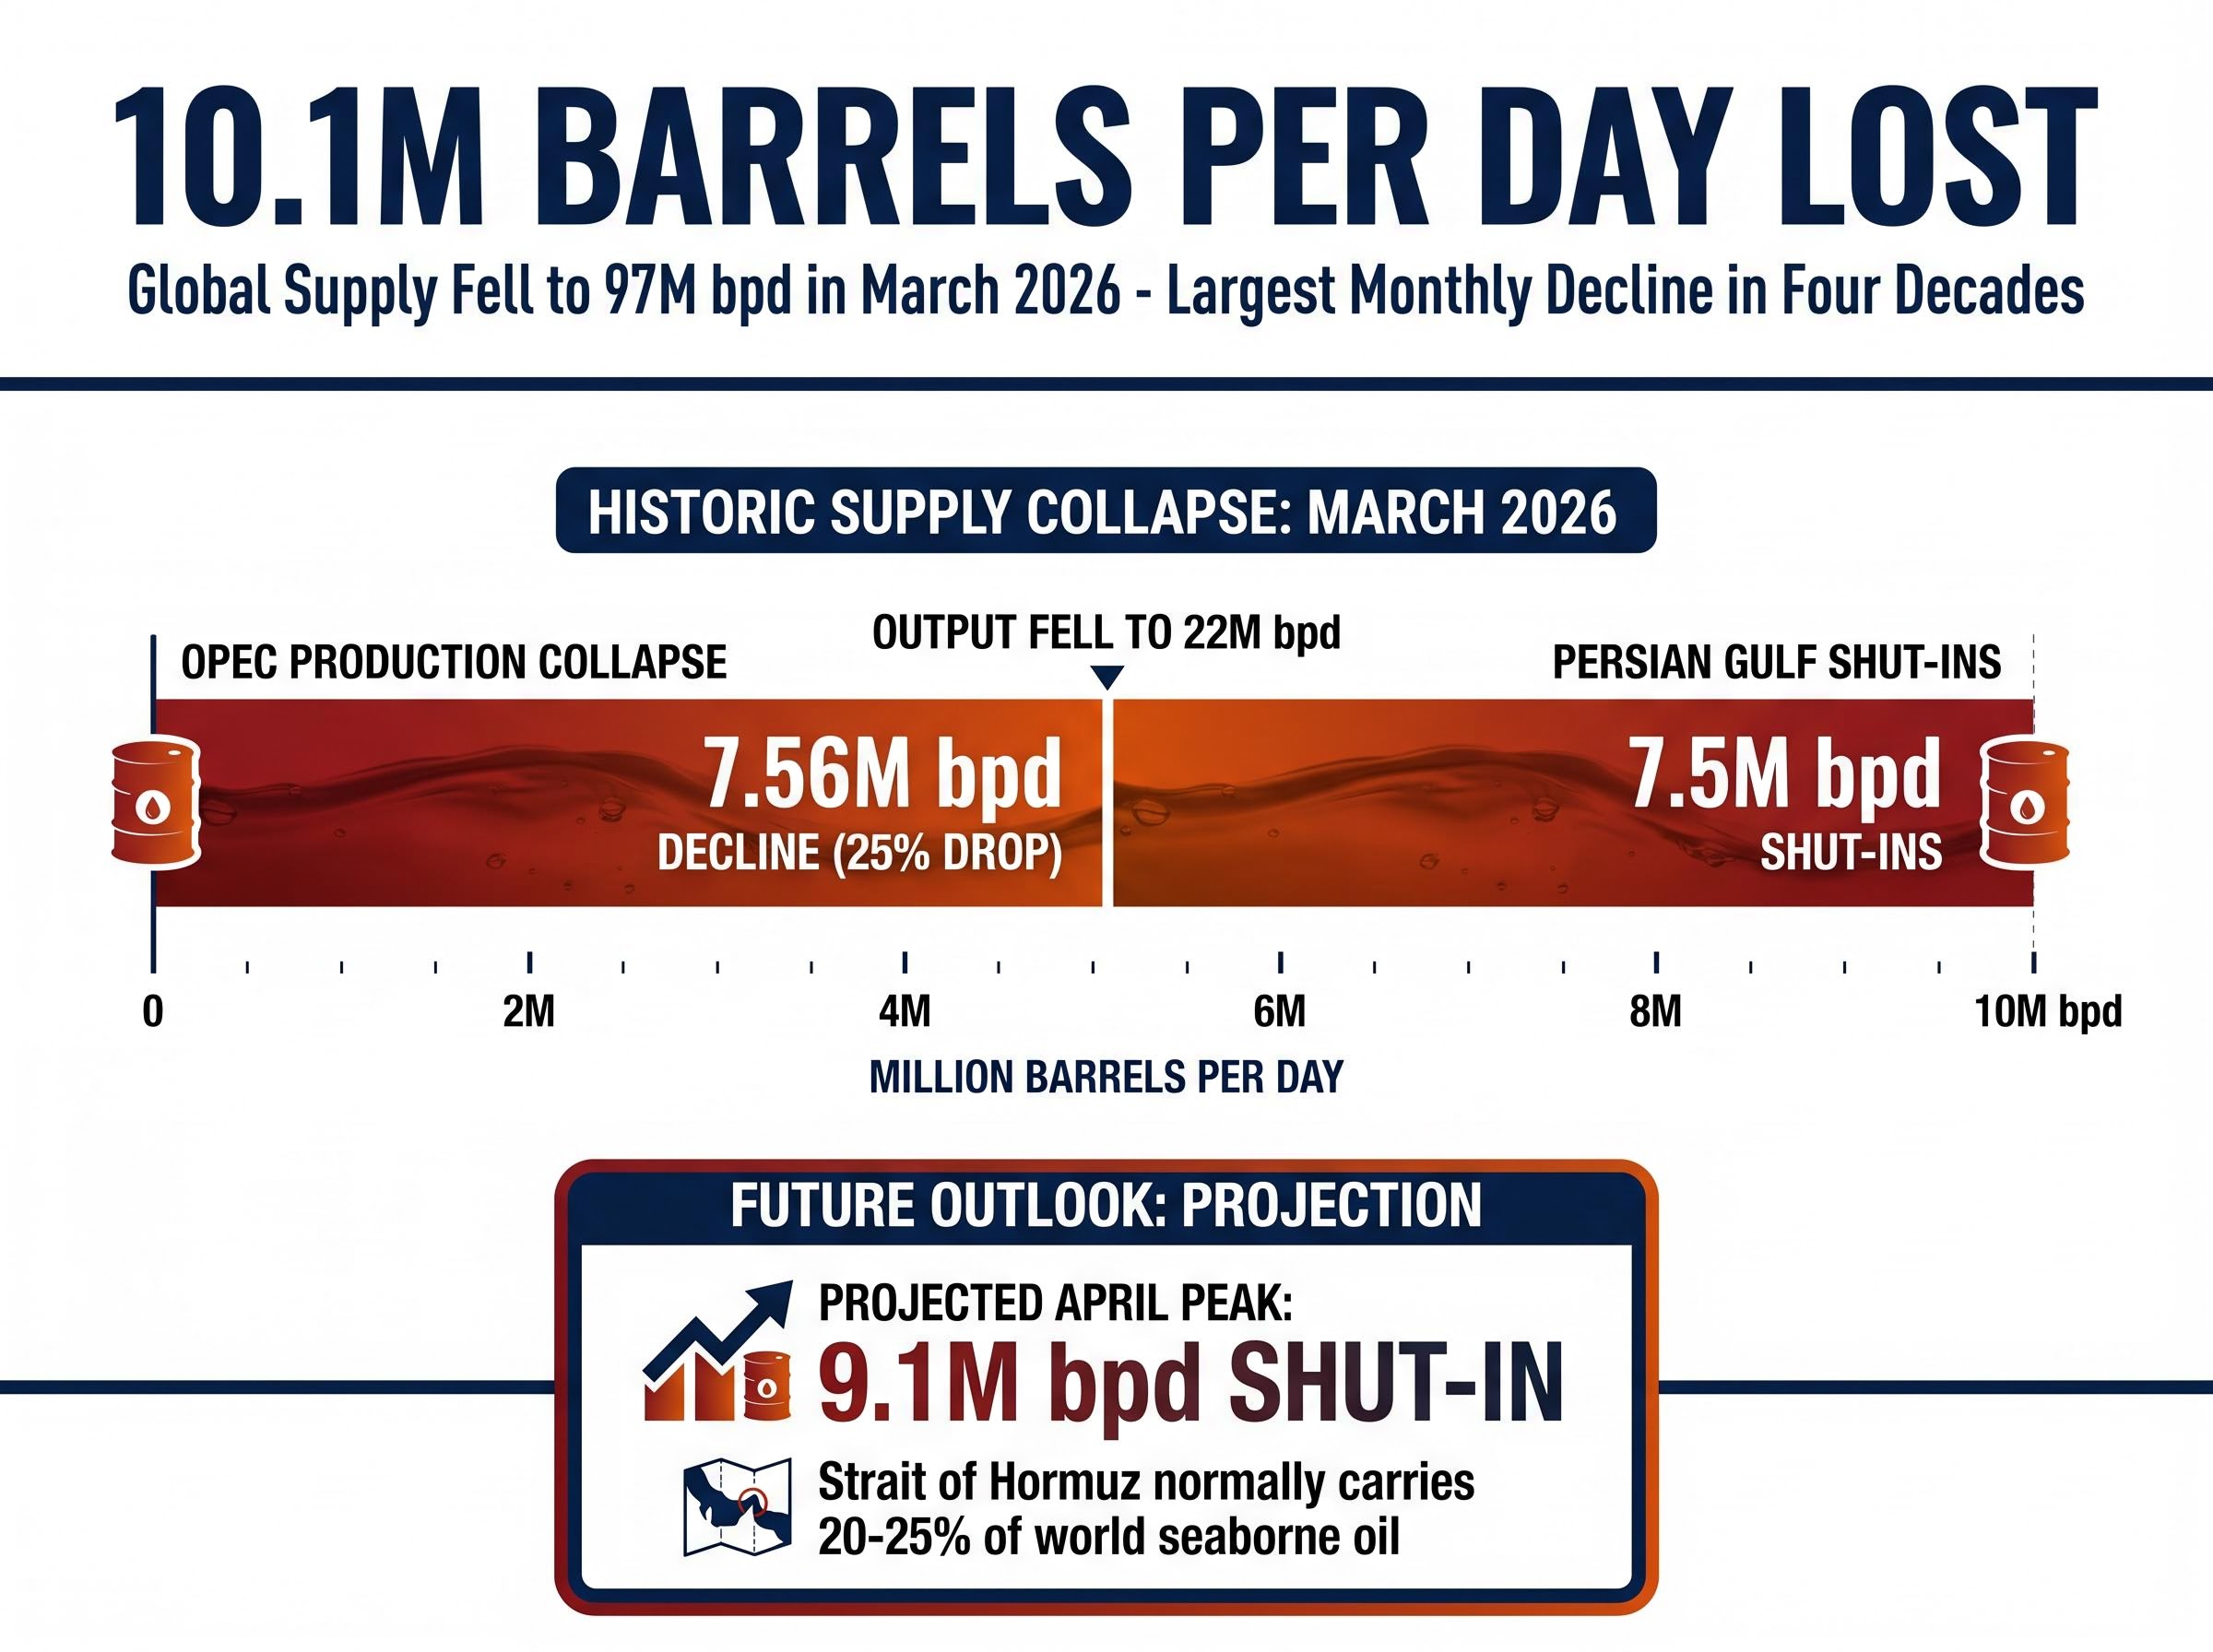
Global oil supply fell by 10.1 million barrels per day to 97 million barrels per day in March 2026, the single largest monthly decline in at least four decades.
The IEA April 2026 Oil Market Report on global supply disruption documented the 10.1 million barrel per day supply collapse in March and confirmed that Strait of Hormuz flows dropped from over 20 million barrels per day to 3.8 million barrels per day, quantifying the scope of the bottleneck that has driven prices above $100 per barrel.
The disruption began on 28 February when the United States and Israel launched Operation Epic Fury, striking Iranian military facilities, nuclear sites, and leadership structures. Iran’s Islamic Revolutionary Guard Corps responded within hours, launching missile and drone attacks against Israel, U.S. military bases, and Gulf state allies while issuing warnings forbidding passage through the Strait of Hormuz. By early March, Iranian forces had deployed mines in the strait and attacked commercial vessels, effectively closing the waterway to shipping. At least 21 confirmed attacks on commercial vessels followed.
The Strait of Hormuz closure driving U.S. inflation from 2.4% in February to 3.3% in March represents the most direct transmission channel between a single chokepoint disruption and household purchasing power in modern history, with gasoline prices surging 37% in seven weeks.
International Energy Agency Assessment “The March 2026 supply decline represents the largest monthly drop in four decades, surpassing even the 1973 Arab oil embargo in absolute terms.”
The cascade through energy markets was immediate. OPEC production collapsed by 7.56 million barrels per day in March, a 25% drop bringing total output down to 22 million barrels per day. Major Persian Gulf producers shut in 7.5 million barrels per day of crude as storage facilities filled to capacity and export routes closed.
Key escalation milestones unfolded across March and April:
Production shut-ins averaged 7.5 million barrels per day in March and were projected to peak at 9.1 million barrels per day in April before potentially declining only if the strait gradually reopened. The ceasefire negotiations remained fundamentally stalled, with Iranian officials demanding the U.S. naval blockade be lifted as a precondition for talks, whilst Trump administration officials insisted Iran must abandon nuclear enrichment as a threshold condition for ending military operations.
Brent crude closed around $102.60 per barrel on 23 April, down from a peak of approximately $128 in early April but still sharply elevated from the $81 level at which the benchmark began 2026. WTI crude traded at $97.14, reflecting the market’s sensitivity to every diplomatic headline and military development.
The price trajectory tells the story of escalation and tentative de-escalation. When the ceasefire was announced on 8 April, Brent moderated from its peak. When the U.S. Navy seized the Iranian tanker on 19 April and Iran retaliated by seizing two container ships three days later, prices firmed again. The extended ceasefire deadline of 27 April offered modest relief, but traders remained sceptical that meaningful resolution was imminent.
When the ceasefire was announced on 8 April, Brent moderated from its peak. When the U.S. Navy seizure of the Iranian tanker on 19 April and Iran’s retaliatory seizure of two container ships three days later demonstrated how fragile the diplomatic progress remained, prices firmed again.
| Benchmark | Price (23 April) | 2026 Start | April Peak |
|---|---|---|---|
| Brent Crude | $102.60 | $81.00 | $128.00 |
| WTI Crude | $97.14 | ~$76.00 | ~$122.00 |
Goldman Sachs trimmed its Q2 Brent forecast to $90 per barrel following the initial ceasefire announcement, but maintained a severe-case scenario in which persistent Middle East production losses of 2 million barrels per day could push Brent to an average of $115 per barrel in Q4 2026.
Goldman Sachs Severe-Case Scenario If the ceasefire fails and production losses reach 2 million barrels per day on a sustained basis, Brent crude could average $115 per barrel in Q4 2026, with potential spikes to $120 in Q3 if the Strait of Hormuz remains mostly closed for another month.
The Energy Information Administration forecast Brent averaging $115 in Q2, moderating to $88 by Q4 assuming gradual resumption of traffic through the strait but not a return to pre-conflict flows until late 2026. Analyst forecasts for 2026 Brent ranged from $60 per barrel (J.P. Morgan) to $130-160 (LongForecast), demonstrating the extraordinary uncertainty tied to geopolitical outcomes.
The national average price for regular unleaded petrol stood at $4.031 per gallon as of 23 April, up from $2.98 on 27 February before the Iran strikes. A 15-gallon fill-up now costs approximately $60, compared to $45 in February.
The University of Michigan’s Consumer Sentiment Index plummeted to a record low of 47.6 in early April as drivers absorbed the shock at the pump. One-year consumer inflation expectations spiked to 4.8% from 3.8%, reflecting concerns that fuel costs would remain elevated regardless of ceasefire developments.
Three channels transmit higher oil costs to American households:
Analysts predicted petrol could average $4.30 per gallon for April and $3.70+ for the full year if crude prices remained elevated. However, by late April, prediction markets suggested sentiment that prices had peaked, partly due to the ceasefire and partly due to demand moderation as consumers adapted to higher costs. National petrol demand dropped from 8.68 million barrels per day to 8.56 million barrels per day in mid-April.
Diesel prices, critical for logistics and freight, were forecast to peak above $5.80 per gallon in April and average $4.80 for the year. Trucking rates jumped 16-17% year over year, with fuel now representing approximately $0.87 of every mile’s expense as diesel averaged $5.86 per gallon.
This cost shock reverberated through the economy, raising retail prices and squeezing logistics efficiency. The lag between crude oil purchases and refined product delivery meant that even if the conflict resolved immediately, pump prices would remain elevated until supplies of $100+ crude worked through the refining and distribution system.
March 2026 U.S. Consumer Price Index data rose 3.3% year over year, up from 2.4% in February, marking the sharpest annual jump since mid-2024. Month-over-month prices rose 0.9%, the steepest increase in nearly four years.
Gasoline alone surged 21.2% in March, contributing nearly three-quarters of the overall monthly CPI increase.
March 2026 CPI Monthly Increase The 0.9% month-over-month CPI rise in March 2026 represents the steepest increase in nearly four years, driven predominantly by energy costs.
The Federal Reserve faced constrained policy options as energy-driven inflation threatened progress toward the 2% target. Markets that had priced in two rate cuts for 2026 at the year’s start quickly swung to no cuts expected as of late April, with the fed funds rate likely to be held at 3.6%. Some Fed officials floated the prospect of a rate hike if energy shocks proved persistent, though March core inflation (2.6%) remained only slightly above February’s 2.5%, suggesting underlying inflation pressures were stable for the moment.
Markets that had priced in two rate cuts for 2026 at the year’s start quickly swung to no cuts expected as of late April, with oil prices above $100 per barrel eliminating Fed rate cut expectations and the fed funds rate likely to be held at 3.6%.
Federal Reserve Governor Waller’s April 2026 speech on energy-driven inflation outlined the central bank’s scenarios for the Strait of Hormuz reopening timeline and acknowledged that the 3.3% CPI reading complicated the path back to the 2% target, particularly if core inflation began absorbing energy cost pressures.
Factors constraining Federal Reserve policy included:
The San Francisco Fed projected 2% inflation would not return until mid-2028, whilst markets assigned zero probability to rate cuts in 2026. The shift from two expected cuts to zero cuts in less than two months illustrated how rapidly the energy crisis had altered the macroeconomic trajectory.
Whilst consumers absorbed higher costs, energy sector equities delivered substantial gains. The Energy Select Sector SPDR ETF (XLE) rose 1.2% to close at $56.54 on 22 April 2026, capping a strong year-to-date performance for the sector.
Major integrated producers led the rally:
ExxonMobil reported record Q4 2025 results with earnings per share of $1.71, production of 4.7 million barrels of oil equivalent per day, and free cash flow exceeding $26 billion. The company raised its dividend by 4% and maintained dividend coverage of 3.0x, notably higher than Chevron’s 1.3x, suggesting better resilience if prices moderate.
Energy Sector Earnings Growth Revision Expected energy sector earnings growth for Q1 2026 was revised up to 7.6% from 0.9% a week prior, whilst full-year 2026 energy sector earnings growth was revised up to 16.3%, reflecting the sustained elevation in crude prices and strengthening refining margins.
Chevron reported earnings per share of $1.52 and $16.6 billion in free cash flow for Q4 2025, also raising its dividend by 4%. Both firms benefited from elevated realisations on production and strong downstream margins as refined product prices rose faster than crude.
The U.S. production response remained limited despite high prices. The Energy Information Administration projected only modest output gains of 370,000 barrels per day in 2026 and 580,000 barrels per day in 2027, constrained by drilling-to-production lags, industry consolidation, and more cautious capital allocation compared to previous price cycles. Domestic supply could not quickly offset the global shortfall created by the Strait of Hormuz closure.
For investors exploring how to position portfolios during sustained crude price elevation, our dedicated guide to energy stock positioning at elevated oil prices walks through integrated major selection criteria, leveraged producer risk-return profiles, and sector allocation frameworks across different price and ceasefire scenarios.
The extended ceasefire deadline of 27 April 2026 represents the most critical near-term catalyst for oil price direction. Peace talks remained stalled as of 23 April, with the United States and Iran far apart on core issues.
The U.S. and OECD nations released 172 million barrels from the Strategic Petroleum Reserve, with plans for up to 30 million barrels in emergency exchange as part of the largest global coordinated release in history (400 million barrels total). However, with 9.1 million barrels per day of production offline at the April peak, even 30 million barrels would cover less than four days of global shortfall, highlighting the limits of reserve interventions in offsetting sustained disruption.
Enverus Intelligence estimated that each lost month of Strait of Hormuz traffic added $10-15 per barrel to world oil prices, illustrating the sensitivity of the market to the duration of the closure.
Three key indicators to watch for price direction:
The scenario spectrum ranged from rapid resolution (Brent falling toward $60-70 per barrel if the strait fully reopened and production normalised) to prolonged closure (Brent spiking toward $115-160 if the ceasefire collapsed and the disruption extended into Q3 2026). The wide range of analyst forecasts underscored that price direction hinged almost entirely on geopolitical developments rather than market fundamentals, making diplomatic headlines essential reading for anyone tracking energy costs or inflation trajectories.
The oil price surge above $100 per barrel reflects the largest supply disruption in modern history, with the Strait of Hormuz blockade removing nearly 10% of global supply following U.S.-Israeli military action against Iran in late February 2026. American consumers are feeling the impact through petrol prices above $4 per gallon and inflation rising to 3.3%, whilst the Federal Reserve finds its policy options constrained by energy-driven price pressures.
Whether prices moderate toward $88 by year end or spike toward $115 or higher depends almost entirely on whether the fragile U.S.-Iran ceasefire holds beyond the extended 27 April deadline and maritime traffic resumes through the strait. Readers tracking energy markets and household budgets should watch ceasefire developments and any signs of shipping lane reopening as the most critical near-term signals for price direction.
This article is for informational purposes only and should not be considered financial advice. Investors should conduct their own research and consult with financial professionals before making investment decisions.
The oil price surge is driven by military conflict and disruption in the Strait of Hormuz following U.S.-Israeli strikes on Iran, which led to a significant reduction in global oil supply.
Elevated oil prices have boosted energy sector equities, with major producers like ExxonMobil and Chevron seeing substantial year-to-date gains and higher earnings growth forecasts.
The closure of the Strait of Hormuz removed a key supply route for 20-25% of the world's seaborne oil, causing the largest monthly oil supply drop in at least four decades.
If the fragile ceasefire holds and shipping resumes, oil prices may moderate; if it collapses, prices could spike further, with forecasts ranging from $88 to $160 per barrel depending on geopolitical developments.
Investors should monitor ceasefire progress, oil supply indicators, and energy stock performance, considering portfolio adjustments in response to continued volatility and evolving geopolitical risks.