
Why Orion Stock Fell 4.3% Despite 47% Profit Growth in Q1
5 mins ago

The Strait of Hormuz carries roughly 20 million barrels of petroleum liquids every day under normal conditions. That flow has stopped for nearly all commercial shipping. The disruption began approximately seven weeks ago when U.S. and Israeli military operations against Iran triggered the most severe energy supply shock in modern history. American consumers are already feeling the effects: gasoline prices have jumped from under $3.00 per gallon to $4.11.
This explainer breaks down exactly how a waterway closure 7,000 miles from U.S. shores translates into higher prices at grocery stores, changed Federal Reserve calculations, and uncertainty in retirement portfolios. The strait’s closure is not a temporary blip. It is a sustained disruption with cascading effects across energy markets, inflation trajectories, monetary policy, and equity valuations.
The Strait of Hormuz is a narrow passage between Iran and Oman connecting the Persian Gulf to the Gulf of Oman and the broader ocean. At its narrowest point, the strait measures just 21 miles wide. That geographic chokepoint controls the flow of oil from some of the world’s largest producers.
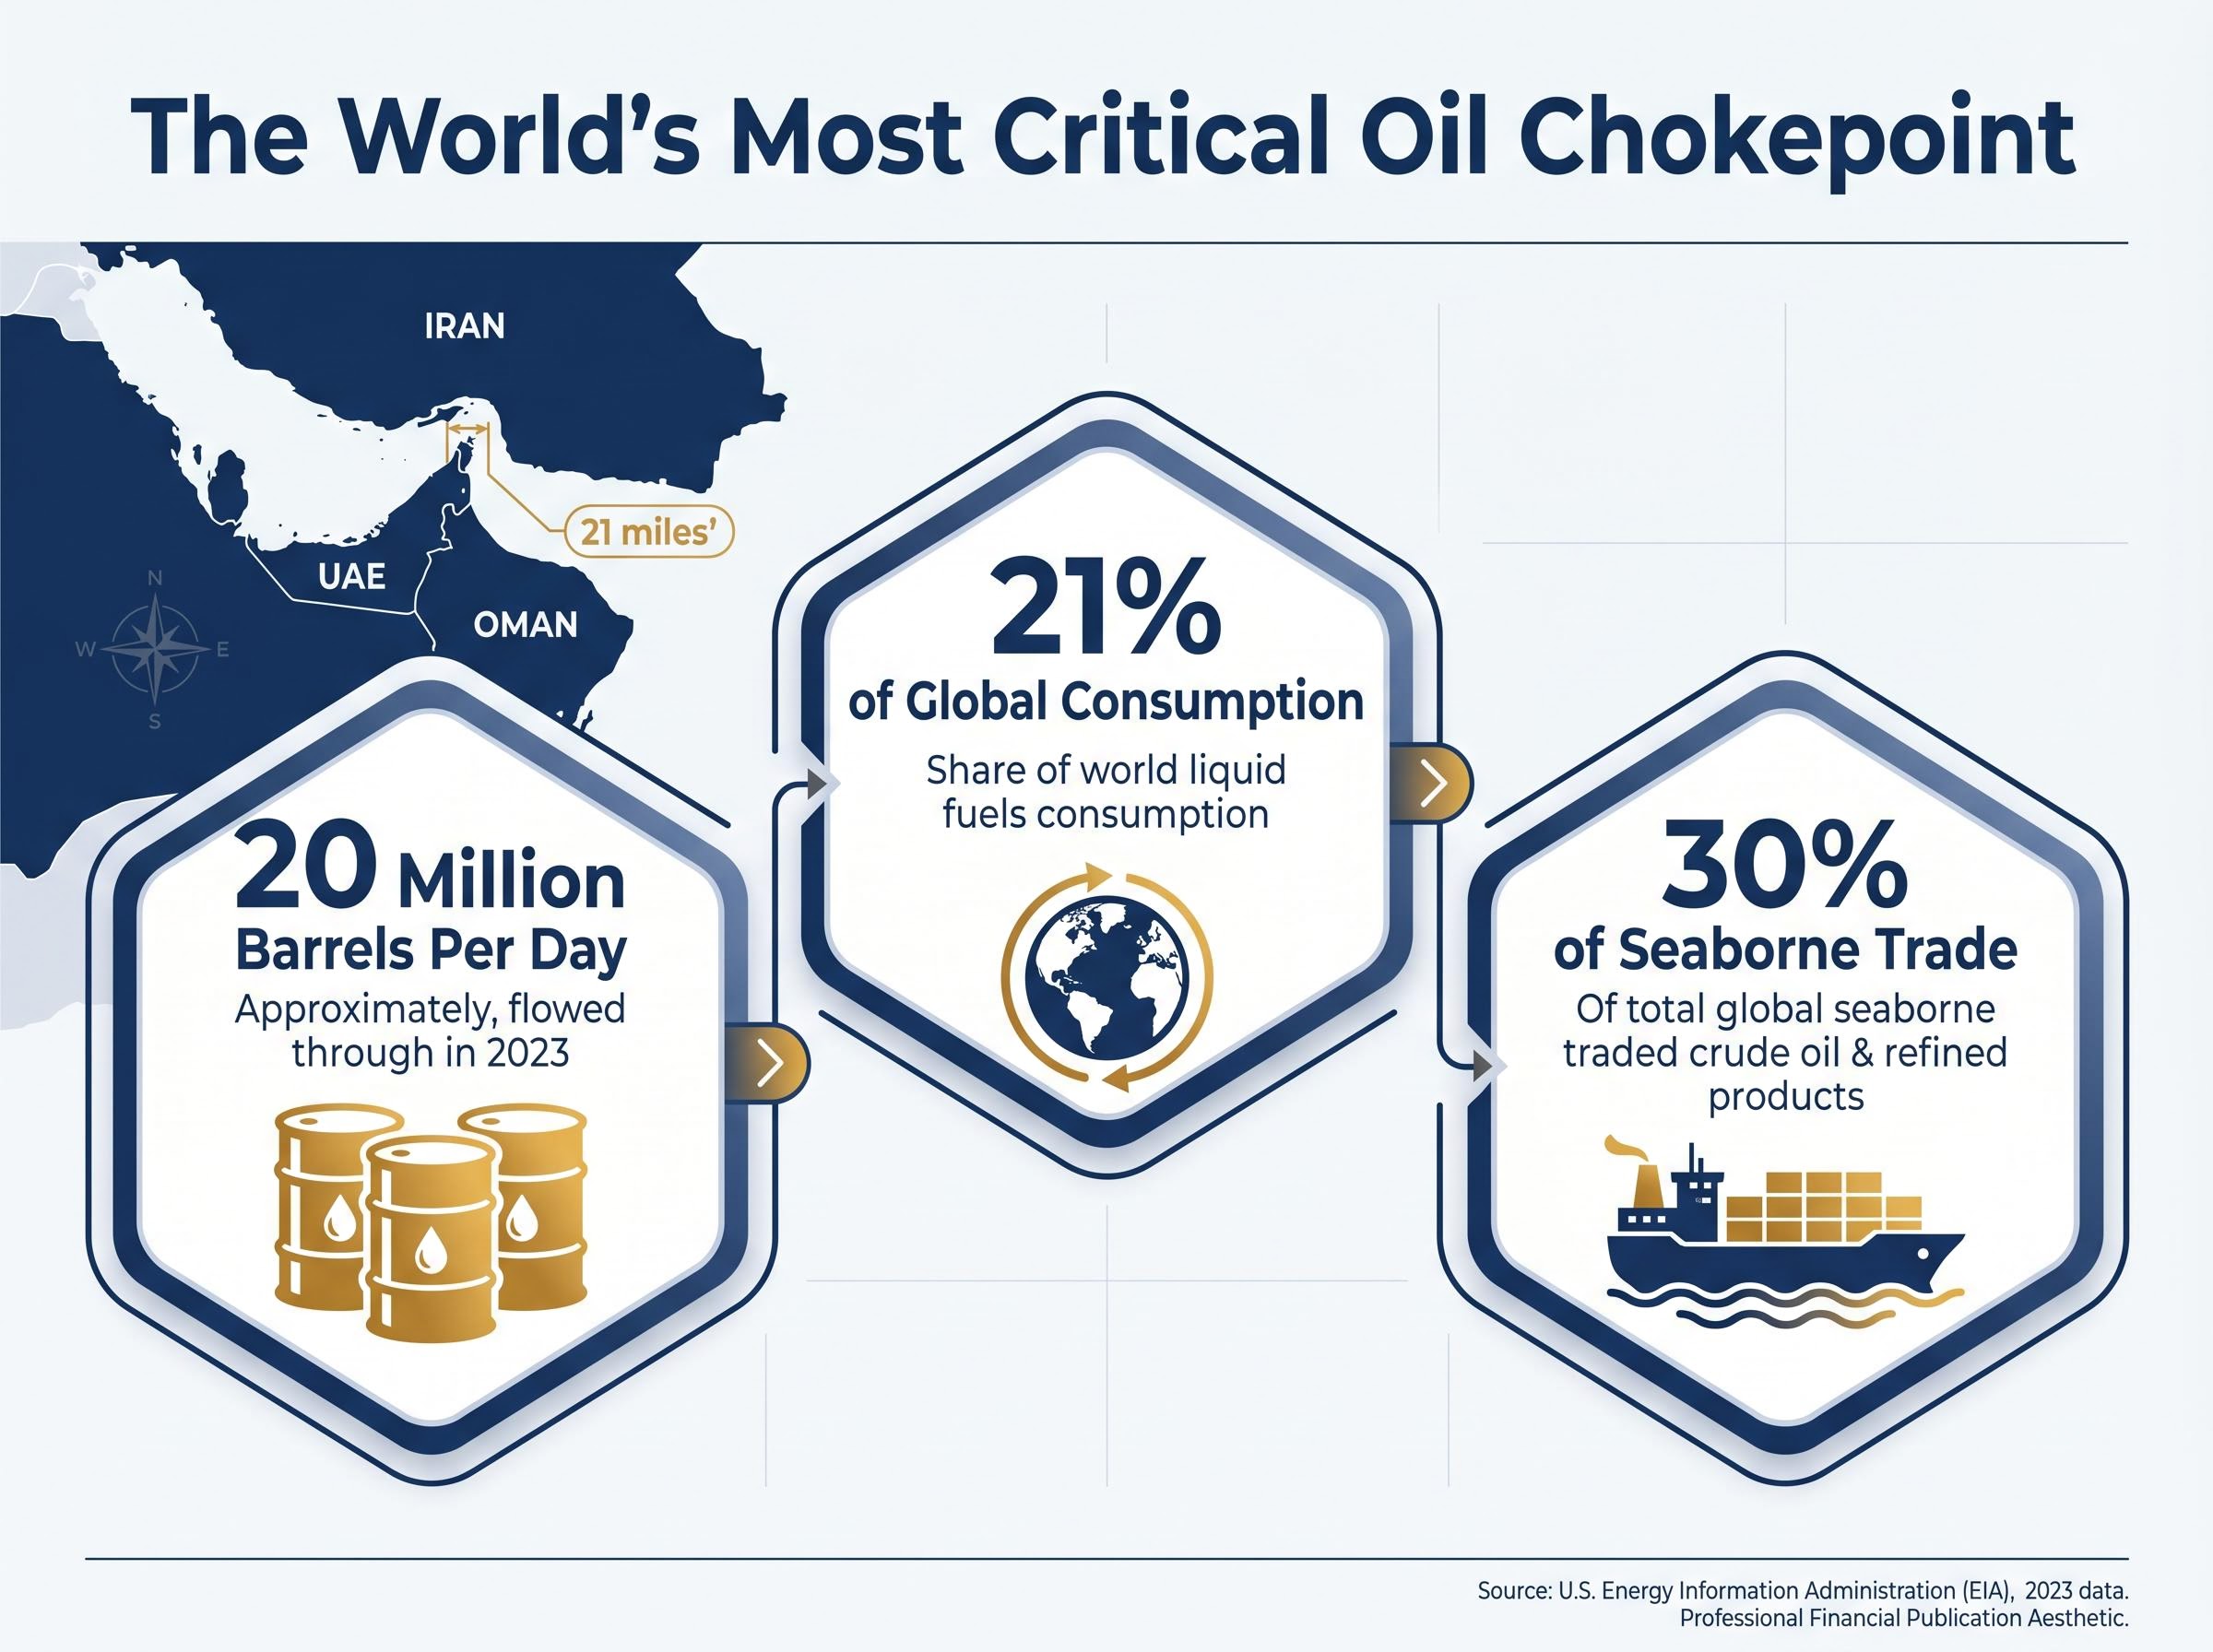
Roughly 20 million barrels of petroleum liquids transit the strait daily. This includes crude oil, condensates, and refined products, each with different downstream uses. The volume represents approximately 21% of global petroleum liquids consumption and 30% of all seaborne oil trade.
The EIA’s 2023 analysis of Strait of Hormuz transit volumes reports that 21 million barrels per day flowed through the chokepoint in 2022, accounting for more than one-quarter of total global seaborne traded oil, figures that establish the scale of disruption when that flow stops.
20 million barrels per day transit the Strait of Hormuz under normal conditions, making it the world’s most critical oil chokepoint.
Five major oil-producing nations rely on the strait as their primary export route:
Understanding the physical bottleneck helps readers grasp why this disruption cannot be easily rerouted or quickly resolved. Unlike supply issues in regions with pipeline alternatives, the Persian Gulf’s geography offers no comparable outlet. Tankers either pass through the strait, or the oil does not reach global markets.
The transmission chain from a tanker stuck in the Persian Gulf to the price of milk in Minnesota follows a predictable sequence. Higher crude prices raise gasoline and diesel costs. Consumers pay those increases immediately at the pump. That is the direct channel.
The indirect channel operates through freight and production costs. Diesel powers trucks, trains, and agricultural equipment. When diesel prices rise, transportation costs increase across all goods. Businesses face margin compression or must pass higher input costs to consumers. This is the cost-push inflation mechanism: supply shocks raise production expenses, and those expenses flow through to shelf prices.
The cost-push inflation mechanism operates when supply shocks raise production expenses across industries, forcing businesses to choose between margin compression and price increases; in the current environment, elevated diesel and freight costs are pushing toward the latter outcome across food, manufactured goods, and transportation-dependent services.
The national average gasoline price reached $4.11 per gallon on 15 April 2026. That compares to under $3.00 per gallon before the conflict began seven weeks earlier. The increase represents a 37% jump in a matter of weeks.
Diesel price increases have been even more pronounced than gasoline. Commercial operators, freight companies, and agricultural producers are absorbing elevated fuel costs that either compress margins or require price adjustments downstream.
Freight costs rise when diesel prices climb. Trucking companies renegotiate shipping rates. Rail operators adjust fuel surcharges. Agricultural producers face higher costs for planting, harvesting, and transporting crops to market.
Businesses respond in one of two ways: absorb the cost and accept lower margins, or raise prices and pass the burden to consumers. In an environment where input costs are climbing across the board, the latter becomes the prevailing response. The result is broader inflation across food, manufactured goods, and services that rely on transportation networks.
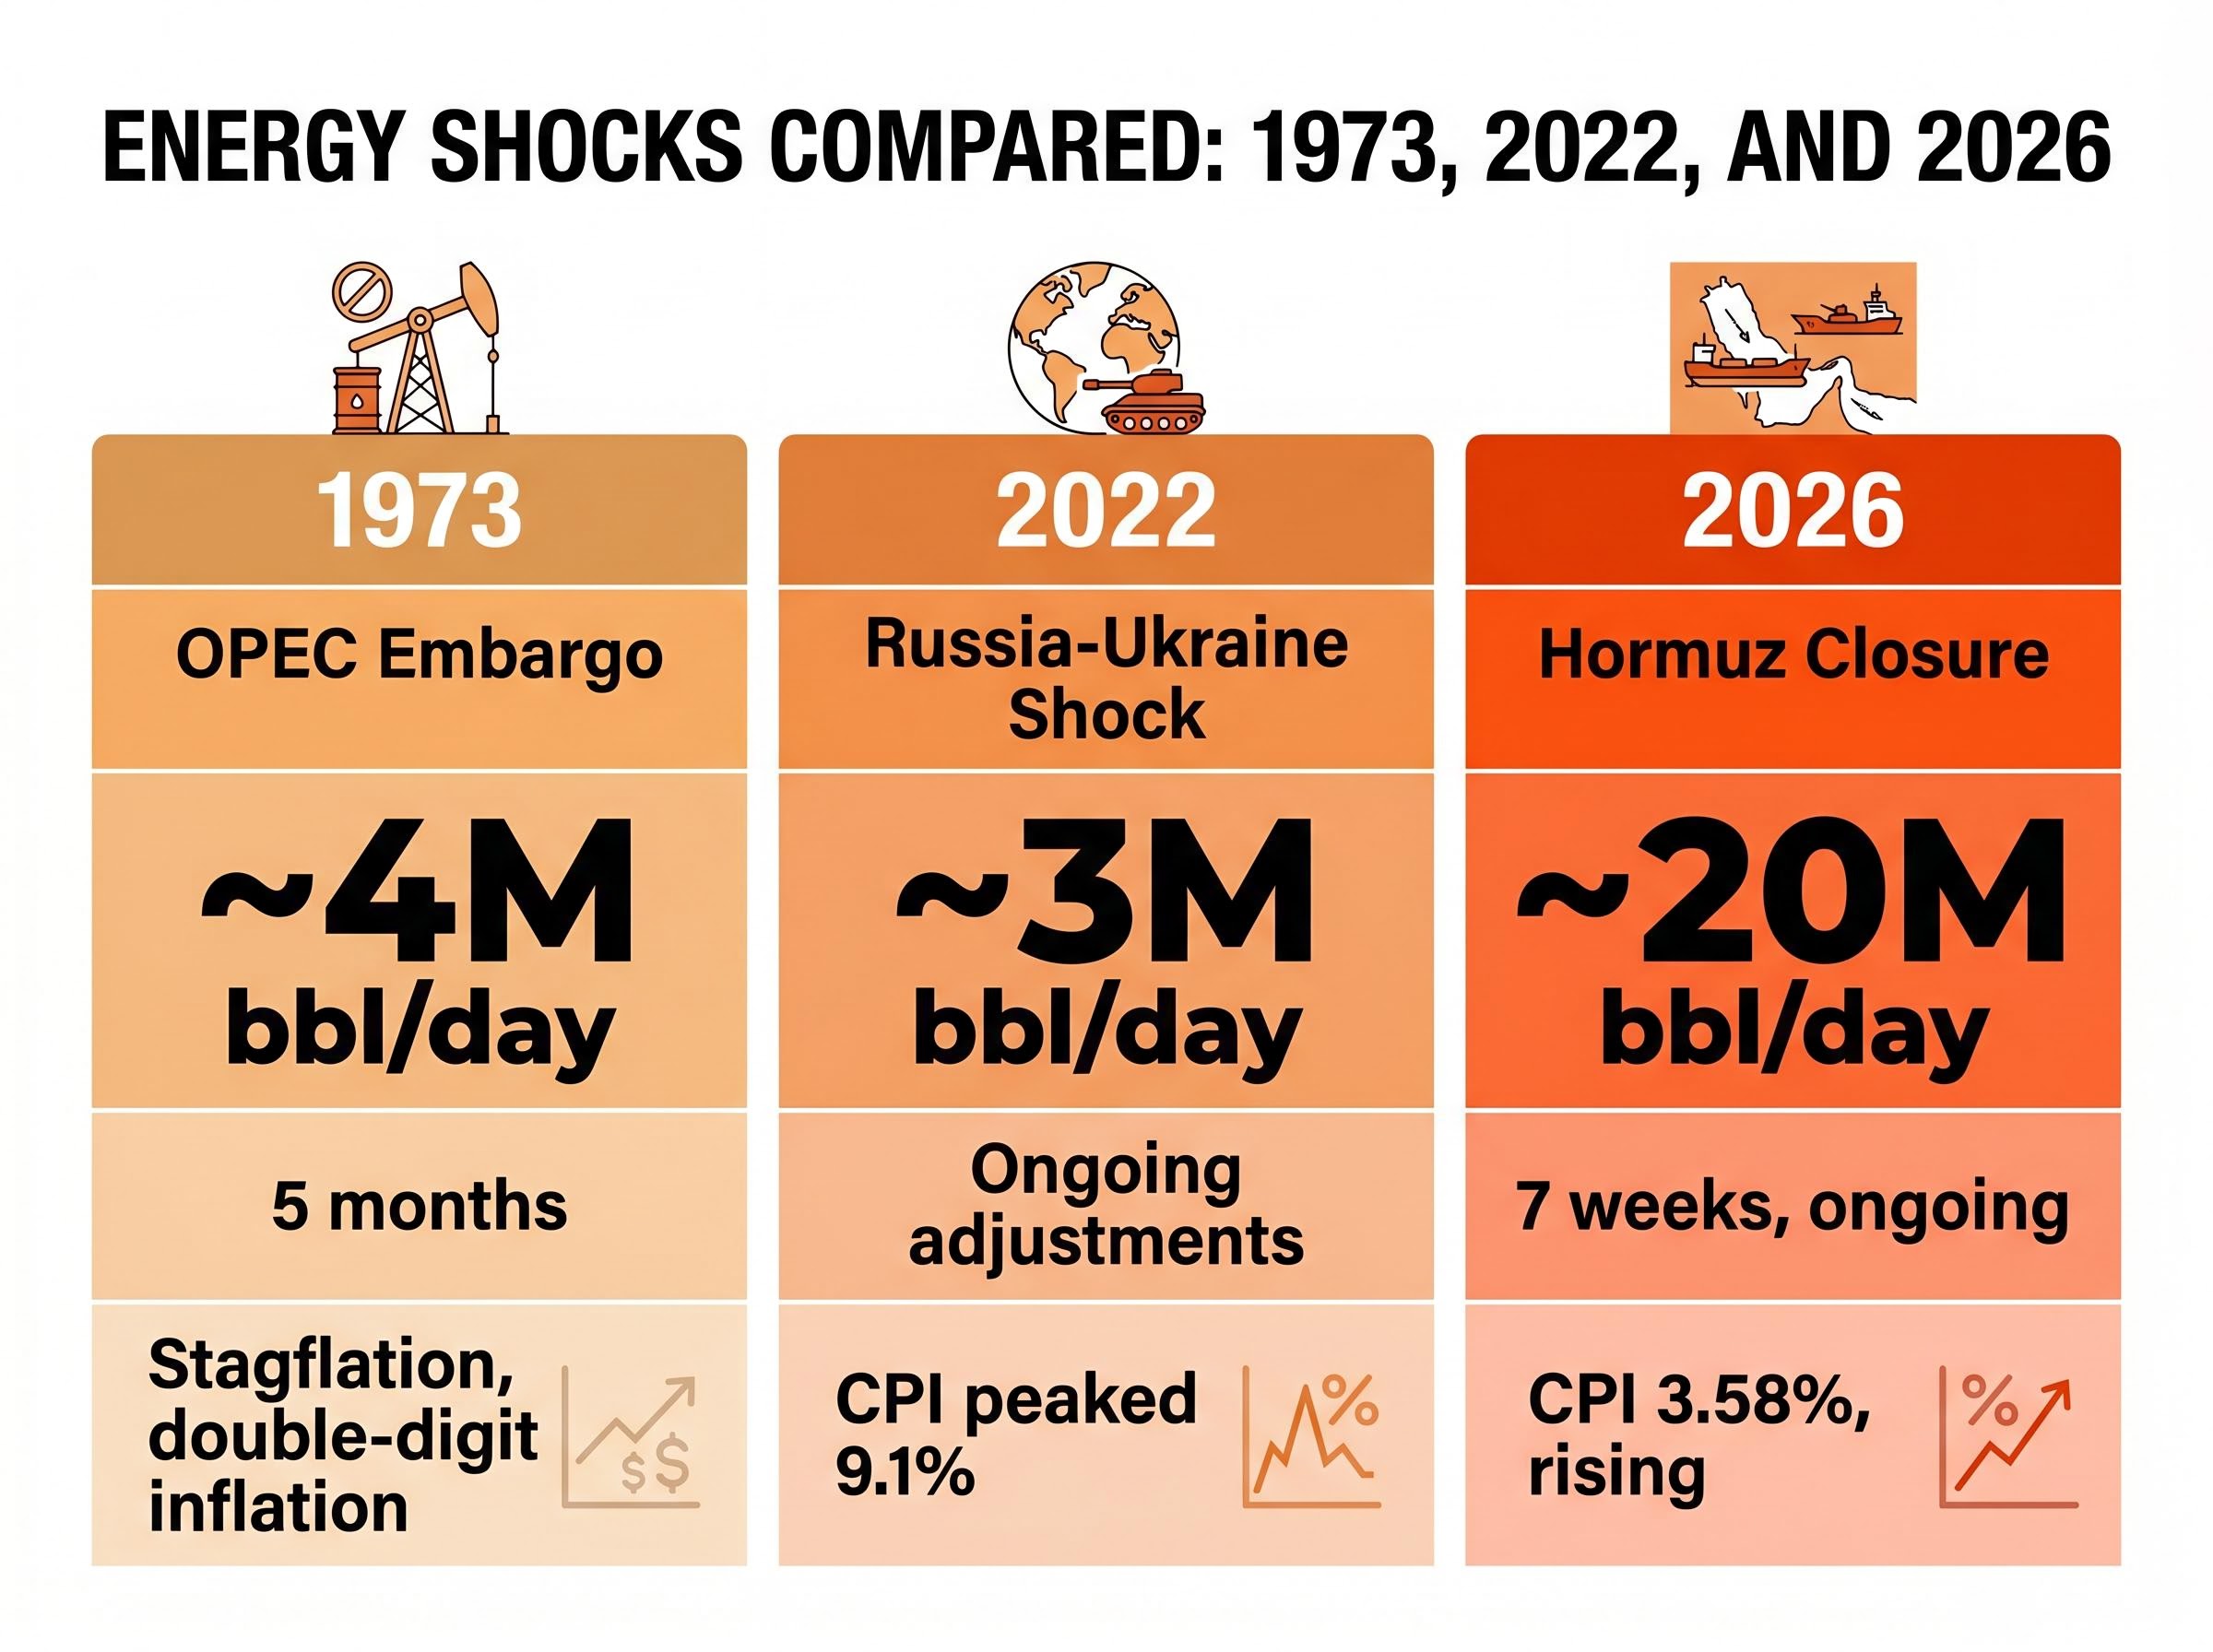
The 1973 OPEC embargo remains the most commonly cited energy shock precedent. Arab oil-producing nations halted exports to the United States and other Western countries in retaliation for support of Israel during the Yom Kippur War. The embargo lasted approximately five months and triggered stagflation: high inflation combined with economic stagnation.
The 2022 energy shock from the Russia-Ukraine conflict provides a more recent comparison. European natural gas prices surged as Russian supplies were curtailed. Oil prices climbed above $120 per barrel. Supply chain disruptions spread across energy-dependent industries.
The April 2026 Strait of Hormuz closure exceeds both precedents in scale. The volume affected is larger, the chokepoint is singular, and diversification options are limited. Modern factors such as renewable energy adoption and strategic petroleum reserves provide some cushion, but they cannot offset a disruption of this magnitude.
| Event | Trigger | Volume Affected | Duration | U.S. Inflation Outcome |
|---|---|---|---|---|
| 1973 OPEC Embargo | Geopolitical retaliation | ~4 million barrels/day | 5 months | Stagflation, double-digit inflation |
| 2022 Russia-Ukraine Shock | Military conflict, sanctions | ~3 million barrels/day (Russian exports) | Ongoing supply adjustments | CPI peaked at 9.1% (June 2022) |
| 2026 Strait of Hormuz Closure | U.S.-Israeli operations against Iran | ~20 million barrels/day | 7 weeks and ongoing | CPI at 3.58% and rising |
Historical parallels help readers calibrate expectations. Understanding that this exceeds prior shocks prepares them for the possibility that economic effects may also exceed historical precedent. The 1973 embargo affected a smaller share of global oil trade. The 2022 shock involved a single supplier with alternative sources available. The Strait of Hormuz closure removes 20 million barrels per day from a global market consuming roughly 100 million barrels daily.
The March 2026 Consumer Price Index reading came in at 3.3% on a trailing 12-month basis. That represents a 90-basis-point jump from February’s reading. The acceleration is directly attributable to energy price increases flowing through the economy.
The 90-basis-point monthly jump in CPI from February to March 2026 marks one of the sharpest single-month accelerations outside of pandemic-era distortions.
The Cleveland Federal Reserve’s Inflation Nowcasting model tracks CPI expectations in real time. The progression over two weeks in early April tells the story:
The trajectory matters because the Federal Reserve’s 2% inflation target is now nearly 160 basis points away. The gap removes justification for rate cuts. Market participants had been pricing in potential monetary easing based on hope that energy-driven inflation would prove temporary. The Cleveland Fed’s own nowcasting suggests that “temporary” may be wishful thinking.
Inflation data drives Federal Reserve decisions, which in turn drive borrowing costs for mortgages, car loans, and business expansion. Readers with variable-rate debt or plans to borrow should understand why rate cuts have become unlikely. The Fed’s dual mandate requires balancing maximum employment with price stability. When inflation runs 160 basis points above target, the price stability objective takes priority.
For readers wanting to understand the complete reversal in Federal Reserve rate expectations, our dedicated guide to how $100 oil killed Fed rate cut expectations for 2026 walks through the shift from pricing in two cuts at the start of 2026 to the current 73% probability of no cuts, with specific market pricing data and FOMC signaling analysis.
Market participants entered 2026 expecting the Federal Reserve to deliver rate cuts. Equity valuations reflected that expectation alongside optimism about artificial intelligence-driven earnings growth. The Strait of Hormuz closure has disrupted that narrative.
The Federal Reserve now faces a dilemma. Holding rates steady may not be enough if inflation persists above 3.5%. Cutting rates while inflation accelerates would signal that the central bank is ignoring its price stability mandate. Raising rates during a supply shock risks deepening economic pain by tightening financial conditions when businesses and consumers are already absorbing higher energy costs.
The Fed’s three options come with distinct constraints:
Federal Reserve Chair Jerome Powell and the Federal Open Market Committee are navigating this constraint in real time. A potential rate hike by the FOMC could derail the ongoing bull market rally. Readers holding equities, bonds, or real estate should understand that the interest rate environment has become more uncertain. The bull market’s continuation depends partly on monetary conditions that are now in question.
U.S. equity indices closed the week of 15 April 2026 at record or near-record levels despite the energy shock. The S&P 500 finished at 7,126.06, up 1.20% for the week. The Dow Jones Industrial Average reached 49,447.43, climbing 1.79%. The Nasdaq Composite hit 24,468.48, gaining 1.52%.
| Index | Closing Price | Weekly Change | Percentage Change |
|---|---|---|---|
| S&P 500 | 7,126.06 | +$84.78 | +1.20% |
| Dow Jones | 49,447.43 | +$868.71 | +1.79% |
| Nasdaq | 24,468.48 | +$365.78 | +1.52% |
Both the S&P 500 and Nasdaq reached fresh all-time peaks during the week. The Dow remained close to its historic high. The rally reflects optimism about swift conflict resolution and continued artificial intelligence-driven earnings growth. Markets are pricing in best-case scenarios: a quick end to the Strait of Hormuz closure, inflation returning to the Fed’s 2% target, and rate cuts resuming.
The U.S. equity market entered 2026 at its second-most-expensive valuation since January 1871 based on the Shiller cyclically adjusted price-to-earnings ratio.
Robert Shiller’s historical CAPE ratio dataset, maintained at Yale and covering U.S. equity valuations from 1871 to the present, is the authoritative source for the cyclically adjusted price-to-earnings metric that shows the current market entering 2026 at its second-most-expensive valuation in 155 years.
The tension is visible. Record prices do not necessarily reflect resolution of underlying risks. The valuation baseline is already stretched. If the conflict extends, inflation persists, and the Federal Reserve holds or raises rates, the disconnect between equity prices and economic fundamentals becomes harder to justify.
The disconnect between equity prices and economic fundamentals becomes harder to justify when the S&P 500 touches record highs during the same week the Cleveland Fed’s inflation nowcast hits 3.58%, a tension that reflects how markets are pricing swift conflict resolution while inflation data suggests a more protracted adjustment path.
Investors should understand that markets are pricing optimistic outcomes while inflation data suggests a bumpier path. The gap between the shock’s severity and the market’s response reveals how investors are currently framing this crisis: as a contained disruption that portfolios can navigate around rather than a structural shift requiring repositioning.
A physical chokepoint closure 7,000 miles from U.S. shores is transmitting through energy prices, inflation readings, and monetary policy to affect American households and portfolios. The Strait of Hormuz carries 20 million barrels of petroleum liquids daily under normal conditions. That flow has stopped for seven weeks. Gasoline prices have climbed 37% to $4.11 per gallon. The Consumer Price Index jumped 90 basis points in a single month and continues climbing.
The Federal Reserve’s options have narrowed. Rate cuts have become unlikely while inflation runs 160 basis points above the 2% target. Equity markets reached record highs on optimism about conflict resolution and AI-driven growth, but the valuation baseline is already stretched. Duration of the conflict and closure remains unknown, and that uncertainty is itself a factor in economic planning.
Stay informed on Federal Reserve statements, Consumer Price Index releases, and conflict developments as the situation evolves. The intersection of energy supply, inflation dynamics, and monetary policy will determine whether the current disruption remains contained or reshapes the economic outlook for the remainder of 2026.
This article is for informational purposes only and should not be considered financial advice. Investors should conduct their own research and consult with financial professionals before making investment decisions.
The Strait of Hormuz is a narrow 21-mile-wide waterway between Iran and Oman that controls roughly 20 million barrels of petroleum liquids per day, representing about 21% of global consumption. When it closes, oil supply shocks ripple through energy prices, inflation, and borrowing costs in the United States.
U.S. national average gasoline prices jumped from under $3.00 per gallon to $4.11 per gallon in approximately seven weeks following the closure, representing a roughly 37% increase driven by the removal of 20 million barrels per day from global supply.
With the Cleveland Fed's inflation nowcast reaching 3.58% in mid-April 2026, the Fed's 2% target is now nearly 160 basis points away, making rate cuts unlikely and leaving the central bank choosing between holding steady, cutting and risking credibility, or raising rates during a supply shock.
Yes, in terms of volume affected: the 1973 OPEC embargo disrupted roughly 4 million barrels per day, while the 2026 Strait of Hormuz closure has halted approximately 20 million barrels per day, five times the volume, with fewer alternative routing options available.
Investors should monitor Federal Reserve statements, monthly Consumer Price Index releases, and conflict developments in the Persian Gulf, as the duration of the closure will determine whether current inflation pressures and equity market valuations remain sustainable or require significant portfolio reassessment.


