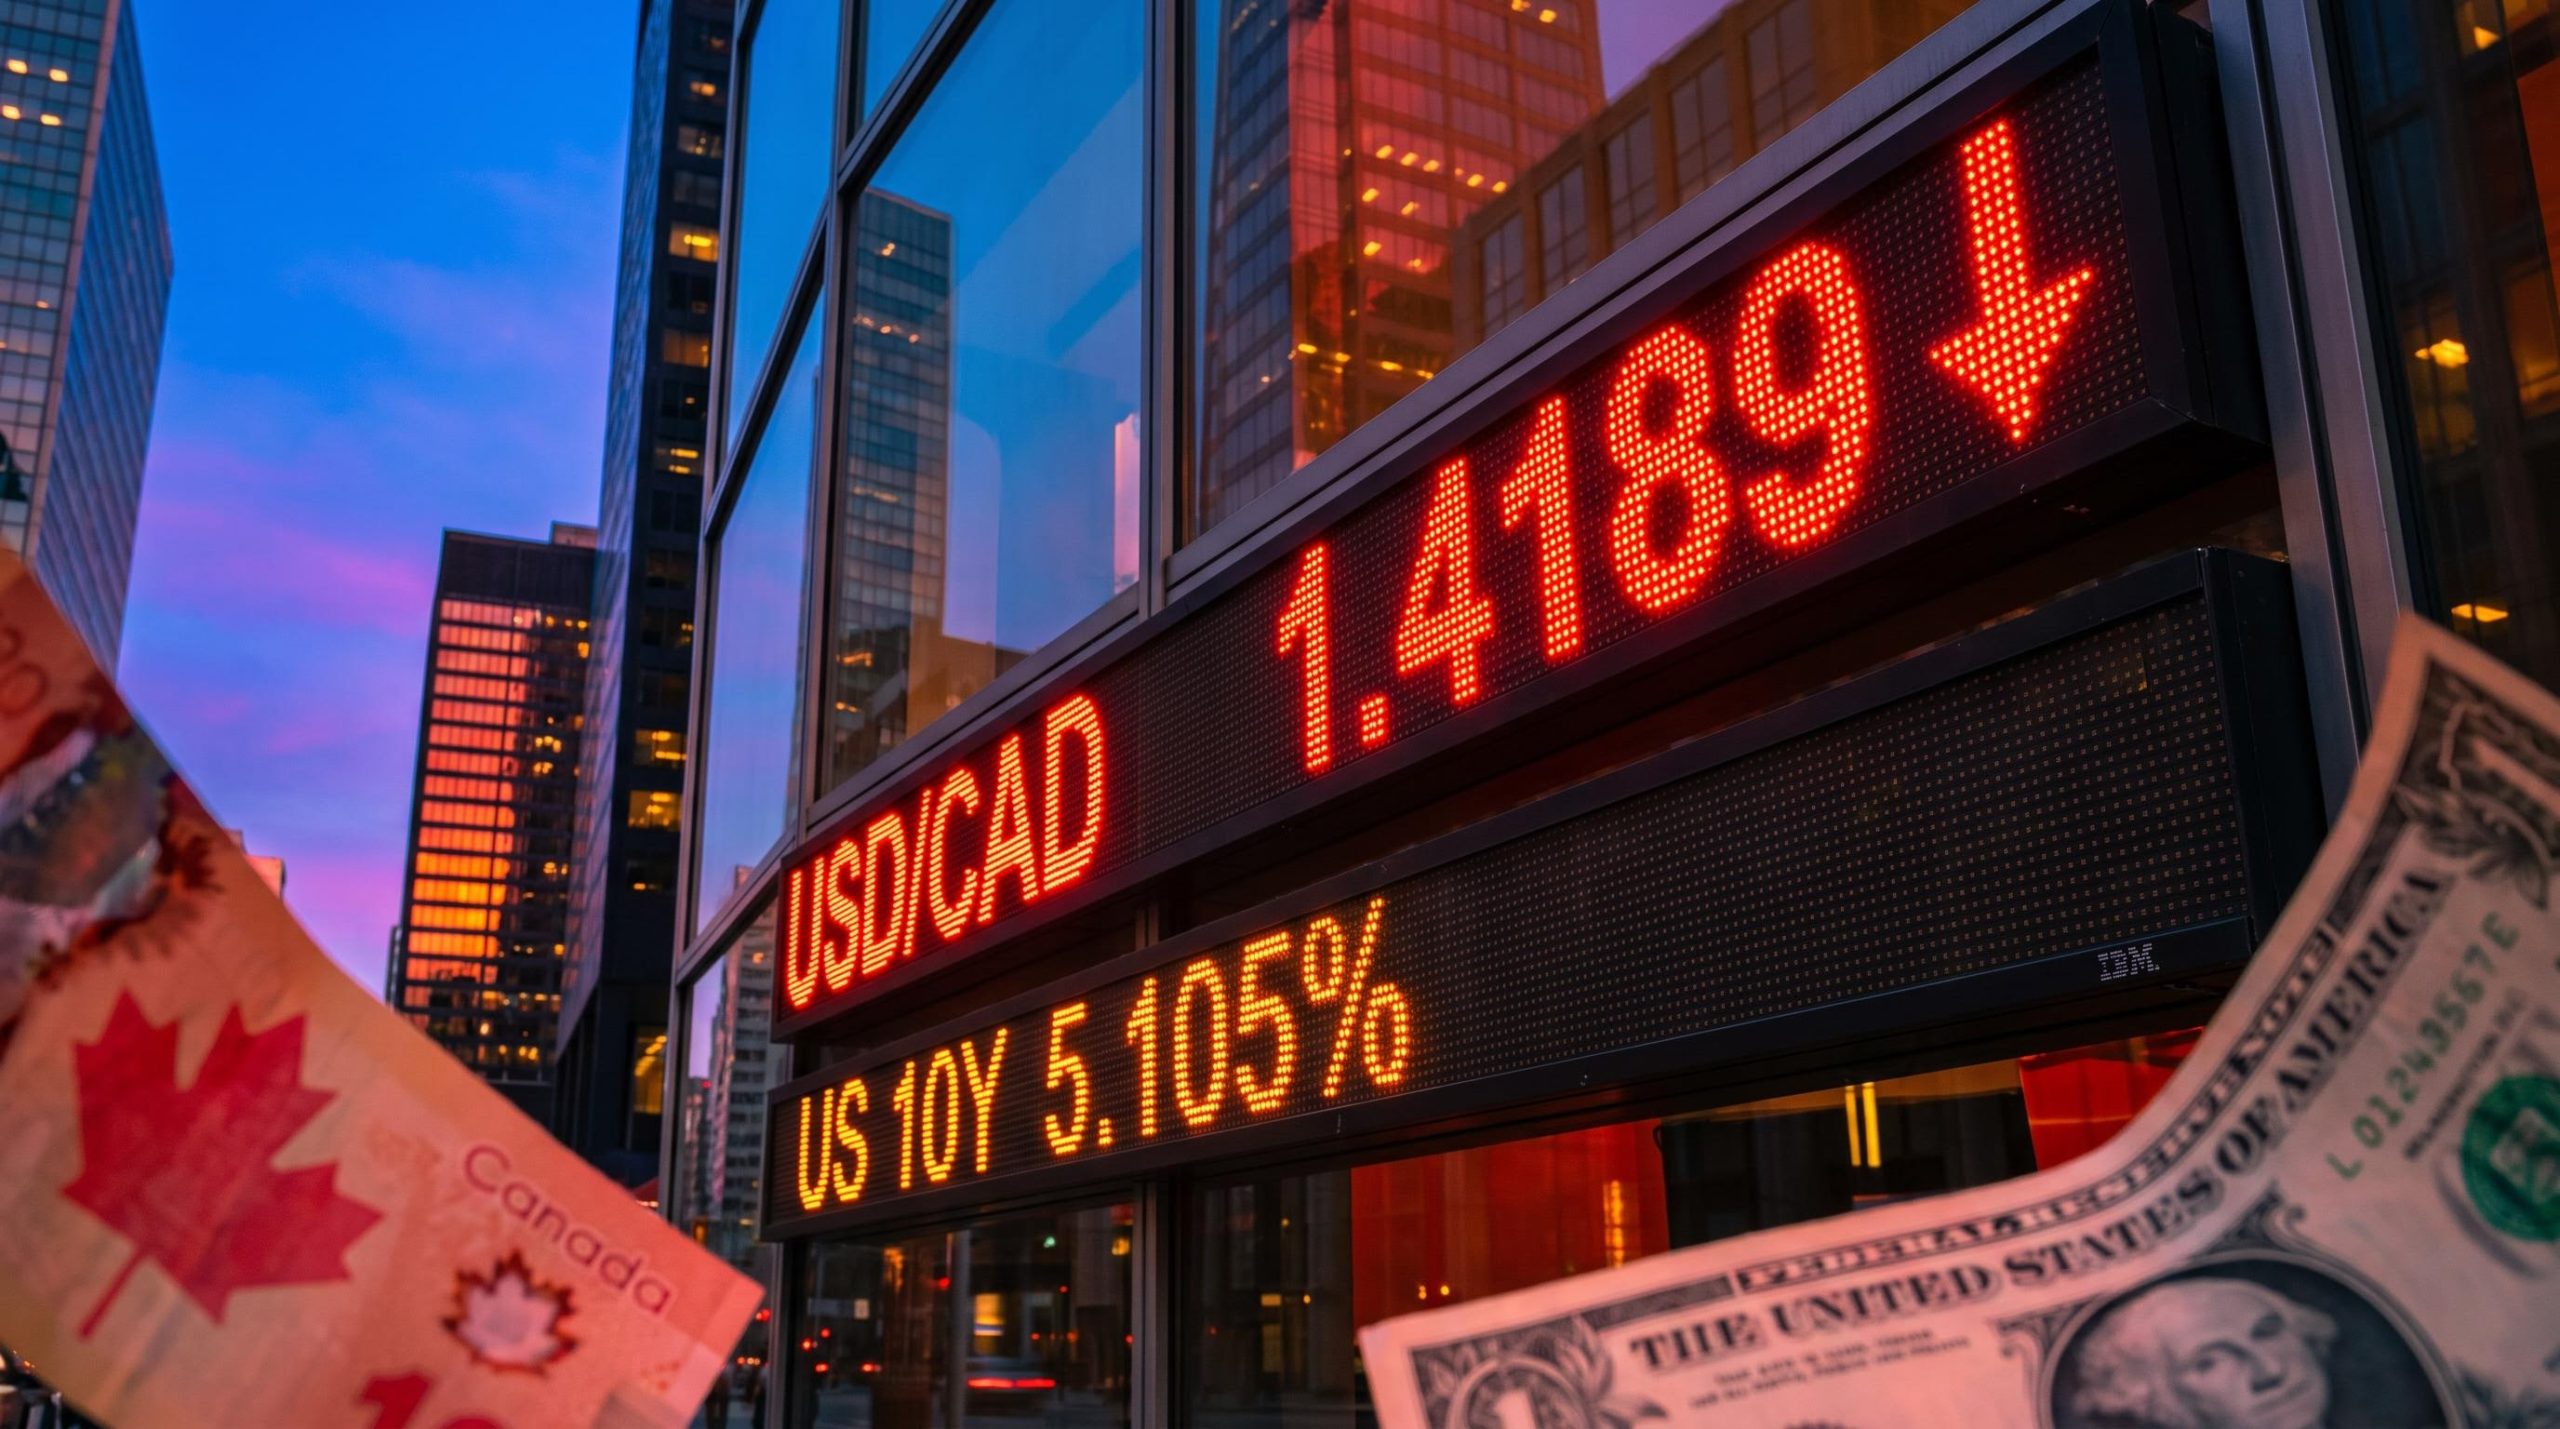
US producer prices, retail sales and consumer inflation all came in hotter than expected this week, yet USD/CAD fell almost 0.30% on Thursday, 15 October 2026, to a two-week low near 1.4189. The pair touched an intraday low of 1.4169, and the US dollar lost ground just as the data argued it should gain.
The bond market explains the gap. The US 10-year Treasury yield fell 8.4 basis points to 5.105%, its lowest level in three weeks, according to Reuters. A basis point is one hundredth of a percentage point.
That yield drop mattered more to the dollar than any single data release. If you trade currencies on data headlines alone, days like this one can put you on the wrong side of the move.
Here is a working framework for how yields, central bank policy and risk sentiment combine to drive the pair. It also covers what to watch before Canada’s September inflation data on 19 October and the Bank of Canada decision on 28 October, which together shape any near-term USD/CAD forecast.
Why did the US dollar fall when US data came in hot?
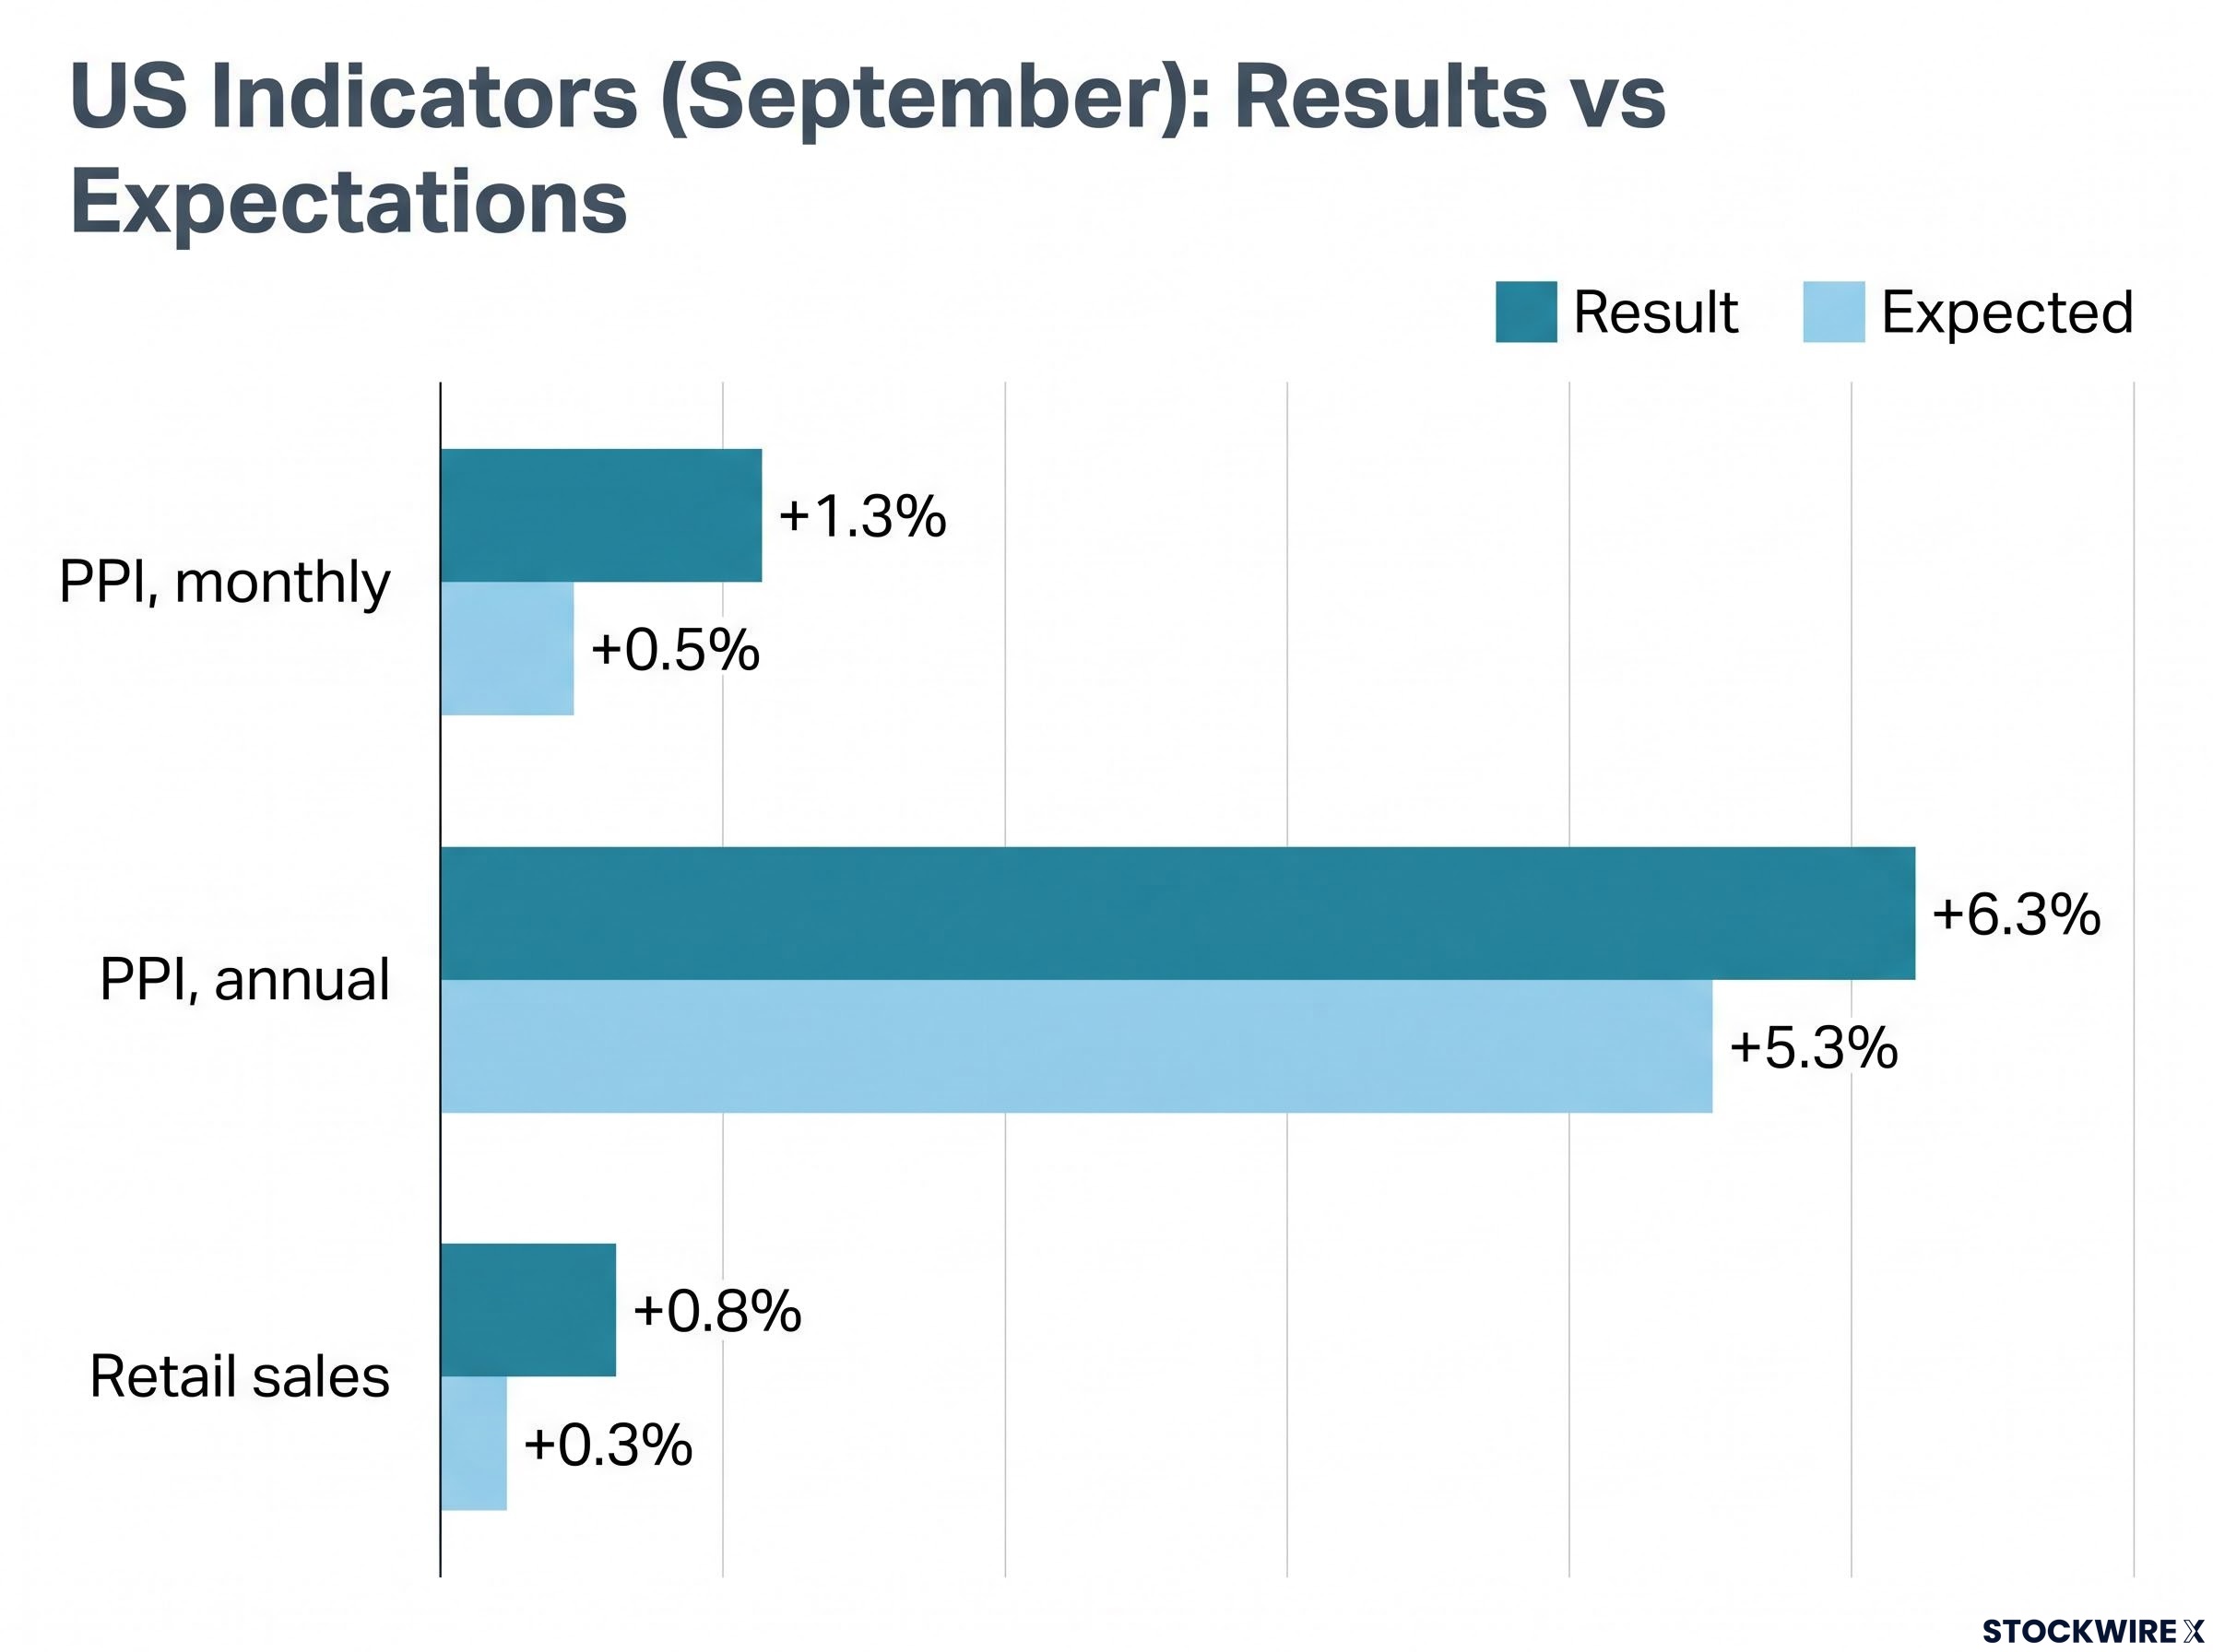
On paper, the week’s numbers made a strong case for a firmer dollar. The producer price index (PPI), which tracks the prices businesses receive for their goods and services, jumped well past forecasts, and retail sales more than doubled expectations.
| US indicator (September) | Result | Expected |
|---|---|---|
| PPI, monthly | +1.3% | +0.5% |
| PPI, annual | +6.3% | +5.3% |
| Core PPI, monthly | +0.7% | +0.3% |
| Retail sales | +0.8% | +0.3% (one source cited +0.4%) |
| CPI, annual | +3.7% | +3.6% |
| Initial jobless claims | 199,000 | 200,000 |
August retail sales were also revised up to +1.3%. Hot inflation usually pushes yields higher, and higher yields usually lift the dollar.
This time, Treasuries rallied instead, and yields fall when bond prices rise.
“Highly counter-intuitive” That was how Prashant Newnaha of TD Securities described the bond rally that followed the upside inflation surprise.
How the AI-debt scare reached Treasuries
The trigger was borrowing tied to artificial intelligence (AI). Goldman Sachs estimates global AI-related debt issuance at almost $600 billion year to date, and Reuters pointed to CoreWeave’s roughly $22 billion in bonds and $26 billion in loans as a measure of the scale. Three fears converged: heavy issuance competing with Treasuries for capital, the risk that weak AI returns hit richly valued tech stocks, and contagion into credit markets.
Goldman Sachs projects AI debt issuance from hyperscalers could reach roughly $400 billion in 2027, which would keep long-dated corporate supply competing with Treasuries for capital well beyond this week’s scare.
Reuters called the move a “rude awakening” over the debt-fuelled boom. Damien Boey of Wilson Asset Management said the usual relationship between bonds and equities was “fracturing”, while BlackRock cut US equities to neutral and favoured shorter-duration Treasuries.
- AI-debt concerns build
- Investors reduce equity and credit risk
- Money flows into Treasuries
- Yields fall
- The dollar loses yield support
- USD/CAD drops
The lesson for you: a strong data print does not guarantee a stronger currency. When investors run for safety, the direction of yields decides the dollar’s move.
How did the Canadian dollar fare, and why is the Bank of Canada’s bar for hiking so high?
A currency heat map, which shows one currency’s percentage change against several others, tells you the Canadian dollar’s gains were patchy. FXStreet data showed the loonie up against some majors and down against others.
| CAD against | Change | Direction |
|---|---|---|
| AUD | +1.12% | Gained |
| USD | +0.34% | Gained |
| JPY | +0.25% | Gained |
| NZD | -0.02% | Flat |
| EUR | -0.16% | Lost |
| GBP | -0.23% | Lost |
| CHF | -0.51% | Lost |
That pattern is the giveaway. Thursday’s rise was mostly US dollar weakness, not Canadian strength, which is why it did not carry over to the euro, pound or Swiss franc.
Fed hike odds against a cautious Bank of Canada
Policy divergence normally supports USD/CAD, because a higher-paying US rate draws capital into dollars.
- Federal Reserve: raised rates 25 bp in September; CME FedWatch puts the odds of another hike by December at 89.8%, with an October pause expected
- Bank of Canada: held at 2.25% on 2 September
- Canadian inflation: headline around 3.0%, but 2.2% excluding gasoline, according to figures not independently confirmed
- Canadian labour: employment reportedly fell 0.3% in September and unemployment rose to 6.5%, also unconfirmed
Scotiabank read the September statement as hawkish but noted the problem sits in gasoline and energy. RBC expects gradual improvement that could make a later hike easier. Expectations are split: the original report said markets still see a BoC hike by December, while October commentary points to a hold on 28 October.
Bank of Canada hike odds have swung sharply in recent weeks, and the bank now sits 175 basis points below the Fed, the widest gap since 2022, which weighs on the Canadian dollar whatever the 28 October outcome.
Divergence does not always win. On 22 September, a wider US-Canada yield gap sent CAD to a nearly seven-week low despite a more hawkish BoC. Yields, not rhetoric, did the work then too.
What could move USD/CAD next: the scenarios and dates to watch
Thursday’s puzzle resolves into a tug of war between competing forces, with no single outcome locked in.
| Scenario | USD/CAD direction | Key trigger |
|---|---|---|
| Treasury rally continues | Lower | AI-debt fears, safe-haven demand |
| Fed reprices toward more tightening | Higher | Hot data, 89.8% December odds |
| BoC turns more hawkish | Lower | Firmer Canadian inflation |
| BoC focuses on weak jobs | Higher | Rising unemployment |
| Bond rally reverses | Higher | Yields resume their 2026 climb |
That last risk deserves weight. BlackRock noted the 10-year yield had risen about 110 bp in 2026 to around 5.25%, so Thursday’s dip remains small against the year’s move.
- 19 October: Canadian September CPI
- 28 October: Bank of Canada decision
- Ongoing: pricing for the Fed’s next meeting and December hike odds
Reported end-2026 bank forecasts, which have not been independently confirmed, range from Scotiabank near 1.37 and BMO near 1.38 to TD near 1.39 and CIBC near 1.41. That spread tells you the pair’s direction depends on yields and risk sentiment more than on any single release. Forecasts are subject to market conditions and past performance does not guarantee future results.
Scotiabank’s fair-value model puts USD/CAD equilibrium near 1.4055, and with sparse technical support between the mid-1.41 area and 1.40, a break lower could unwind quickly.
The key lesson Currencies respond to changes in expected risk-adjusted returns, not to economic data in isolation.
What Thursday’s move changes, and what it leaves open
The data argued for a stronger dollar, but falling yields and risk aversion carried the day. Nothing about Thursday’s drop settles the gap between a Fed leaning towards hikes and a Bank of Canada reluctant to follow.
For your watchlist, two signals matter most: the direction of US Treasury yields and the 19 October Canadian CPI, both ahead of the 28 October BoC meeting.
This article is for informational purposes only and should not be considered financial advice. Investors should conduct their own research and consult with financial professionals before making investment decisions.