
There is a gap at the centre of the USD/CAD picture, and it is worth staring at before anything else. Scotiabank’s fair-value model puts the pair’s equilibrium at 1.4055, yet spot has been trading in the mid-1.41s, with the Relative Strength Index sitting at 72, deep into overbought territory.
That combination is unusual. An overbought technical signal typically warns of a stretched move, while a spot rate above fair value suggests the currency being sold, the Canadian dollar, is modestly cheap on fundamentals. The two signals point the same direction: toward CAD, not away from it.
This CAD weakness is not a one-day event. It is the product of a multi-week climb in USD/CAD, and Scotiabank strategists Shaun Osborne and Eric Theoret are now questioning whether that trend has run its course. Underpinning the move has been the Bank of Canada’s decision to hold its policy rate at 2.25% for seven consecutive meetings, an extended pause that has weighed on the loonie through widening yield differentials.
Here is what the data actually tells you about whether the CAD weakness is spent or still running, read through the technical signals, the fair-value model, the policy backdrop, and the risks that could override all of it.
What the charts are saying: USD/CAD momentum is stretched
Start with momentum, because that is where the exhaustion shows up first. The RSI, a measure of how fast and how far a price has moved recently, registered 72 at the time of Scotiabank’s analysis. Any reading above 70 is conventionally treated as overbought, meaning the recent buying has been intense enough that a pause or pullback becomes statistically more likely.
The trend behind that reading has been persistent. USD/CAD had climbed in a nearly uninterrupted bullish move from roughly 9 July onward, and by the analysis date the pair was struggling to push meaningfully above the mid-1.41 zone.
That difficulty matters. A trend that keeps making new highs is healthy; a trend that stalls just below a level while momentum runs hot is showing fatigue. Osborne and Theoret characterised the overall stance as bullish to neutral for exactly this reason: the direction had been up, but the fuel was thinning.
For an investor, an RSI of 72 does not mean the pair must reverse. What it does mean is that adding to long USD/CAD positions here carries a materially different risk profile than it did earlier in the trend, when the move still had room to run.
Support, resistance and what the absence of floor levels means for downside
Above spot, the picture is well defined. Resistance sits at roughly 1.4200, a level that has capped further upside and gives the pair a natural ceiling to test.
Below spot, it is a different story. Scotiabank flagged sparse technical support between the mid-1.41 area and the psychologically important 1.40 threshold.
- RSI at 72: overbought, above the 70 warning line
- Resistance at 1.4200: the near-term ceiling on further USD/CAD gains
- Sparse support to 1.40: few natural stopping points on the way down
In practical terms, that thin support zone is not a bearish forecast. It is a statement about how a decline would behave if one begins. With few structural floor levels between spot and the round number, a downside move could unwind quickly rather than pausing at intermediate supports, which makes the risk around the current setup asymmetric.
When big ASX news breaks, our subscribers know first
Scotiabank’s fair-value model and what the gap tells you
Technical signals describe positioning. Fair-value models describe worth. Scotiabank runs a model that estimates where USD/CAD should trade based on fundamental drivers, and it puts equilibrium at 1.4055.
Scotiabank fair-value estimate: 1.4055 The model’s read on where USD/CAD should sit based on fundamentals, independent of short-term momentum.
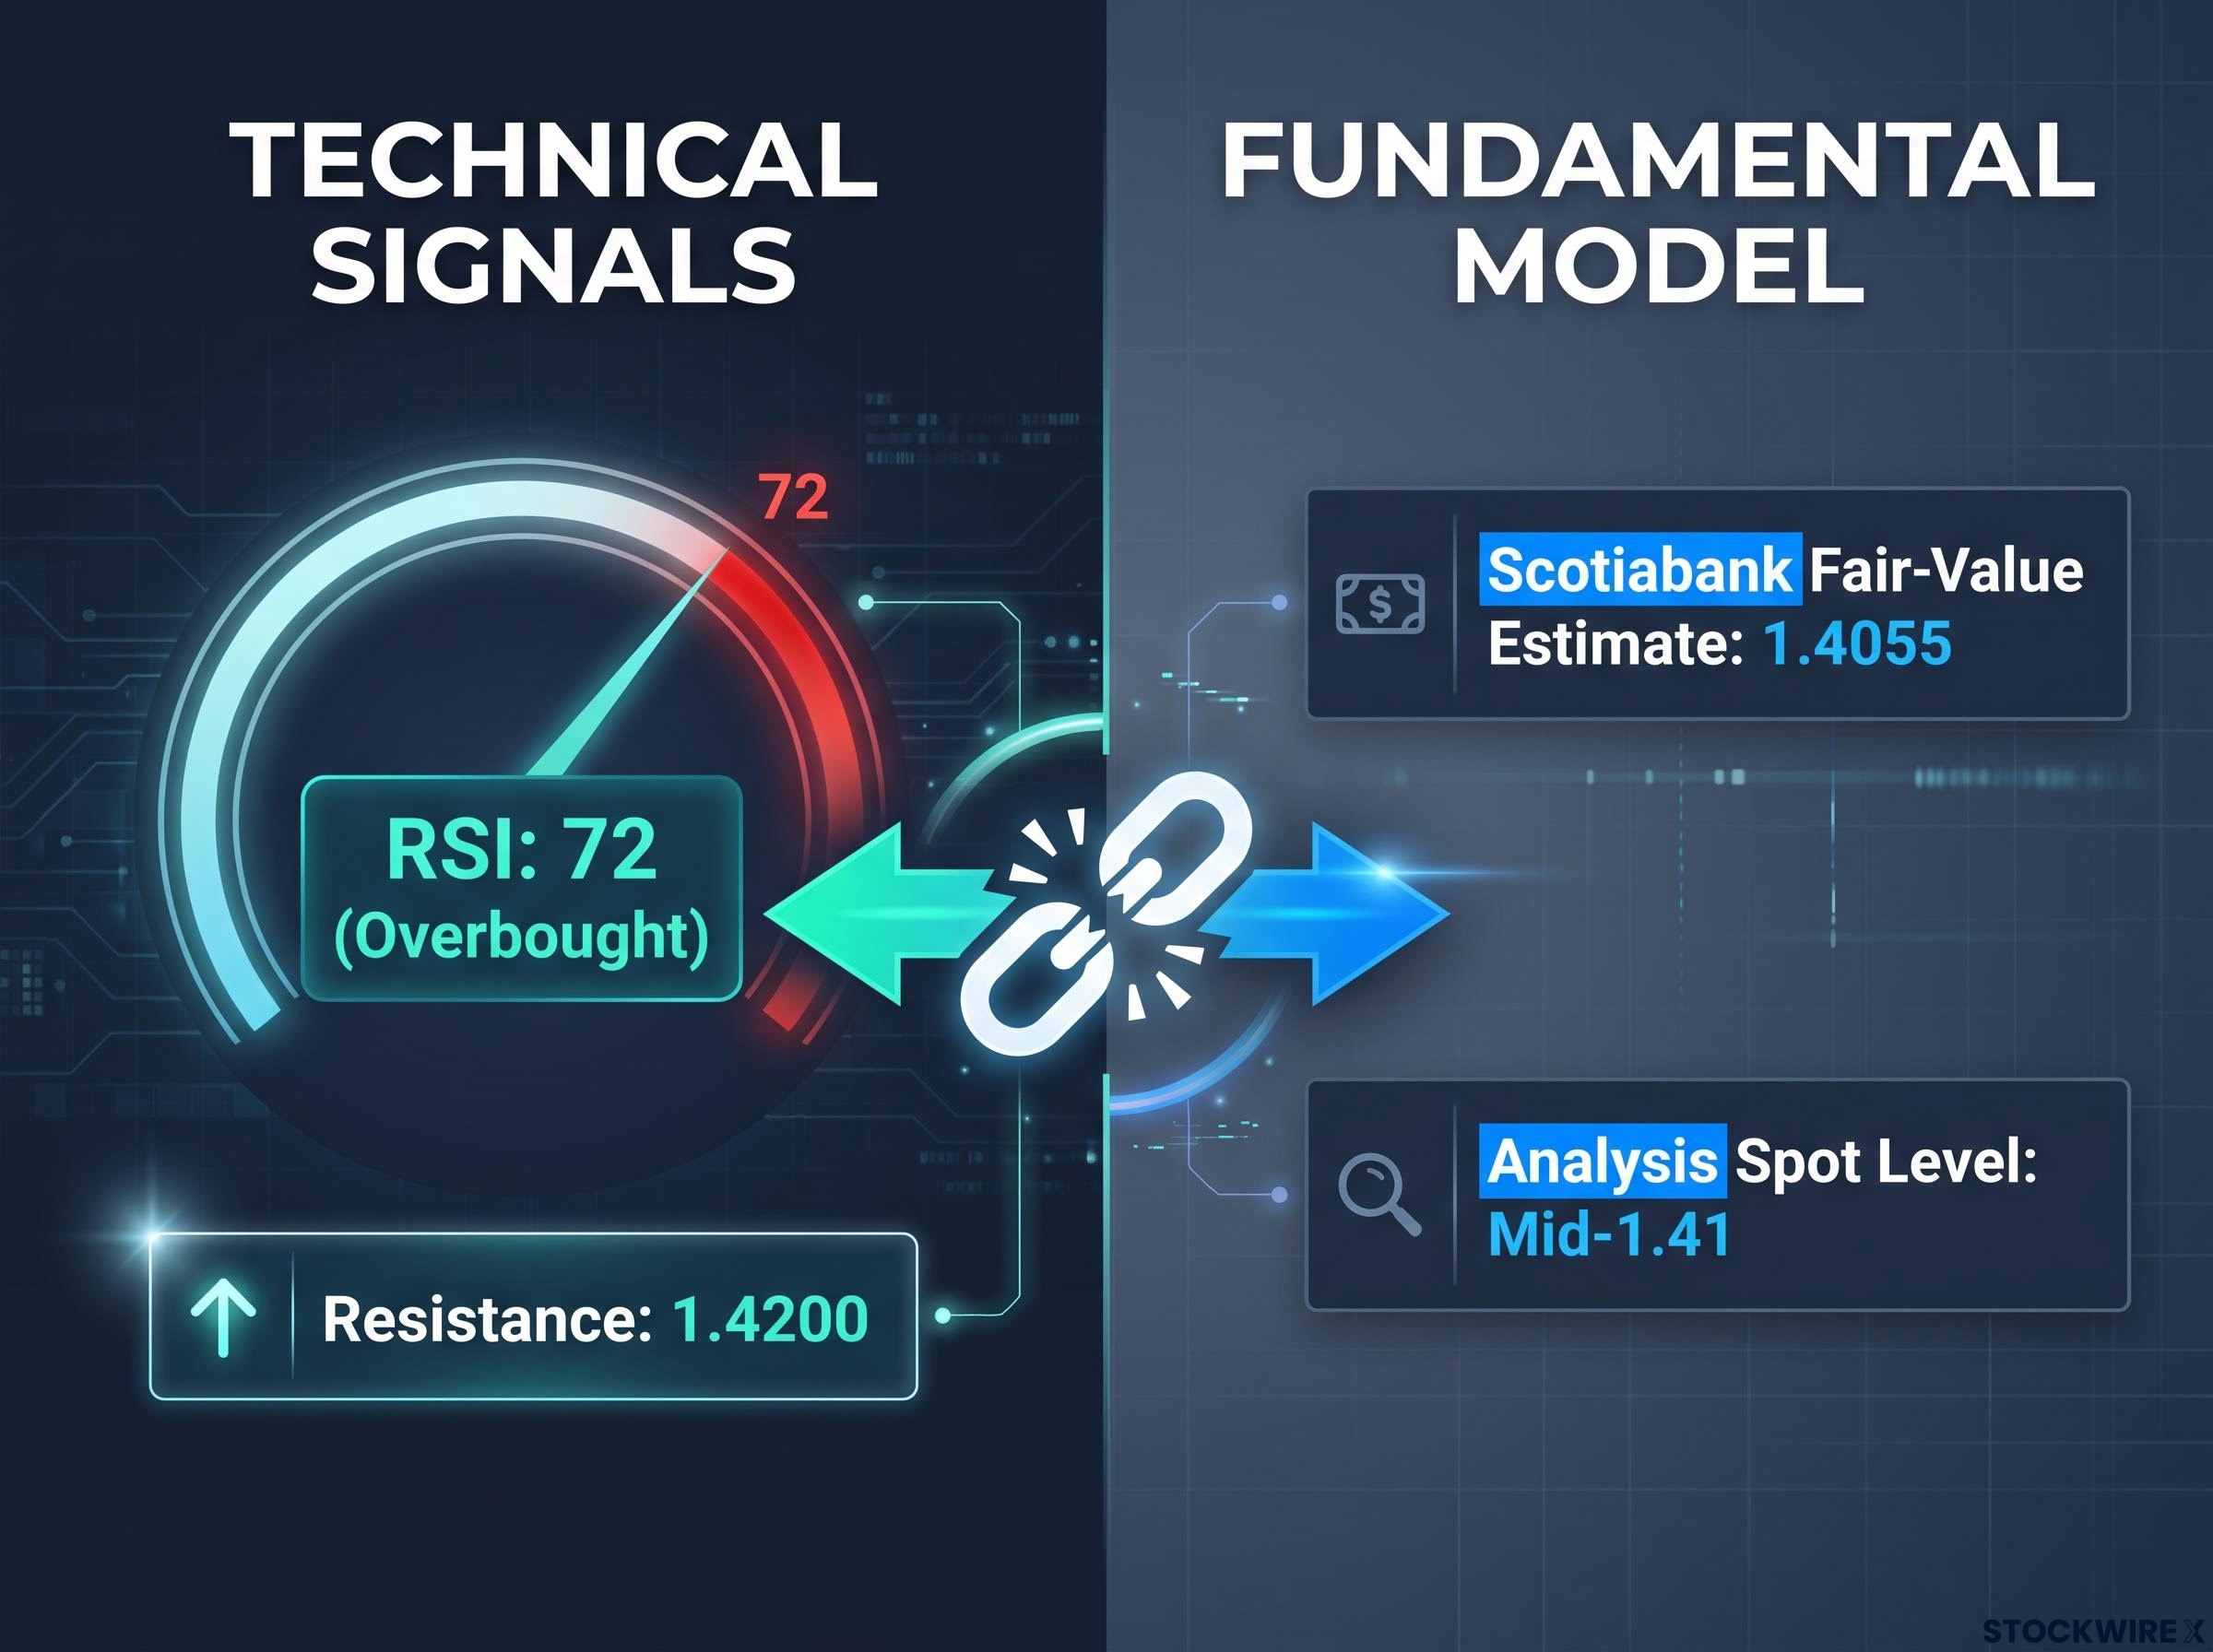
With spot in the mid-1.41s at the time of the analysis, the pair was trading modestly above that model level. Because USD/CAD rising means CAD falling, a spot rate above fair value implies the loonie was slightly undervalued, cheap relative to what fundamentals justified.
Sit with that for a moment before the interpretation arrives. The market had pushed CAD to a level the model did not cleanly support, and it had done so while momentum was already overbought.
What happened next gave the model’s directional read some early validity. By the 2 September 2026 Bank of Canada decision, spot had moved down toward and through fair value, trading around 1.38-1.39 per Reuters and supporting estimates.
| Reference point | Spot level | Model estimate | CAD status |
|---|---|---|---|
| Scotiabank analysis date | Mid-1.41 | 1.4055 | Modestly undervalued |
| 2 September 2026 (BoC decision) | ~1.38-1.39 | 1.4055 | Near or through fair value |
Worth being transparent about the two readings, because they come from different moments in the same analytical window. The Scotiabank technical snapshot, with spot in the mid-1.41s and RSI at 72, pre-dates the 2 September BoC print, when spot had already firmed into the 1.38-1.39 zone. Both are genuine data points, not a contradiction.
The model does not predict when reversion happens. What it tells you is that the market was not pricing CAD at a level fundamental drivers cleanly justified, and that creates an asymmetric setup where the path of least resistance for the loonie may be stronger rather than weaker. Scotiabank’s read is that the divergence reflected temporary positioning pressure, not a genuine shift in fundamentals.
The BoC policy picture and why yield-spread pressure may be running out of road
To understand why the loonie has been under pressure, start with the mechanism, because the fundamental case builds directly from it. When one central bank holds its interest rate lower than another, the lower-yielding currency tends to weaken. Capital flows toward the higher return, and that flow pushes the cheaper-yielding currency down.
This is the yield differential, and it has been a structural headwind for CAD. With the Bank of Canada holding while the US Federal Reserve has run comparatively tighter policy, investors have had a steady incentive to favour US dollar assets over Canadian ones.
The yield differential mechanism is only one layer of the loonie currency drivers at work; global US dollar cycles and forward rate expectations can override domestic BoC policy entirely, meaning the rate itself is often less actionable than the market’s repricing of where that rate is heading.
The BoC’s stance has been deliberately patient. The overnight rate has sat at 2.25% since October 2025, at the lower bound of the Bank’s estimated neutral range, and the 2 September 2026 decision marked the seventh consecutive hold, roughly 11 months without a change.
The Bank of Canada’s July 2026 Monetary Policy Report projected inflation easing from roughly 3% in Q2 2026 to around 2.5% through the second half of the year, a trajectory that directly shaped the rationale for the extended policy hold and framed the hawkish inflation language the Bank would later deploy in its September decision.
That pause commands broad agreement across the major desks. The rate outlook reads as a three-part sequence:
The BoC rate outlook through 2026 has been remarkably stable across the major desks, with TD Securities projecting no change until a hike in January 2027 and identifying November 2026 trade data as the earliest point at which tariff effects could be assessed for policy purposes.
- Current hold: 2.25%, the seventh straight, with markets pricing no imminent change
- Through year-end 2026: RBC Economics and Desjardins Economics both expect the rate to stay at 2.25%
- First half of 2027: Desjardins projects a gradual hiking cycle of roughly 50 basis points
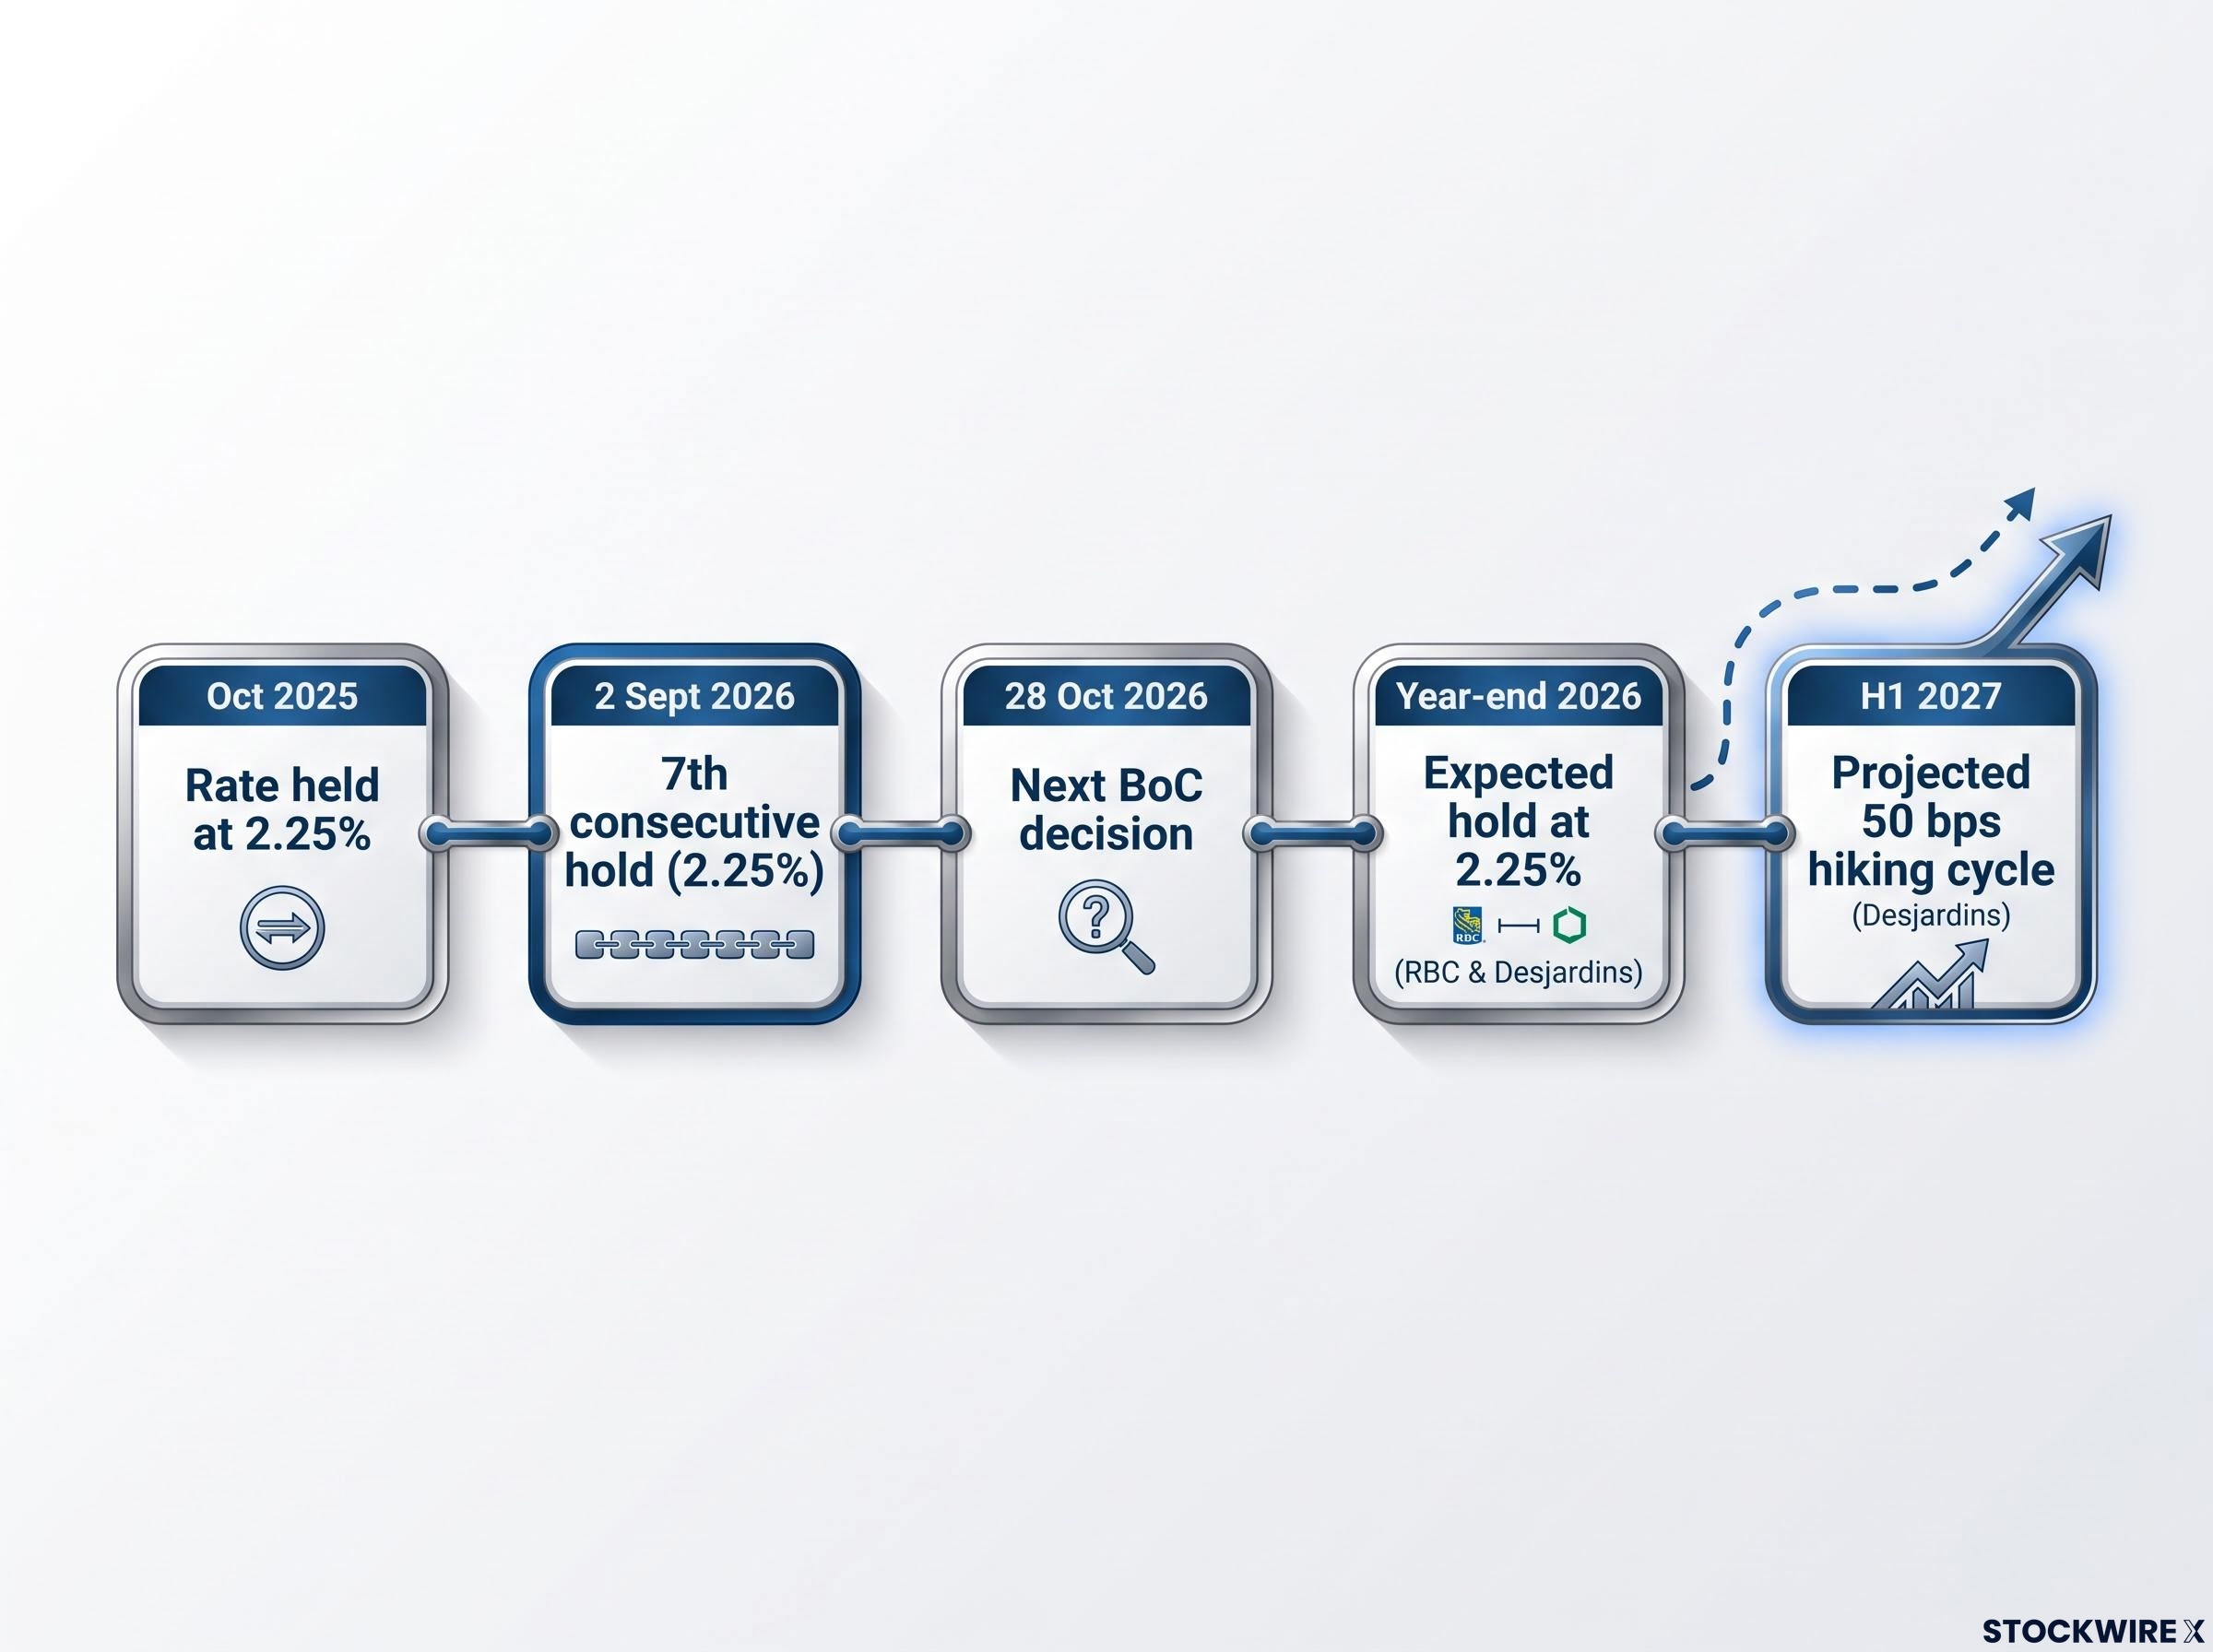
That progression matters because it locates the turning point. The near term is settled; the shift, if it comes, lands in 2027.
Why the market may be underpricing the BoC
Here is where Scotiabank’s specific claim enters. At the time of the analysis, the strategists characterised the Bank of Canada as appearing somewhat underpriced relative to what fundamentals warranted, meaning markets may be underestimating the odds of future BoC tightening.
The Bank has given them reason. In the September decision, the BoC flagged stronger upside risks to inflation, per Trading Economics, even while holding. Governor Tiff Macklem told Reuters that policymakers are prepared to raise borrowing costs multiple times if inflation stays too high.
The BoC’s own hawkish signal The Bank flagged “stronger upside risks to inflation” in September while holding at 2.25%, a hawkish bias constrained by growth and trade uncertainty.
The read for investors is this: if the market begins pricing even partial BoC normalisation in 2027, closer to the Desjardins or Macklem-implied path, that repricing alone could pull USD/CAD lower without any change in the US rate trajectory. This is conditional and medium-term, not a near-term trigger. But it changes the risk profile of holding sustained USD/CAD longs, because the yield-spread pressure that has weighed on CAD may be nearing its limit.
What could keep USD/CAD elevated despite the warning signs
The overbought and undervaluation signals are necessary for a CAD recovery. They are not sufficient. Several forces could override both, and none is a token caveat.
- Tariff escalation: RBC Economics cites further US tariff hikes as a key risk to Canada’s economy, and the Globe and Mail frames the trade war as a direct threat to Canadian growth
- A commodity price drop: a fall in energy or broader commodity prices would undercut Canada’s terms of trade and pressure CAD
- A prolonged BoC pause: Desjardins expects the Bank on hold through 2026, and if it stays there while the Fed runs tighter, yield-differential pressure could persist or deepen
- Inflation-driven risk-off: the BoC flagged stronger upside risks to inflation, and an upside surprise without matching growth could trigger safe-haven flows into USD
The institutional counterweight The Bank of Canada flagged “stronger upside risks to inflation” in its September decision, a reminder that the recovery thesis rests on conditions that could turn.
Take the prolonged-pause risk seriously. If the BoC holds while comparatively tighter US policy persists, the yield gap that has weighed on CAD does not just linger; it could widen, keeping USD/CAD supported even as RSI and fair-value signals flash overbought and undervalued.
The tariff escalation risk runs in both directions: when 50% duties on roughly US$20 billion of Canadian goods were announced in August 2026, the loonie posted its largest single-session drop against the USD of any major currency before a three-day pause triggered an equally sharp recovery, illustrating how quickly positioning can reverse when negotiation optionality re-enters the picture.
The inflation wildcard cuts a specific way. Higher inflation could support CAD through higher yields, but if it arrives without a growth backdrop, it may instead spark risk-off sentiment that favours the US dollar despite higher nominal Canadian yields.
There is also the technical mirror of the earlier point. That same sparse support between mid-1.41 and 1.40 becomes a risk in the other direction if downside momentum fails to materialise and the pair mounts a fresh attempt at a new high.
None of these is theoretical. Each has a named institutional source and a live data feed, which means tariff headlines, commodity moves, and the next BoC decision are real-time inputs to the thesis, not background noise.
Reading the signals together before the October 28 BoC decision
Pull the threads together and a coherent argument emerges, though not a verdict. RSI at 72, spot above the 1.4055 fair-value model, Scotiabank’s bullish-to-neutral characterisation, and the prospect of BoC repricing in 2027 combine to argue for at least a USD/CAD consolidation, and possibly a more sustained CAD recovery.
Institutional CAD forecasts from the major desks lean toward recovery over 12 months, with Scotiabank targeting 1.33 by Q4 2027, RBC projecting the low 1.30s, and ING at 1.36 by Q4 2026, though the near-zero oil-CAD correlation recorded in 2026 research means commodity prices are no longer a reliable input for calibrating those targets.
Two nearest events could shift the balance. The 28 October 2026 BoC rate announcement, widely expected to be another hold at 2.25%, and the July monthly GDP report that Scotiabank identified as the next high-impact data release after its analysis.
Key near-term date: 28 October 2026 The next BoC decision. The tone on inflation and growth risks may matter as much as the rate itself.
| Conditions that strengthen the CAD recovery thesis | Conditions that sustain USD/CAD elevation |
|---|---|
| BoC holds but signals imminent hikes | BoC signals a prolonged pause |
| July GDP surprises to the upside | GDP disappoints |
| Commodity prices stable or rising | Trade tensions escalate further |
| No further tariff escalation | Broad global risk-off move |
For investors holding CAD-denominated assets or currency positions, the 28 October decision is not simply a rate announcement. It is the next chance for the market to reprice BoC expectations, and the language around inflation and growth will carry as much weight as the rate itself.
What the convergence of signals means for investors now
The honest read of Scotiabank’s analysis is measured, not emphatic. The weight of near-term signals, RSI at 72, CAD’s modest undervaluation against the 1.4055 model, and the underpriced-BoC thesis, argues for caution about adding to long USD/CAD positions. It is not a conviction call to go long CAD.
What it does is narrow the margin of safety for USD/CAD bulls. Overbought signals are an early warning, not a trading entry, and exposure should be calibrated accordingly.
For anyone with CAD-denominated exposure, the variables to monitor are specific:
- The 28 October 2026 BoC decision and its tone on inflation and growth
- The July monthly GDP report
- Tariff and trade-war headlines
- Whether spot holds below the 1.4055 fair-value level or reclaims the mid-1.41 zone
- The commodity and energy price trajectory
- The Desjardins-projected 50 basis point hiking path in H1 2027 as the medium-term anchor
Scotiabank’s view is one institutional read at a single moment, and the public record shows no named competing directional calls to weigh against it. That makes this a signal to sharpen your monitoring, not a green light for a position.
This article is for informational purposes only and should not be considered financial advice. Investors should conduct their own research and consult with financial professionals before making investment decisions. Past performance does not guarantee future results. Financial projections are subject to market conditions and various risk factors, and these forward-looking statements are speculative and subject to change based on market developments.