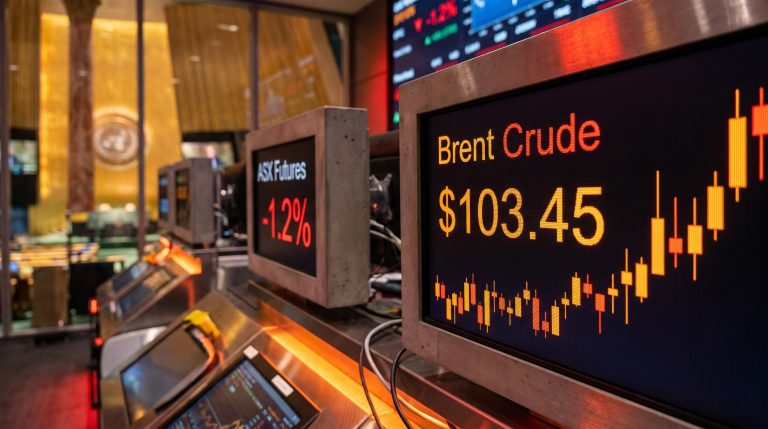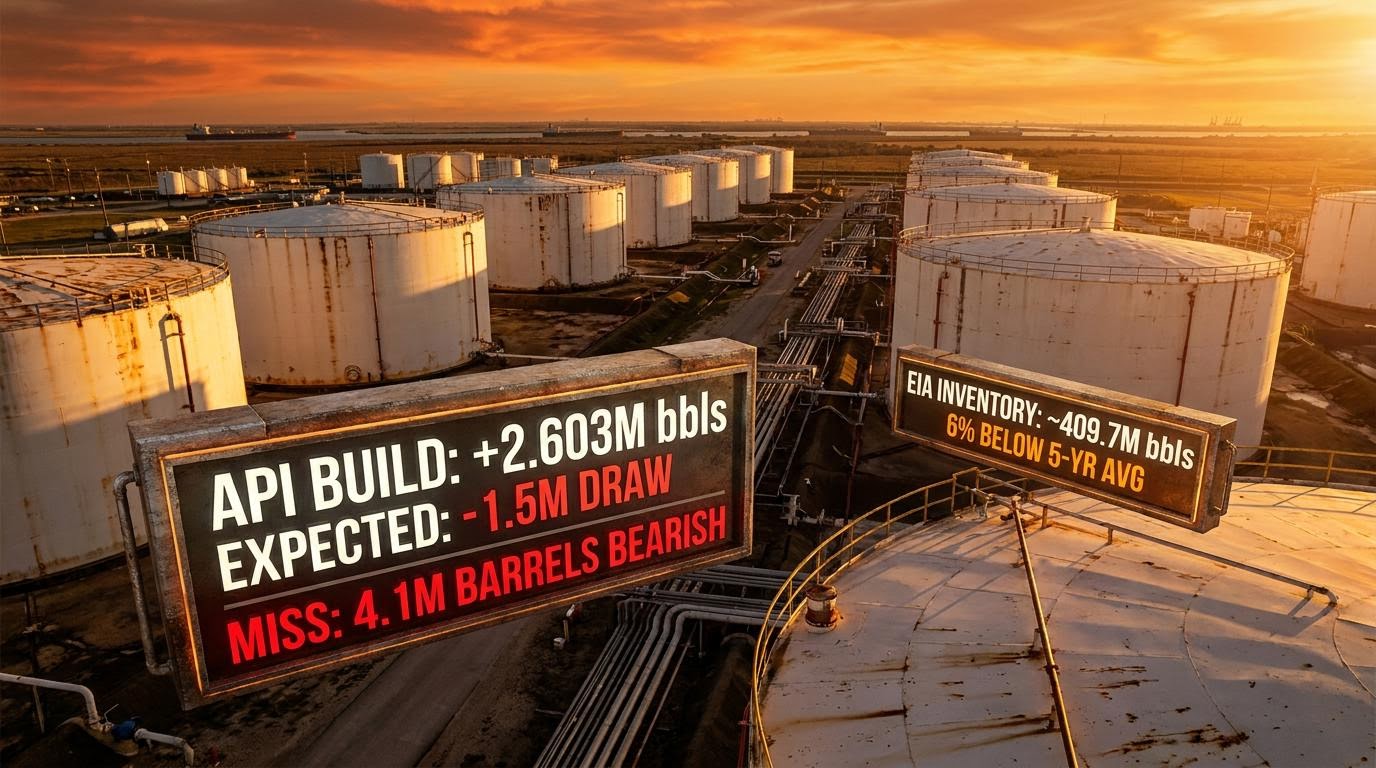
Analysts expected U.S. crude stockpiles to fall by roughly 1.5 million barrels last week. Instead, the American Petroleum Institute (API) posted a surprise crude build of around 2.6 million barrels. That is a 4.1-million-barrel miss in the bearish direction, and it landed on the same day Houthi naval blockade threats were pushing oil prices higher on war-risk headlines.
Two signals are now pointing in opposite directions simultaneously. Geopolitical headlines argue for tighter supply and higher prices; the inventory data argues that the U.S. market is looser than the consensus believed. If you hold energy exposure, you cannot rely on one signal alone to make sense of the current moment.
Here is a structured way to weigh these competing signals, understand what the API print actually means before the Energy Information Administration (EIA) confirms or contradicts it, and identify the three specific indicators that will tell you which signal is winning over the coming weeks.
What the API reported, and why the numbers shocked the market
For the week ending around 18 July 2026, API data showed U.S. crude oil stocks had risen by approximately 2.603 million barrels. Market participants had been positioned for a draw of roughly 1.5 million barrels, meaning the actual outcome landed well outside consensus. The gap between expectation and reality was not small.
Analysts expected a 1.5-million-barrel draw. The API reported a 2.6-million-barrel build. The gap: 4.1 million barrels in the bearish direction.
Against total commercial crude inventories of roughly 410-420 million barrels, a 4.1-million-barrel miss represents close to 1% of total stock. That is large enough to move prices when positioning is already stretched, and the market reaction told you something important: bullish sentiment had become crowded enough that a single bearish print could jolt it.
The EIA’s official release for the same week was scheduled for 21 July 2026, meaning the API figure remained unconfirmed at the time it hit. It was a signal, not a verdict.
When big ASX news breaks, our subscribers know first
How reliable is the API number, and what should investors wait for?
The API and the EIA both track U.S. crude inventories, but they are not interchangeable. The API survey draws on a sample of industry-reported data and serves as a directional leading indicator. The EIA covers a broader universe of operators and is the benchmark that most macro and fundamental models rely on. The two figures frequently diverge, sometimes by several million barrels.
The API and EIA figures are not simply two versions of the same number; reading U.S. oil inventory data correctly requires separating the headline crude change from concurrent product builds, SPR releases, and Cushing-level movements that can each point in a different direction from the top-line figure.
That distinction matters here. The API print’s value is as a probability-shifter: it raises the odds that the U.S. supply picture is loosening faster than the consensus believed, but it does not confirm it. The conditional logic is straightforward:
- If the EIA confirms a similarly large build, the bearish signal is validated. Two independent data sources agreeing on a surprise build would suggest the U.S. balance is genuinely softening.
- If the EIA shows a small build or another draw, the API print looks more like noise: worth noting, but not enough to declare a trend reversal.
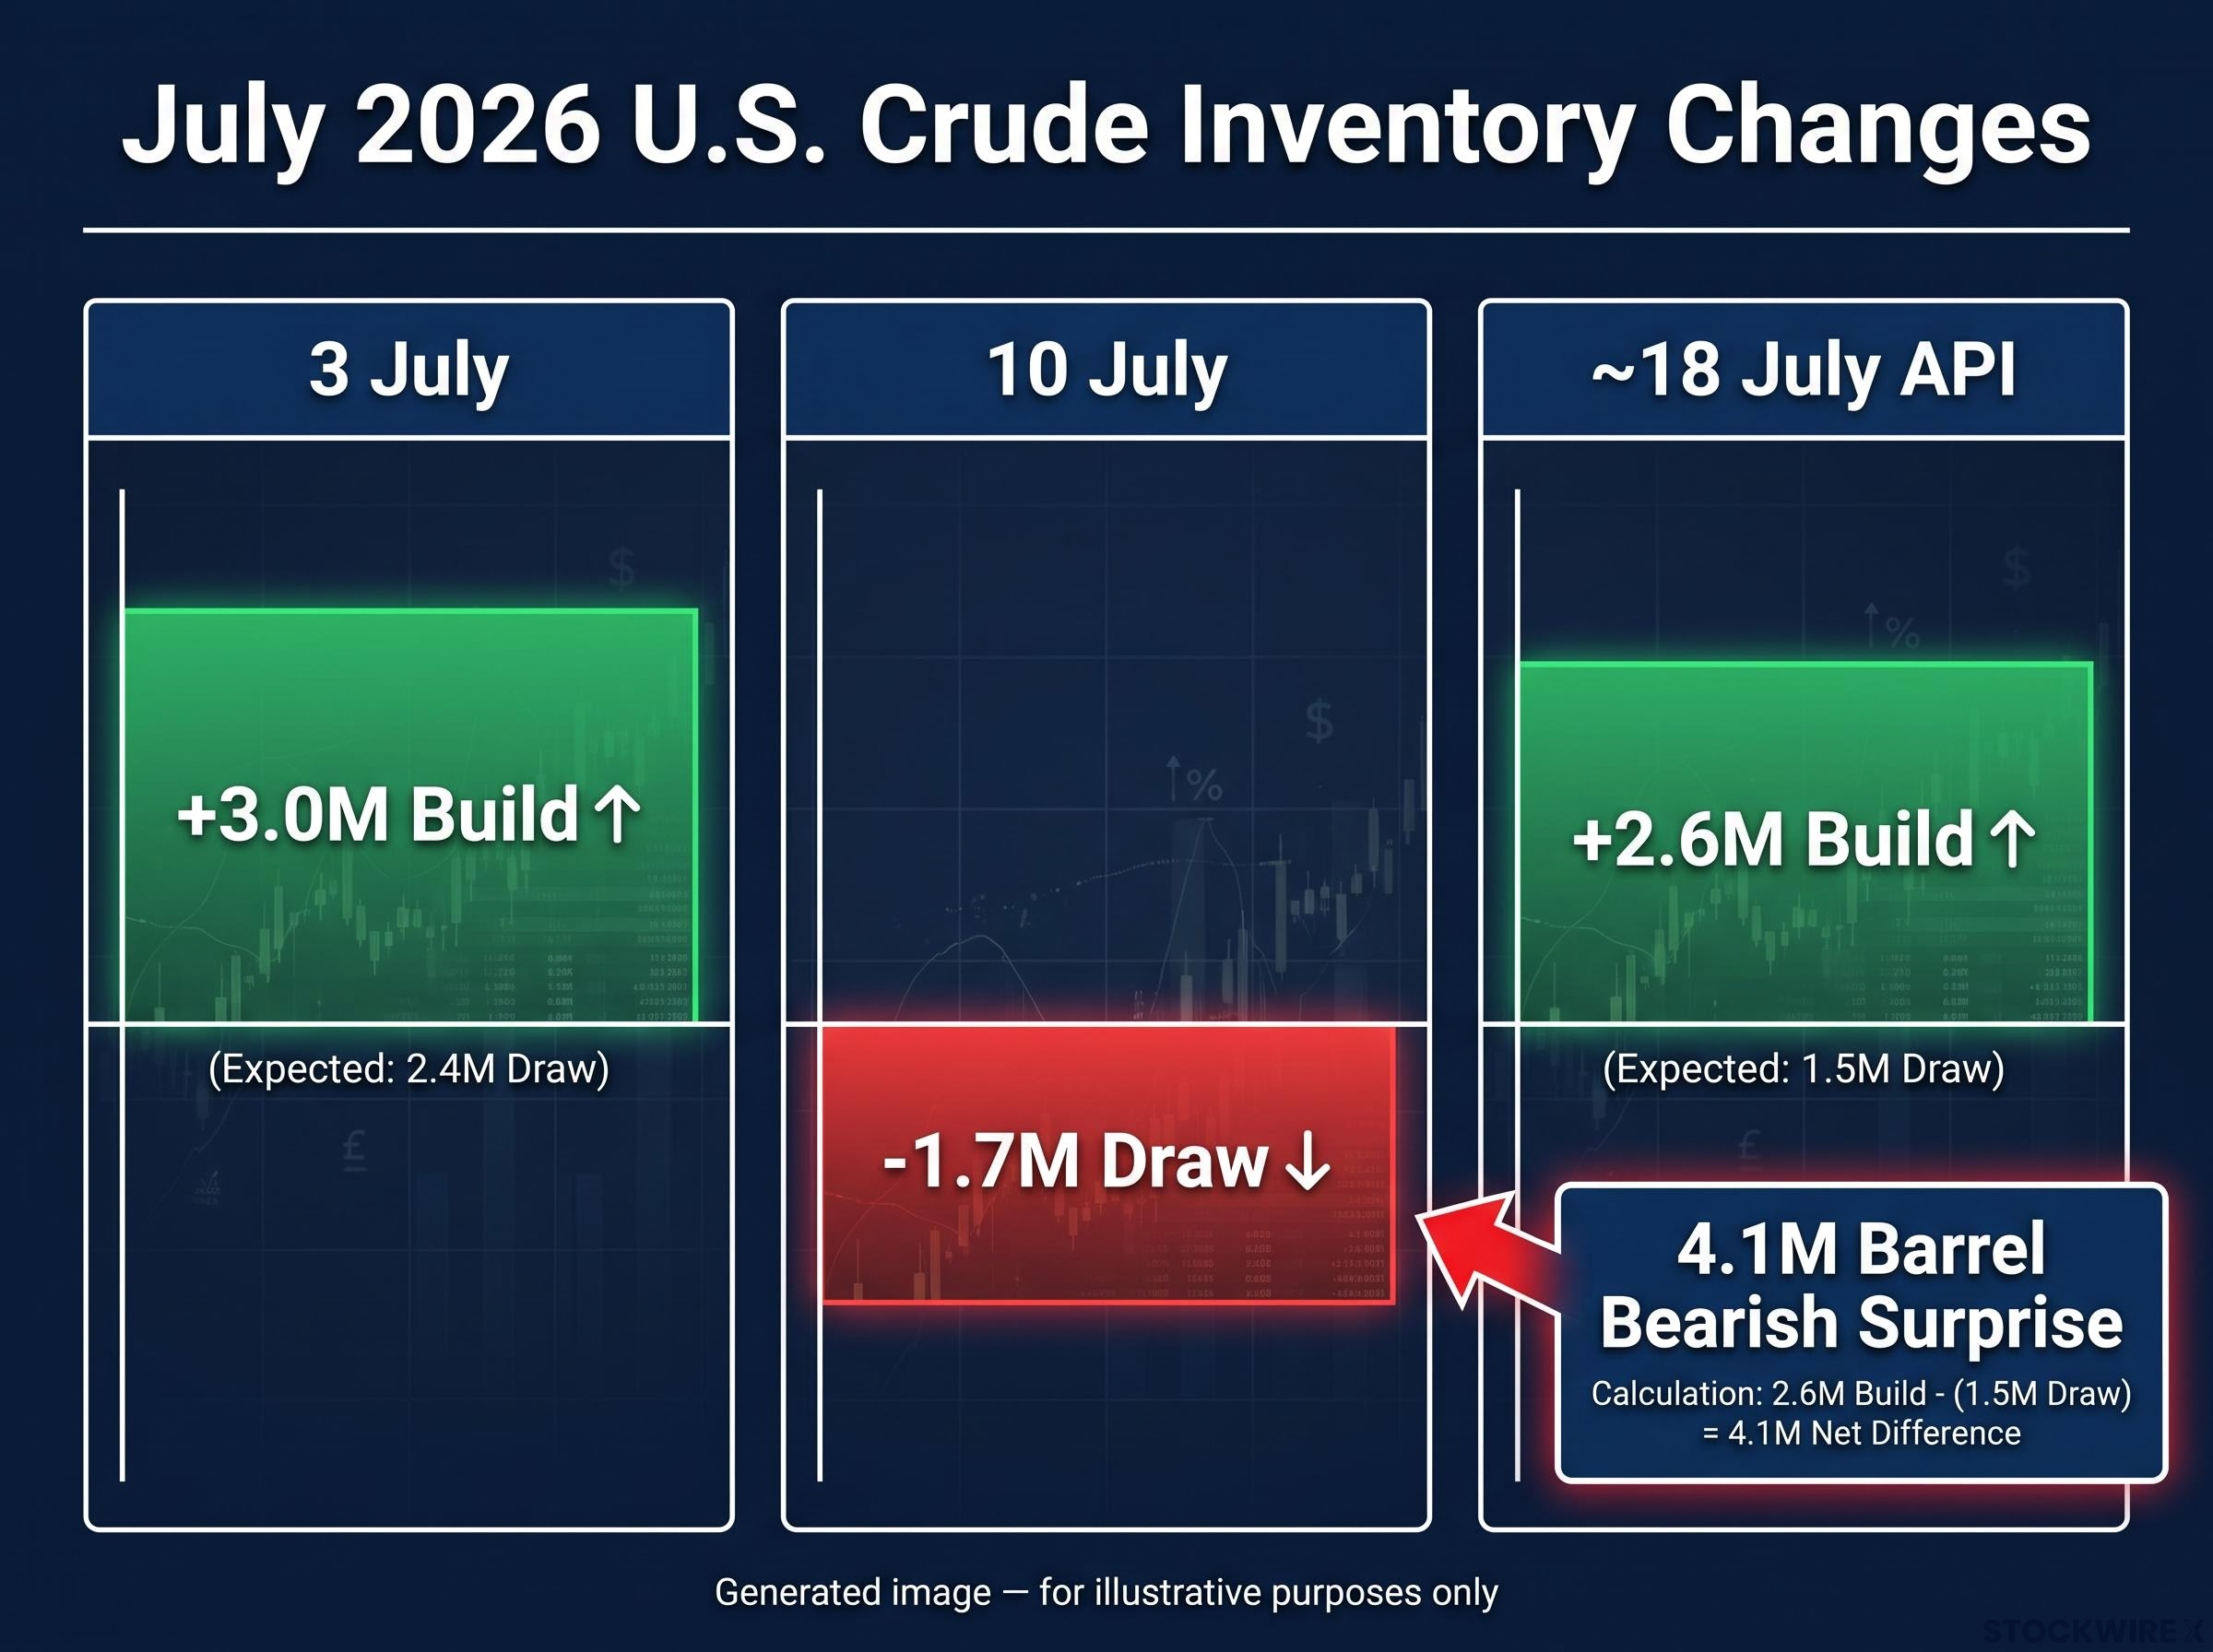
This is not the first bearish surprise in recent weeks. For the week ending 3 July, a 3.0-million-barrel build came in against analyst expectations for a 2.4-million-barrel draw. That makes two material misses in the same direction within a short window.
For your positioning, the practical takeaway is that the API print raises the probability that U.S. fundamentals are shifting away from extreme tightness. But one week of sample data is insufficient to declare a trend reversal, and sizing exposure accordingly is the rational response.
What U.S. crude stockpiles actually look like right now
Before the geopolitical layer arrives, it helps to see the actual inventory trend rather than taking the market’s characterisation of it on faith.
EIA data for the week ending 10 July showed commercial crude inventories at approximately 409.7 million barrels, roughly 6% below the five-year average for this time of year. That level reflected a 1.7-million-barrel draw following the 3.0-million-barrel build in the week ending 3 July. The weeks immediately before the API surprise were themselves mixed.
| Week Ending | EIA Change (million barrels) | vs. Analyst Expectation |
|---|---|---|
| 3 July | +3.0 (build) | Expected 2.4 draw; bearish surprise |
| 10 July | -1.7 (draw) | Resumed draws, but smaller than prior trend |
| ~18 July (API estimate, pending EIA) | +2.6 (build) | Expected 1.5 draw; 4.1 million barrel bearish surprise |
The medium-term pattern had been net draws: inventories peaked near approximately 449.8 million barrels in mid-May and then fell for roughly ten consecutive weeks before the early-July build interrupted the sequence. The EIA’s Short-Term Energy Outlook expects global inventories to keep falling in Q3 2026, but by less than previously forecast, with a shift toward oversupply and inventory accumulation expected from 2027 onward and Brent averaging around $65 per barrel.
The inventory picture tells you that the extreme tightness seen in the first half of 2026 is already softening at the margins, and the EIA’s medium-term outlook suggests this is not a temporary blip but the early phase of a structural supply rebalancing.
The Houthi threat and the geopolitical risk premium pulling prices the other way
While inventory data was printing bearish, the geopolitical signal was pushing the other direction entirely.
The Houthi movement in Yemen, which operates in alignment with Iran, announced plans as of 21 July 2026 to enforce a naval blockade targeting vessels with Saudi connections operating in the Red Sea. A number of oil tankers had already begun rerouting in response. Hostilities in waters around the Strait of Hormuz were adding further pressure, and a prolonged closure of that critical passage would cut into globally available crude volumes and push freight and insurance costs sharply higher.
Iran conflict oil price mechanics from earlier in 2026 showed how quickly Brent could move from a baseline near $72-$74 to a peak above $126, a precedent that frames the current Houthi naval threat as operating within a broader regional disruption pattern rather than as an isolated event.
Inventory data captures what has already happened. Geopolitical threats relate to what might happen. Both can be true simultaneously.
That distinction is the one most market commentary collapses. A war-risk premium is priced on probability, not on realised supply loss. It can be real and significant without contradicting the bearish inventory signal, because the two variables operate on different timescales and through different causal mechanisms. Short-term traders will often trade the headline first, because prices can gap higher rapidly if an incident escalates. Medium-term investors must give equal weight to the inventory trend and the EIA’s supply-demand outlook, because those anchor fair value once the immediate shock passes.
The instinct to resolve the contradiction by picking a side is a common analytical error. Both signals carry weight. The question is not which one is right; it is which timescale you are investing on.
How the inventory-versus-geopolitics split plays out across the energy value chain
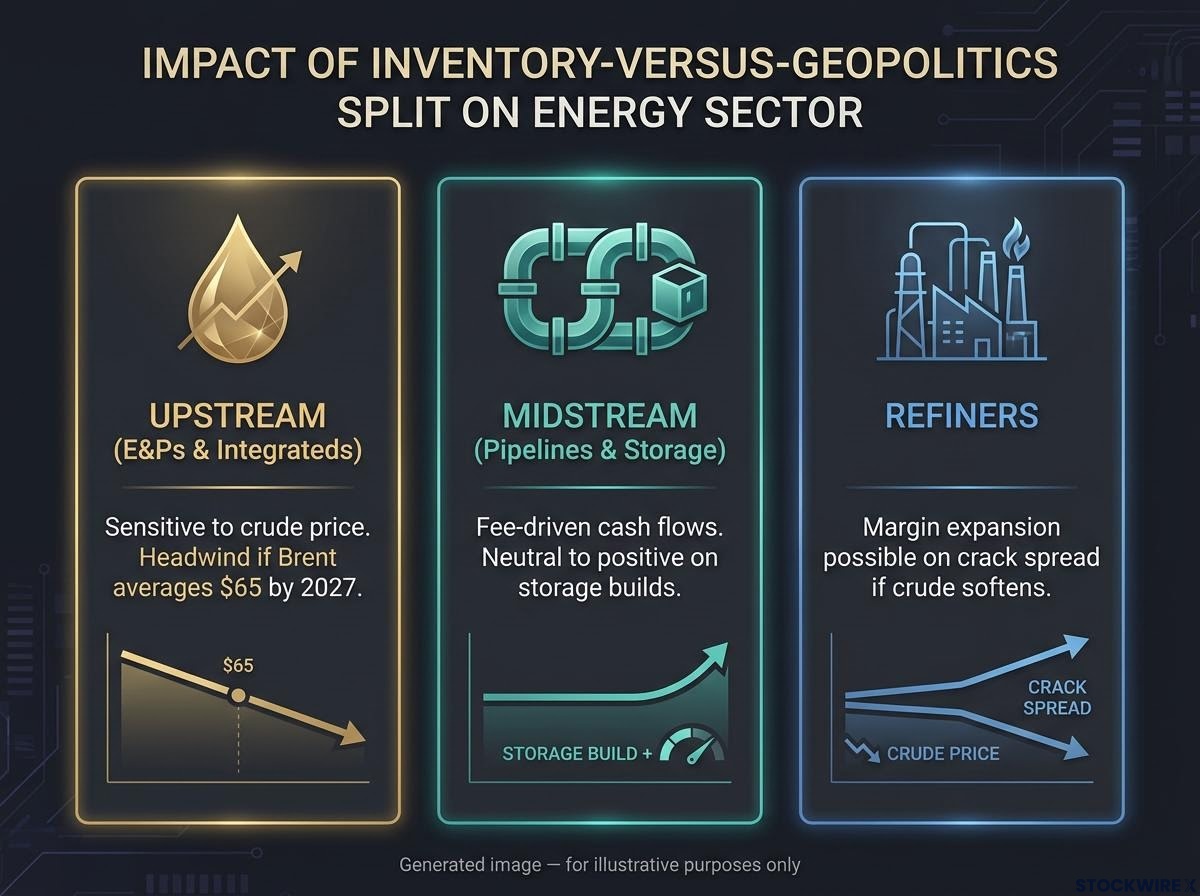
The same macro signal resolves differently depending on where in the energy complex you hold positions:
- Upstream producers (E&Ps and integrateds): Most sensitive to headline crude price. If inventories keep building and the EIA’s oversupply thesis plays out toward 2027, with Brent averaging around $65 per barrel, their earnings leverage to price works against them. War-risk premiums help near-term revenue, but they are volatile and impossible to underwrite as a durable thesis.
- Midstream operators (pipelines, storage, logistics): Often benefit from higher throughput and storage utilisation when inventories build, because more barrels need to move and be stored. Their cash flows are typically fee-driven rather than price-driven, making a modest loosening in balances neutral to positive.
- Refiners: Earnings hinge on the crack spread, the margin between crude input costs and product prices. If crude softens on fundamentals while petrol and distillate demand stays resilient, refiners can see margin expansion even in a period of rising crude inventories.
For equity investors, this means the same inventory surprise can be a headwind for upstream holdings and neutral-to-positive for midstream and refining exposure. Knowing which part of the energy complex you own changes how you should interpret the data.
Energy shock transmission across asset classes has not been uniform: the Hormuz disruption that pushed WTI above $103 per barrel also triggered ECB commentary on rate hike risk and broad declines in Asian equity markets, illustrating how a single commodity supply event can reshape monetary policy expectations and cross-market positioning simultaneously.
What data to watch before drawing any firm conclusions
The analytical tension the API print created will not be resolved by debate. It will be resolved by data. Three specific, observable indicators will tell you which signal is winning over the coming weeks:
- Weekly EIA crude inventory changes. The next two to three releases are the critical window. Two to three consecutive builds would shift the balance of evidence meaningfully toward the bearish fundamental narrative. Continued draws, even if smaller than expected, would suggest the API print was an outlier. Track how far inventories move relative to the five-year average; the further above average they drift, the more room there is for prices to compress.
- WTI and Brent calendar spreads. Contango (where longer-dated contracts trade above near-term ones) signals the market expects inventories to build. Backwardation, where near-term contracts trade higher than longer-dated contracts, signals perceived tightness. These spreads are a real-time, market-derived signal of whether physical traders believe supply is loosening, and you can observe them without waiting for official releases.
- Tanker freight rates and insurance premiums in the Red Sea and Strait of Hormuz. Rising costs signal that the war-risk premium is being treated as durable rather than transient. Falling costs signal that the market views the Houthi threat as contained. These are live proxies for how seriously the market is pricing geopolitical risk.
The EIA expects global inventories to keep falling in Q3 2026, but by less than previously forecast. That baseline is the benchmark against which you should measure every incoming weekly print.
What the data split means for how to hold energy exposure right now
The inventory surprise is a real bearish fundamental signal. It has increased the probability that U.S. supply tightness is past its peak. But it has not been confirmed by the EIA, and it does not invalidate the geopolitical risk premium while the Houthi threat remains active.
In practical terms, the surprise argues against aggressively adding to long crude positions at current prices, while the geopolitical backdrop argues against large unhedged short positions. Balanced, modest exposure and options-based positioning represent the most defensible stance until two to three more EIA prints clarify the trend.
The longer-arc view sharpens the picture further. If the EIA’s medium-term trajectory toward oversupply in 2027 plays out, the structural case for holding large crude or upstream equity positions weakens. Investors who start monitoring the inventory trend now, using the three indicators above, are positioning themselves to act before that shift is fully priced. The right response to conflicting signals is not to pick a side. It is to size exposure conservatively and let the next several weeks of data resolve the question on its own terms.
For investors exploring how to structure a portfolio around a potential oil price decline as fundamentals soften, our full explainer on the barbell strategy for oil-down positioning examines how institutional managers are pairing reduced energy producer exposure with AI and cyclical allocations ahead of a projected crude price reversal.
This article is for informational purposes only and should not be considered financial advice. Investors should conduct their own research and consult with financial professionals before making investment decisions. Past performance does not guarantee future results. Financial projections are subject to market conditions and various risk factors.