
Nasdaq Falls 4% as Broadcom AI Miss Sparks Semiconductor Rout
6 hrs ago
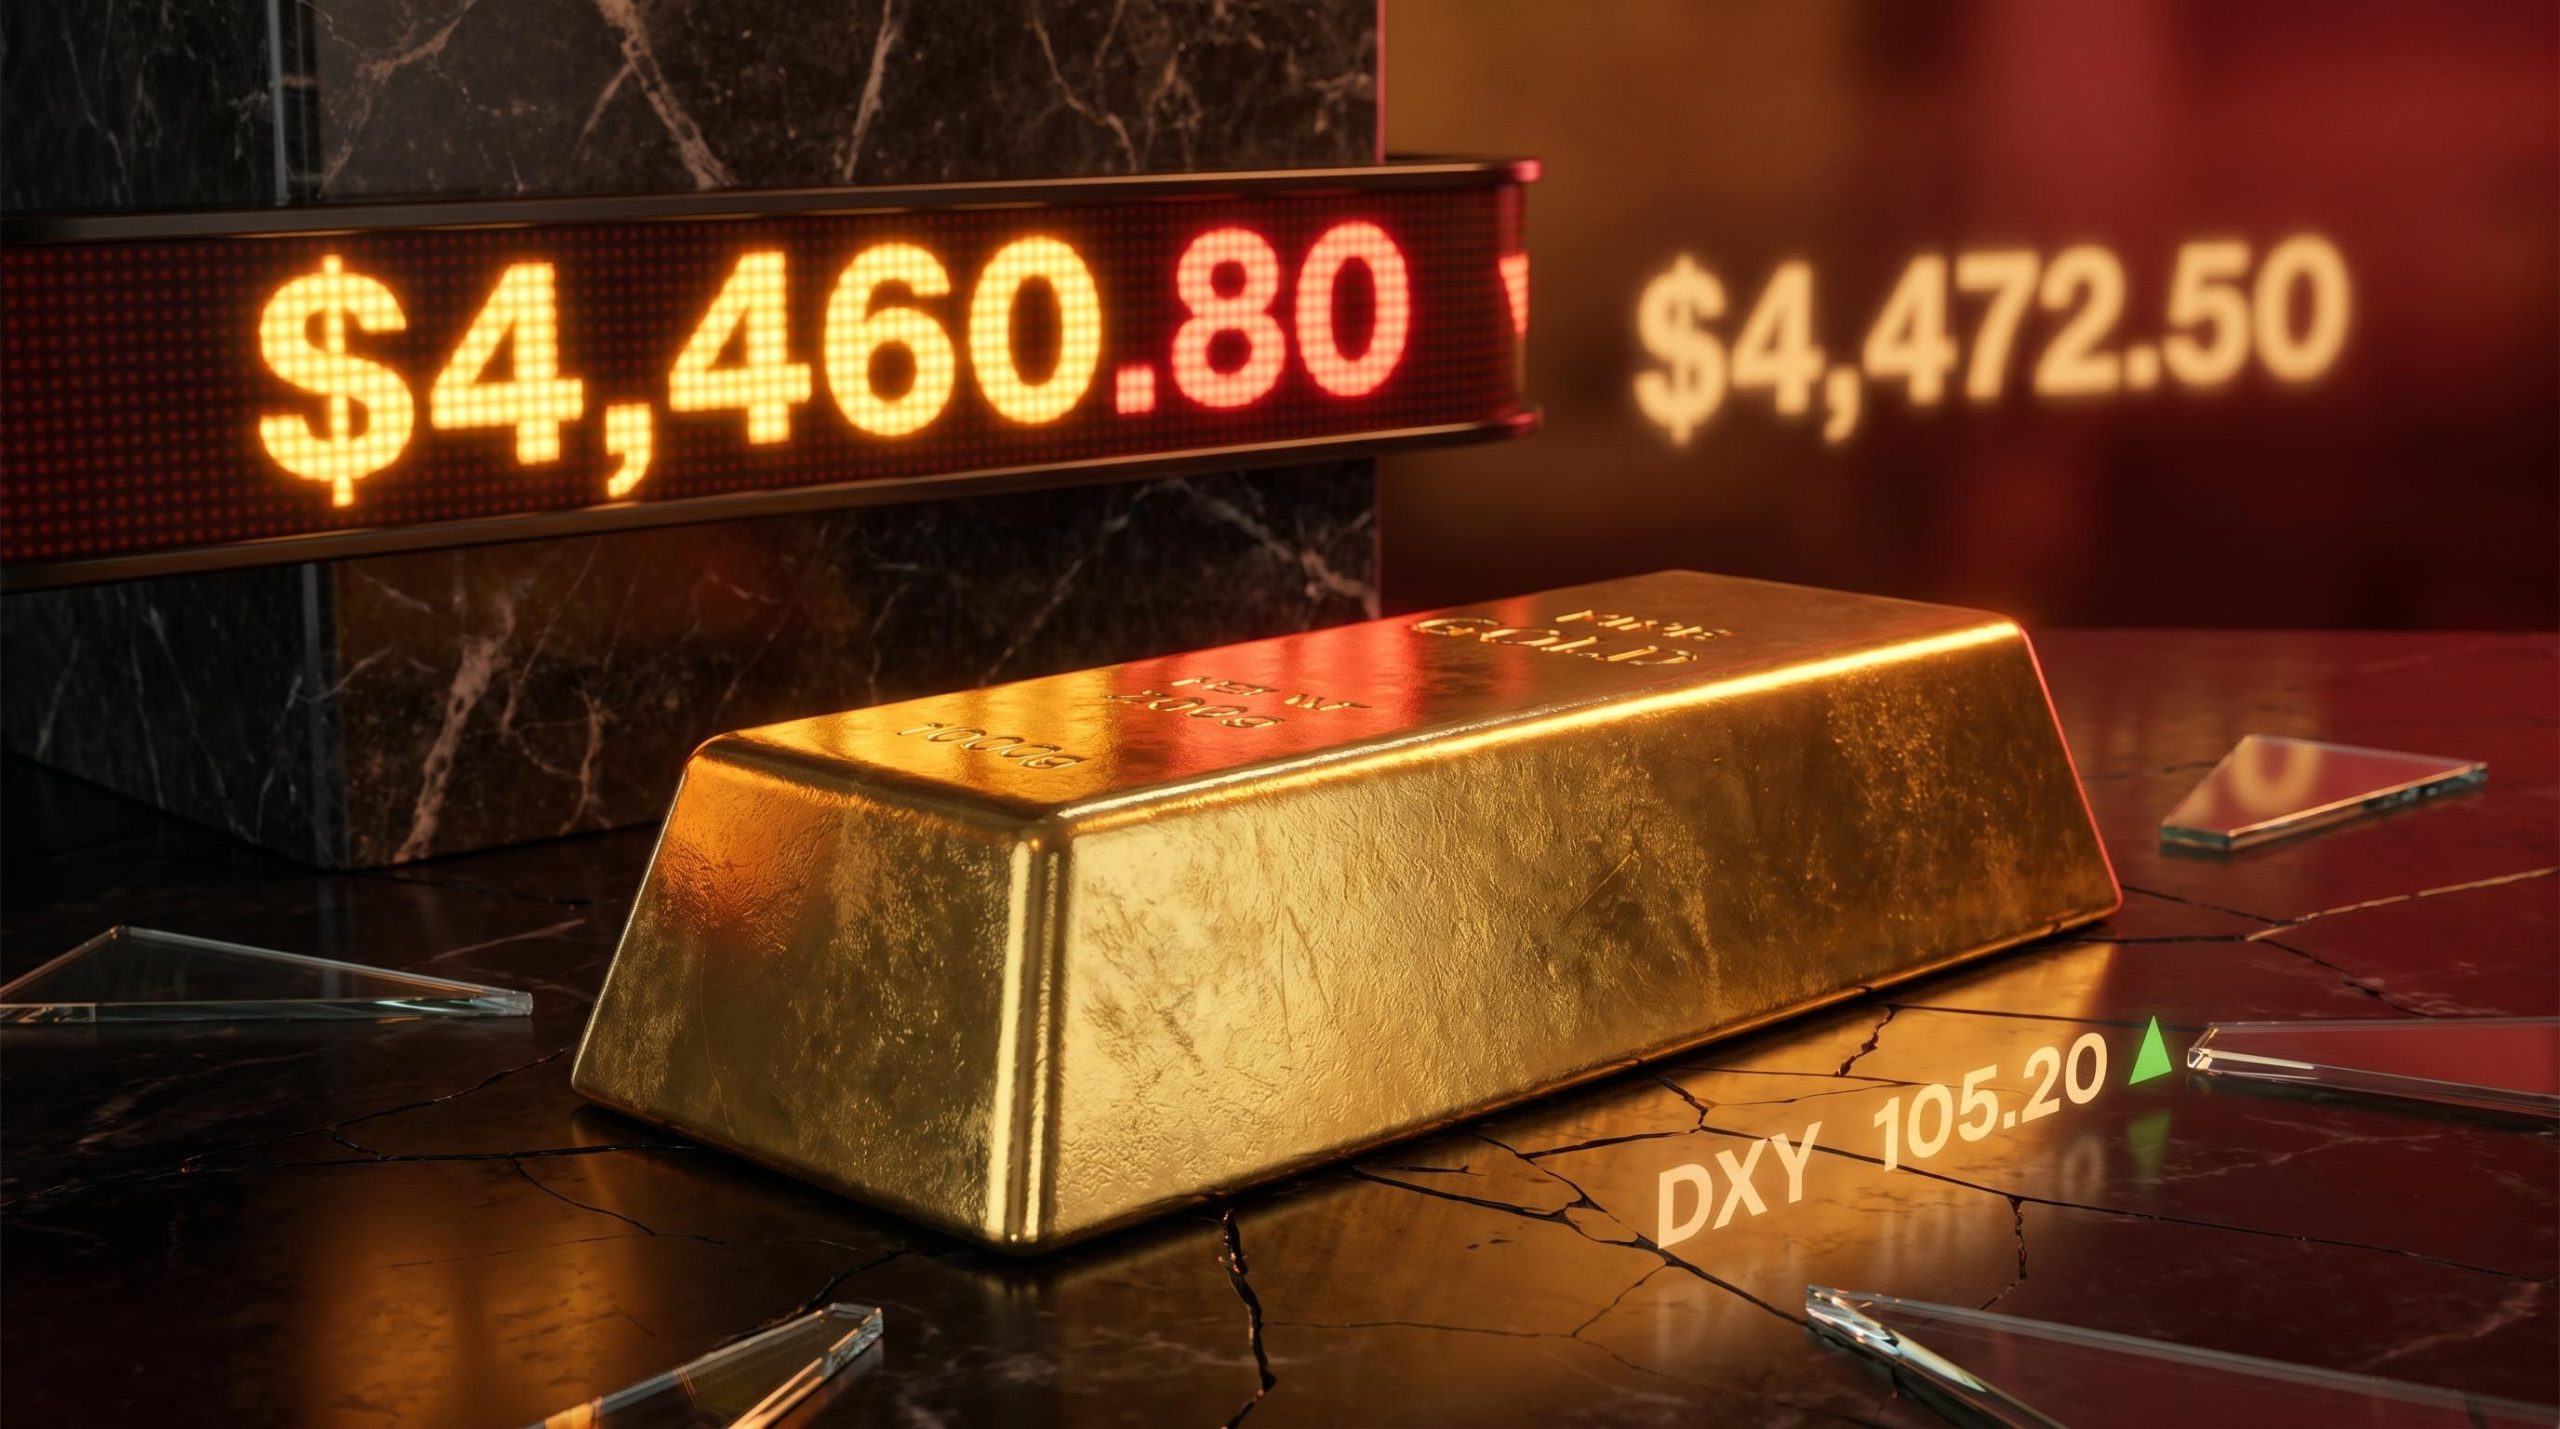
Spot gold climbed 0.6% to $4,460.80 per ounce during Asian trading on 3 June 2026, recovering from a prior-session decline of more than 1% that had marked the sharpest single-day drop in weeks. The bounce was narrow and contested. Middle East de-escalation signals and a softer dollar provided brief relief, but stronger-than-expected U.S. labour data and persistent Federal Reserve rate-hold expectations reasserted downward pressure within hours, leaving gold traders in a holding pattern ahead of Friday’s nonfarm payrolls release.
What follows maps the three forces currently driving gold’s choppy price action, explains why the upcoming jobs report is the inflection point traders are watching, and places the broader precious metals complex, including silver and platinum, in context for U.S. investors navigating an unusually noisy macro environment.
The scale of the prior-session loss set the tone. On 2 June 2026, spot gold fell more than 1% as the U.S. Dollar Index surged to a two-month peak, compressing gold prices with the speed that has defined this market’s recent behaviour. For holders of the metal, the drop erased several sessions’ worth of gains in a single afternoon.
The recovery that followed on 3 June was real, but conditional. As the dollar slipped 0.1% during Asian hours, gold recaptured ground:
$4,460.80 per ounce: the spot price anchor from the 3 June Asian session recovery, before profit-taking trimmed gains the following day.
By European and early U.S. hours on 4 June, modest profit-taking and a firming dollar had pushed spot back toward $4,448, illustrating how quickly the recovery’s gains could compress. The bounce was partial, not decisive, and the speed of the reversal underscores gold’s current hypersensitivity to dollar moves. A 0.1% dip in the Dollar Index was enough to swing gold 0.6% in a single session, a ratio that clarifies just how tightly the two assets are linked in the present environment.
The World Gold Council analysis of gold’s currency relationship documents the historical pattern by which dollar strength compresses gold valuations, providing the evidence base for why a 0.1% move in the Dollar Index translated into a 0.6% swing in spot gold within a single Asian session.
The geopolitical backdrop that fed gold’s safe-haven bid intensified on a single day. Three separate escalatory events unfolded on 2 June 2026, each adding a layer of risk:
The concentration of events across multiple theatres reinforced the scale of the conflict and pushed safe-haven demand higher heading into the evening session.

Late on 2 June 2026, Washington announced a conditional ceasefire framework between Israel and Lebanon, with implementation dependent on Hezbollah ceasing its military activities. The announcement introduced a measure of relief, but the conditionality mattered.
Conditional ceasefires tend to reduce the geopolitical risk premium in gold rather than eliminate it. Active hostilities continued despite the framework’s announcement, and investor caution persisted accordingly. Oil prices retreated during Asian trading on 3 June, ending a three-session streak of gains. That pullback eased near-term energy-cost inflation concerns, which provided indirect support to gold by softening one component of the broader inflationary picture. Lower energy costs subtly shift the macro calculus for rate-sensitive assets, even when the geopolitical threat itself remains unresolved.
Gold does not pay interest or dividends. It is a non-yielding asset, which means that when interest rates remain elevated, the opportunity cost of holding gold rises relative to yield-bearing alternatives such as government bonds or money market funds. In practical terms, every month the Federal Reserve holds rates at current levels is a month in which gold competes at a structural disadvantage against assets that generate income.
The mechanism behind this week’s volatility is not new: bond yields and dollar pressure on gold have operated in tandem across multiple episodes in 2026, with rising real Treasury yields increasing the opportunity cost of holding a non-yielding asset while a firming dollar simultaneously makes bullion more expensive for international buyers.
That framework explains why two data releases on 2 June 2026 capped gold’s recovery before it could gain momentum.
| Data Release | Result | Gold Market Implication |
|---|---|---|
| ADP May 2026 private payrolls | +122,000 jobs, above analyst forecasts | Reinforced expectations of a prolonged Fed rate hold, raising the opportunity cost of holding gold |
| ISM services prices-paid | Highest level since 2022, driven by petroleum products and other commodities | Added inflationary pressure that makes near-term Fed rate cuts less likely, extending the rate headwind for gold |
ISM services prices-paid at its highest since 2022: the most forward-looking inflationary signal from the 2 June data releases, suggesting cost pressures in the services sector have not yet peaked.
The ADP beat and the ISM inflation reading together explain why gold’s 3 June recovery was capped rather than sustained. For U.S. investors tracking precious metals, every strong labour or inflation print effectively resets the ceiling on gold’s near-term upside. Until that data flow reverses, the rate environment remains the dominant structural headwind.
Gold did not move alone on 3 June. Silver and platinum recorded parallel gains during the same Asian session, and the synchronised movement carries its own signal:
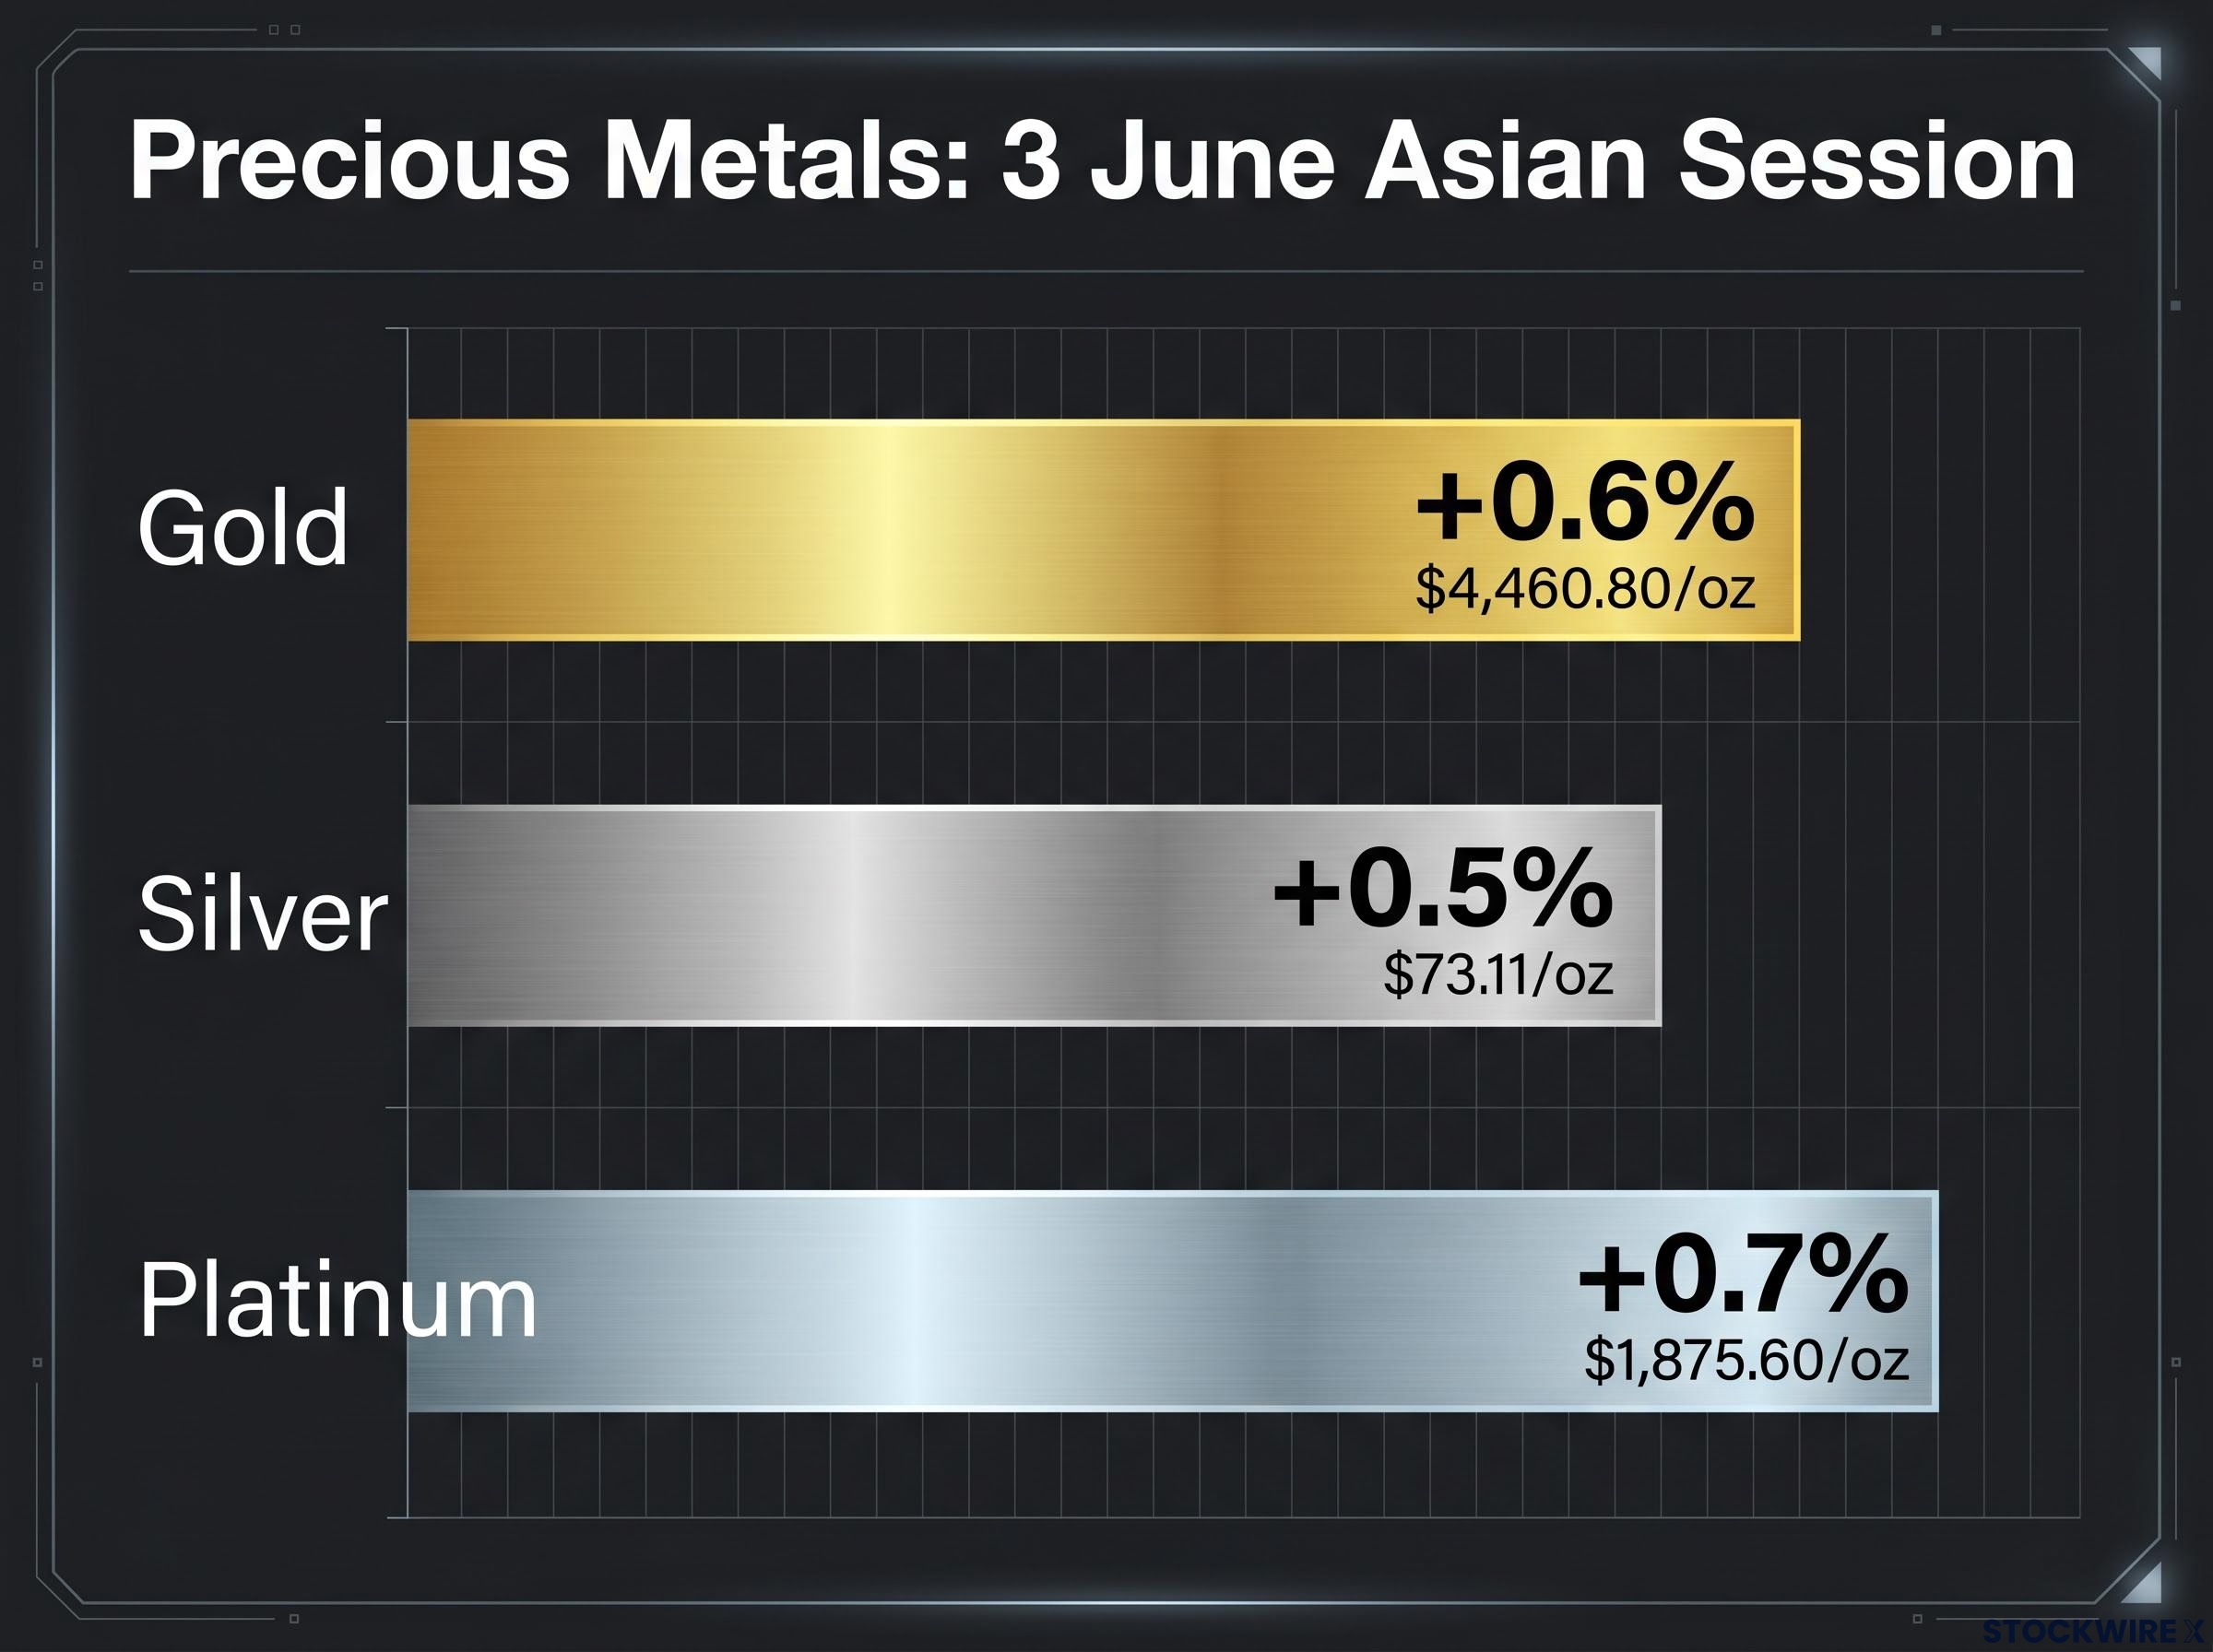
Silver has significant industrial demand exposure, particularly in electronics and solar panel manufacturing. Platinum’s demand profile is weighted toward automotive catalytic converters and industrial applications. During risk-off episodes driven purely by safe-haven flows into gold, silver and platinum often diverge because their industrial demand components pull in the opposite direction.
Their alignment on 3 June is therefore telling. When all three metals move together, the driver is typically a shared macro factor, in this case dollar softness and geopolitical relief, rather than gold-specific safe-haven positioning. That distinction matters for U.S. investors assessing whether the move represents a durable shift in precious metals demand or a short-term currency-driven bounce. The breadth of the rally points toward the latter.
The three forces that shaped this week’s gold action, geopolitics, the dollar, and rate expectations, all converge on a single data point: the May 2026 nonfarm payrolls report from the Bureau of Labor Statistics, due on 5 June 2026.
The Bureau of Labor Statistics employment release schedule confirms 5 June 2026 as the official publication date for the May Employment Situation report, the single data point that market participants across the precious metals complex are treating as the week’s primary directional trigger.
The directional logic is straightforward, and the reader is now equipped to interpret either outcome:
The ADP beat and ISM services inflation data have already tilted market expectations toward a resilient reading. That positioning raises the threshold for a genuine downside surprise, meaning the payrolls number would need to miss forecasts by a meaningful margin to materially lift gold.
The ADP figure needs to be read alongside underlying labour market weakness that headline payroll beats can obscure: the three-month average of just 48,000 jobs per month through April 2026 and simultaneous contraction in both ISM Manufacturing and ISM Services Employment indices suggest a labour market that is stabilising rather than genuinely accelerating.
Even if the nonfarm payrolls print lands in ambiguous territory, the dollar’s immediate reaction to the release will serve as the first indicator of which direction gold is likely to follow. The transmission mechanism has been visible all week: the Dollar Index hit a two-month peak on 2 June, gold fell more than 1%; the index slipped 0.1% on 3 June, gold recovered 0.6%.
That speed of transmission means the dollar’s first move after the 5 June release will likely telegraph gold’s direction before the broader market has finished digesting the headline number.
Three competing forces defined gold’s price action across 3-4 June 2026: Middle East de-escalation signals and a softer dollar provided upward support, while strong U.S. labour and inflation data reinforced Federal Reserve rate-hold expectations and applied a ceiling. The synchronised gains across gold, silver, and platinum point to macro dollar softness as the primary driver rather than durable safe-haven demand.
Friday’s May 2026 nonfarm payrolls report is the next inflection point. The ADP data makes a strong reading the higher-probability scenario, which would likely cap gold’s near-term upside. The dollar’s immediate reaction to the release and the headline jobs number itself are the two most actionable signals for precious metals direction in the sessions ahead.
For investors tracking what major institutions see as the longer-term trajectory beyond this week’s volatility, our detailed coverage of institutional gold price targets for 2026 examines Goldman Sachs’s $5,400 per ounce forecast, the structural central bank demand floor, and the specific conditions under which Wall Street’s higher-end targets above $6,000 would require validation.
This article is for informational purposes only and should not be considered financial advice. Investors should conduct their own research and consult with financial professionals before making investment decisions. Past performance does not guarantee future results. Financial projections are subject to market conditions and various risk factors.
Because gold pays no interest or dividends, holding it becomes relatively less attractive when rates are elevated, since yield-bearing assets like government bonds or money market funds offer income that gold cannot match. Every month the Federal Reserve holds rates at current levels extends this structural disadvantage for gold.
A 0.1% slip in the U.S. Dollar Index during Asian trading hours on 3 June 2026, combined with Middle East de-escalation signals following a conditional ceasefire framework between Israel and Lebanon, provided enough relief to push spot gold up 0.6% to $4,460.80 per ounce. The recovery was partial and quickly trimmed by profit-taking and a firming dollar later that day.
A stronger-than-expected payrolls reading would reinforce Federal Reserve rate-hold expectations, raise the opportunity cost of holding gold, and likely cap near-term upside for the metal. A weaker-than-expected result would increase hopes for an earlier rate cut, soften the dollar, and potentially push gold back above the $4,460 level.
When all three precious metals gain simultaneously, the driver is typically a shared macro factor such as dollar softness rather than gold-specific safe-haven demand. Their aligned gains on 3 June 2026 pointed to a currency-driven bounce rather than a durable shift in precious metals demand.
Gold and the U.S. dollar move in opposite directions because a stronger dollar makes bullion more expensive for international buyers, compressing demand and prices. On 2 June 2026, the Dollar Index surged to a two-month peak and gold fell more than 1%; a 0.1% pullback the following day was enough to swing gold 0.6% higher, illustrating the tight link between the two assets.


