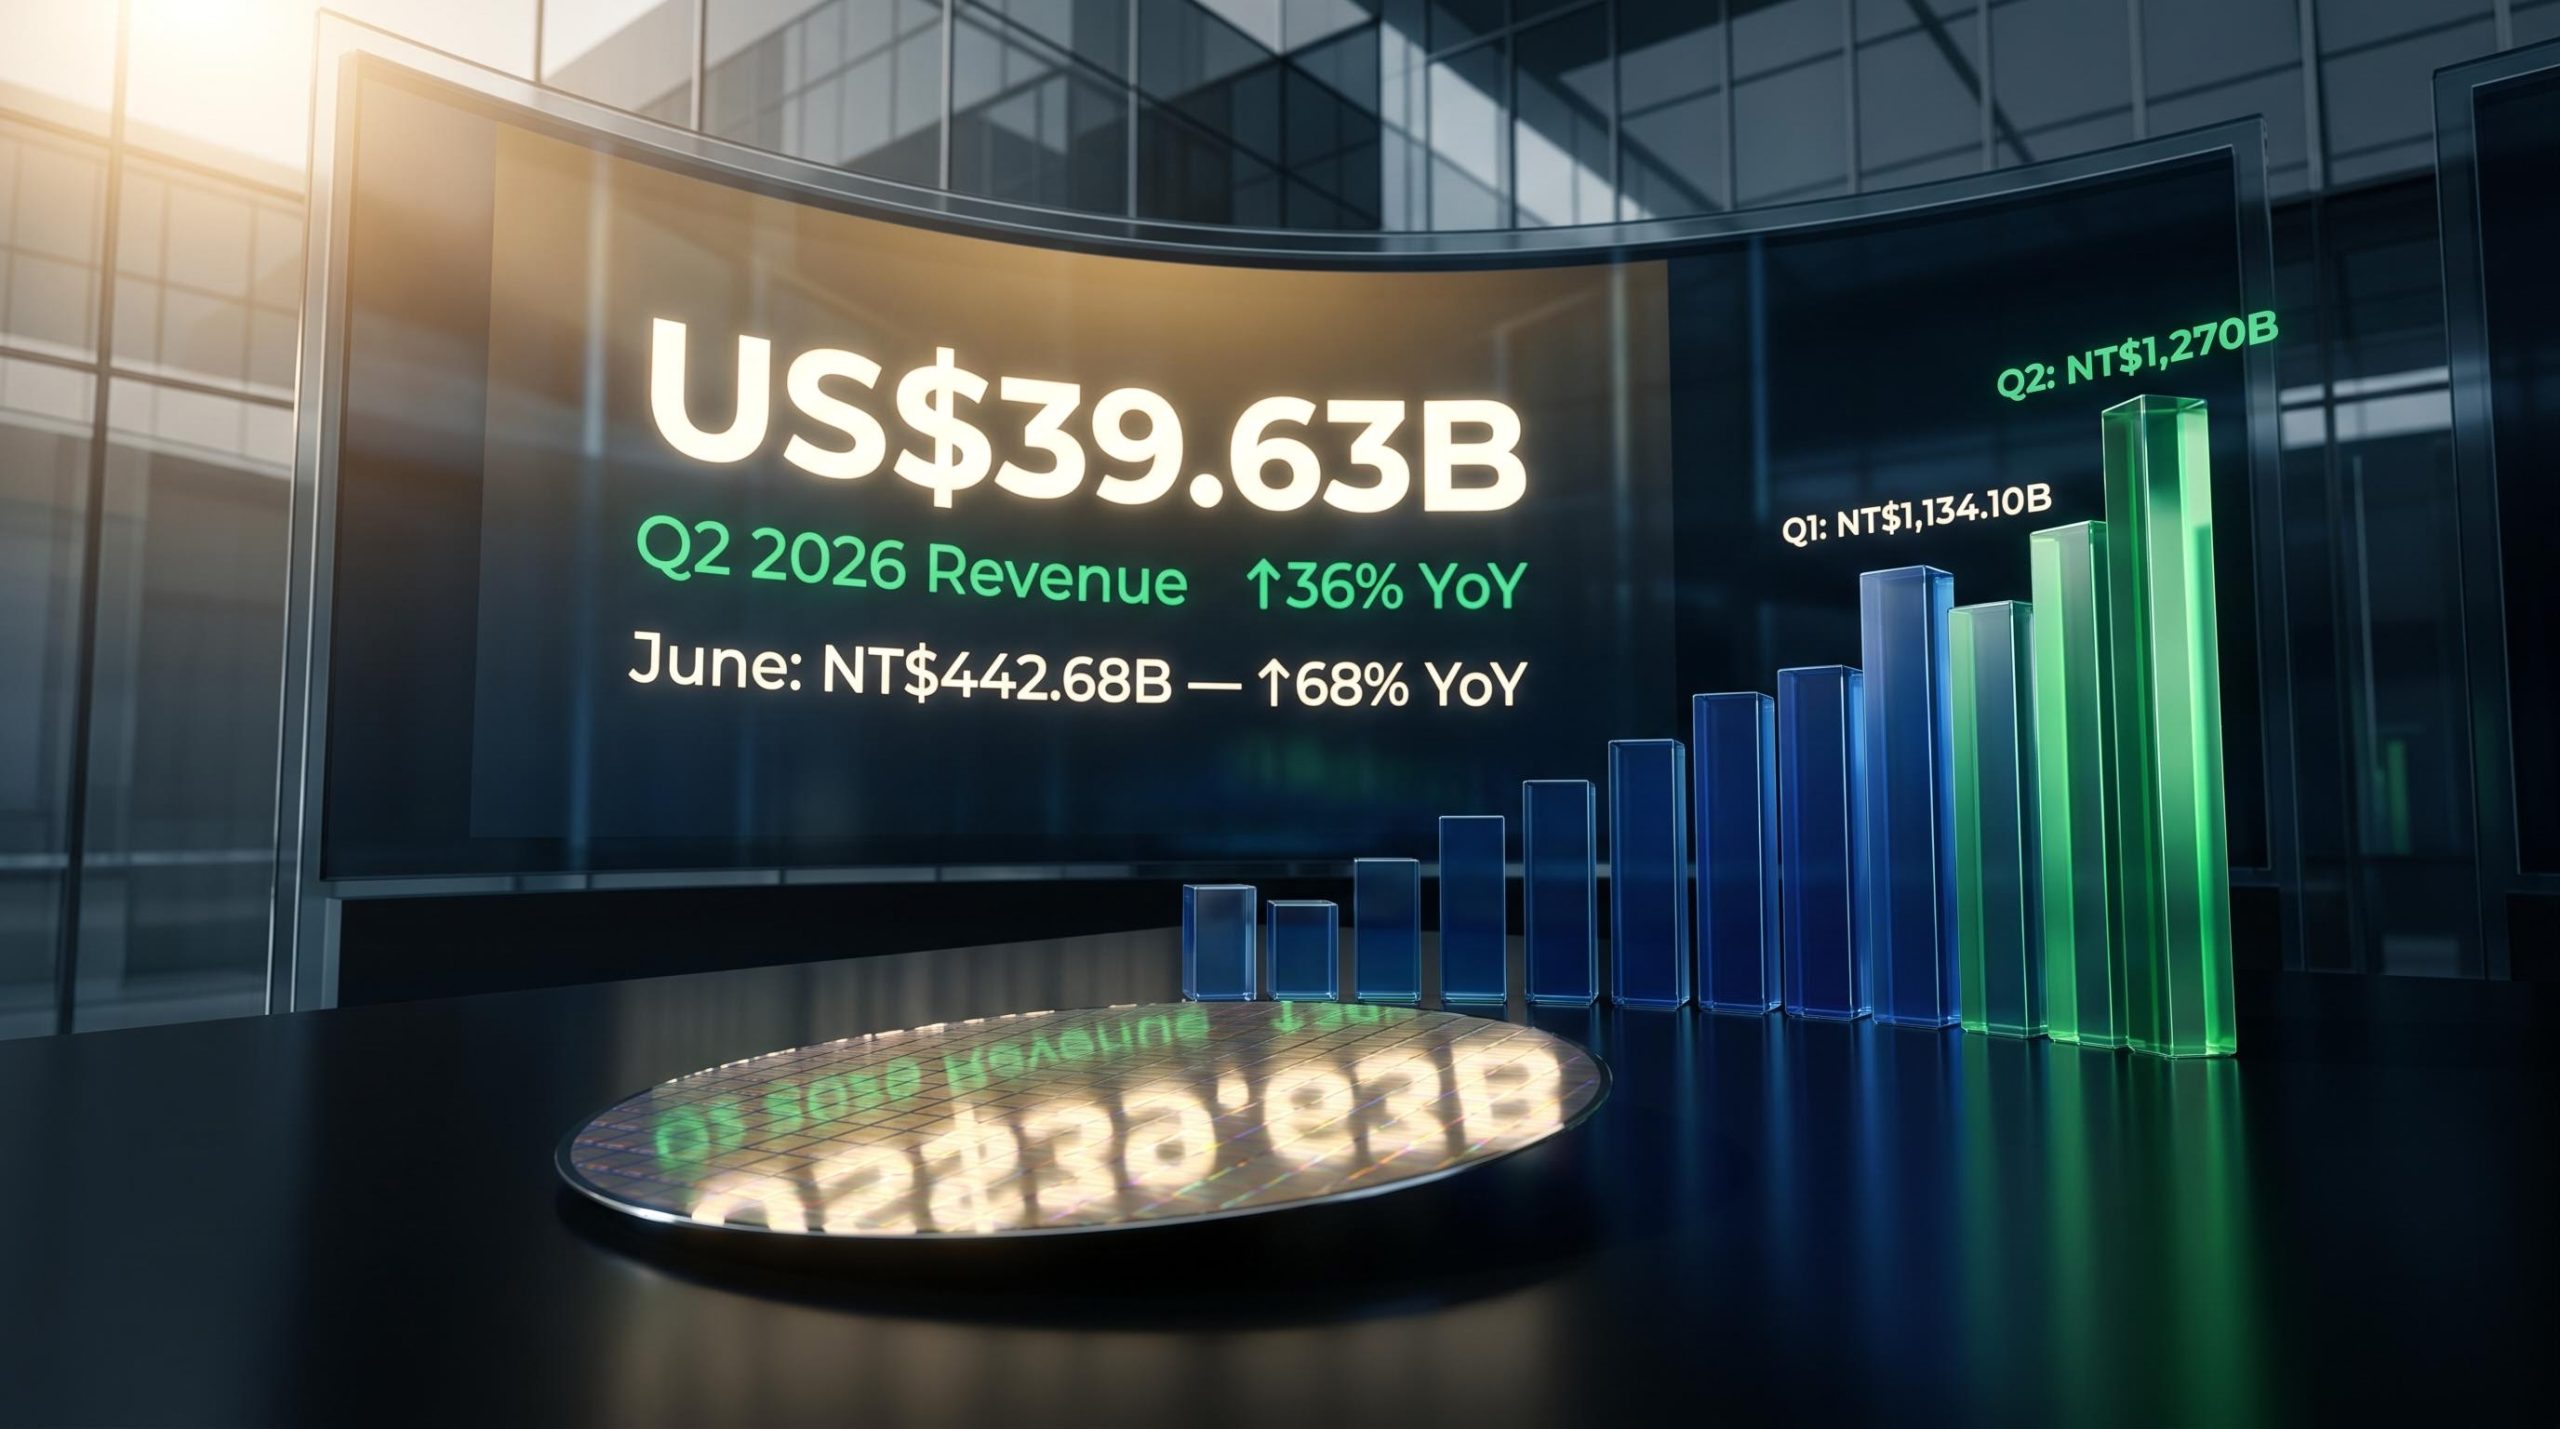
TSMC posted Q2 2026 revenue of approximately US$39.63 billion, a 36% year-over-year surge that marks the company’s largest quarterly sales figure on record. The full earnings release lands on Thursday, 16 July, before market open, and with it comes every number that revenue alone cannot supply.
Investing.com’s aggregation of TSMC’s monthly sales disclosures puts the top-line figure at NT$1.270 trillion for the quarter. It does not confirm gross margins, net income, earnings per share, or the forward guidance that typically moves the stock. That gap between what is known and what is pending is the reason the next 72 hours matter more than the headline.
Here is exactly what the revenue numbers confirm, what they leave open, and which signals to prioritise when the full 16 July release arrives.
A record quarter by the numbers
Start with the headline: quarterly sales of NT$1.270 trillion, equivalent to roughly US$39.63 billion, for year-over-year growth of 36%. That figure alone would make Q2 TSMC’s strongest quarter on record by revenue. The context makes it more interesting.
June alone: NT$442.68 billion, the quarter’s closing month, which recorded a year-over-year jump of nearly 68% and stands as the single strongest monthly reading of the three-month period.
That June acceleration matters. A quarter that fades into its final month suggests demand normalisation. A quarter that spikes 68% in its closing month suggests the opposite: orders were still building, not levelling off, as Q2 ended. TSMC held back the June data until Monday after Typhoon Bavi forced a postponement of the Friday publication that had originally been scheduled.
The broader trajectory confirms this is not a one-quarter event:
- H1 2026 cumulative revenue totalled NT$2.40 trillion, reflecting growth of close to 36% against the same period a year earlier
- Q1 2026 revenue came in at NT$1,134.10 billion (approximately US$35.9 billion), up 35.1% year-over-year, with net income and EPS rising 58.3%
| Quarter | Revenue (NT$) | Revenue (US$) | YoY Growth |
|---|---|---|---|
| Q1 2026 | NT$1,134.10 billion | ≈US$35.9 billion | 35.1% |
| Q2 2026 | NT$1,270 billion | ≈US$39.63 billion | ~36% |
Sequential acceleration from 35.1% to 36% growth, combined with that 68% June spike, tells you momentum did not fade as the quarter closed. That is the opposite of what a demand-normalisation story would look like at this point in the AI cycle.
When big ASX news breaks, our subscribers know first
How these results measure up against guidance and analyst expectations
The numbers are large, but the more precise question is whether they are surprising. The answer is nuanced.
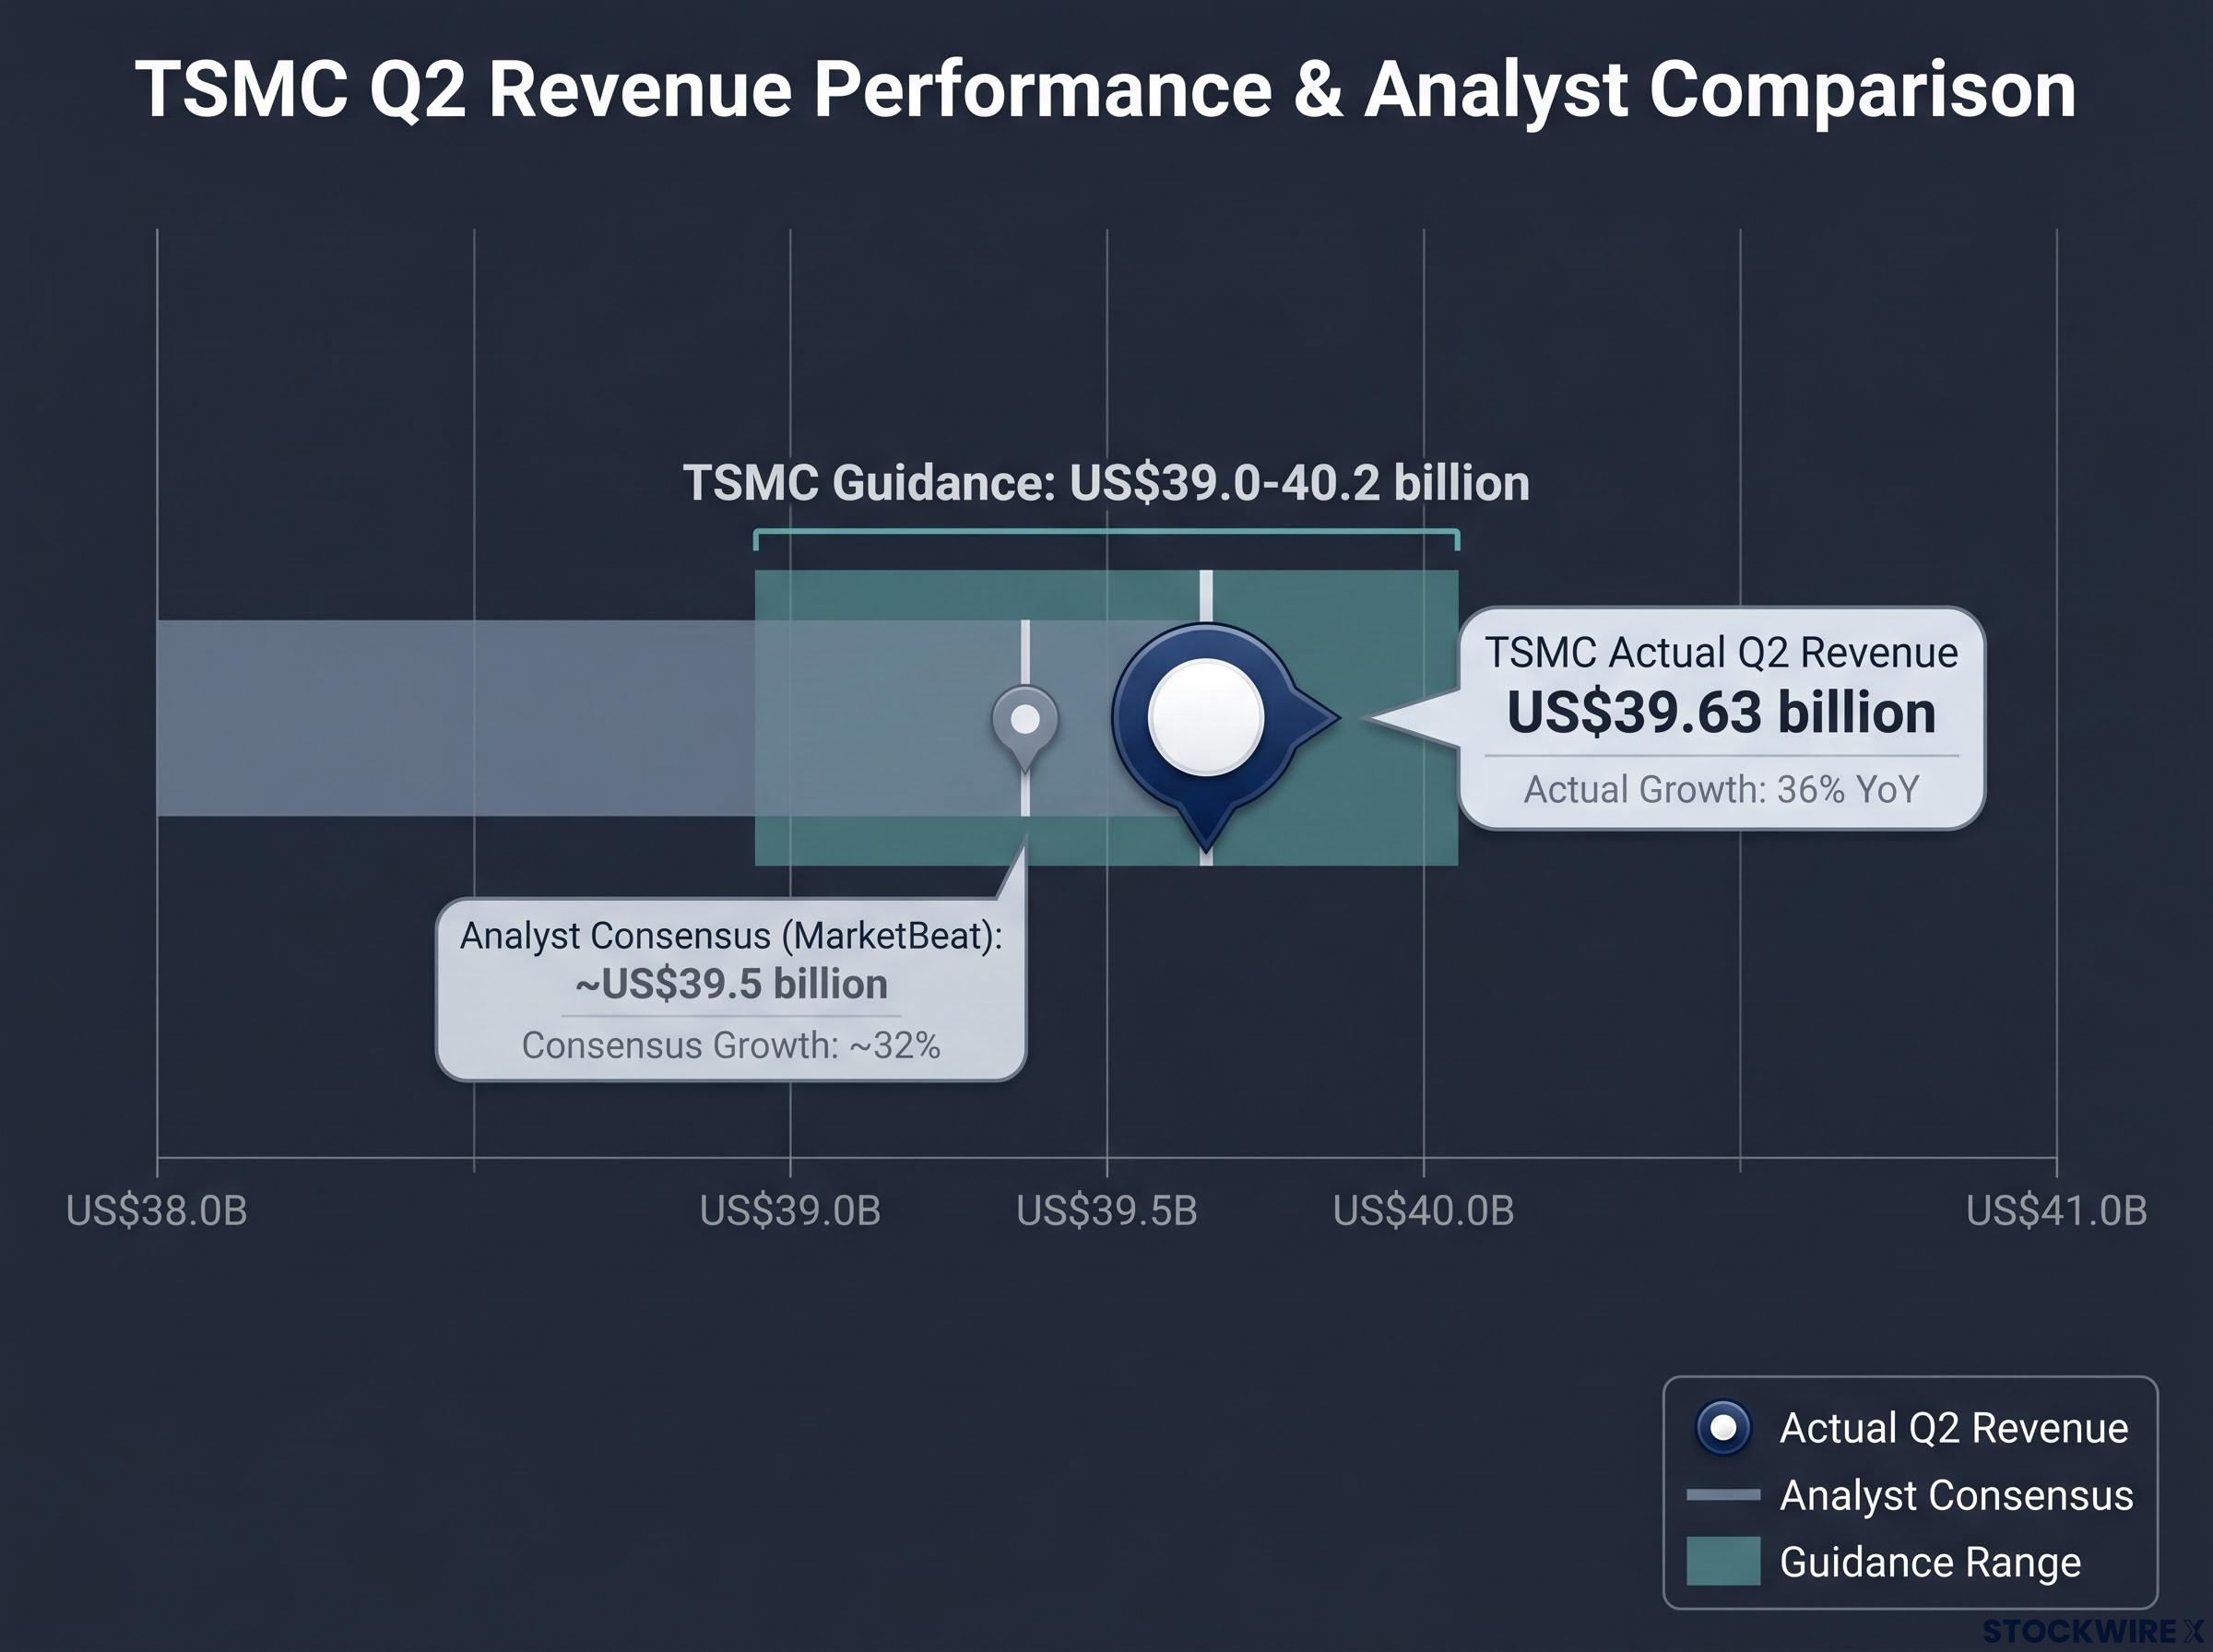
- TSMC’s official Q2 guidance range: US$39.0-40.2 billion
- Analyst consensus (per MarketBeat): approximately US$39.5 billion
- Reported figure: approximately US$39.63 billion
The reported revenue sits almost exactly in the middle of TSMC’s own guidance range and marginally above consensus. On an absolute dollar basis, this is an in-line result.
What the growth rate comparison shows
The more constructive signal sits in the growth rate. Analyst consensus had projected approximately 32% year-over-year growth for Q2. The actual figure came in closer to 36%, a meaningful spread when applied to a revenue base of nearly US$40 billion. Forbes’ earnings preview had framed results as “approaching $40 billion,” consistent with that lower growth assumption.
For investors, slightly ahead of growth consensus on revenue is constructive but not a game-changer on its own. The real verdict still belongs to margin figures and forward guidance that only the 16 July release will provide.
Analyst price target revisions ahead of the 16 July release have already reflected elevated expectations, with UBS raising its target 13% to T$3,400 on 28 June 2026 and framing the earnings call as a thesis confirmation event rather than a risk, a framing that makes any miss on margin guidance proportionally more painful for sentiment.
Why AI chip demand is doing the heavy lifting
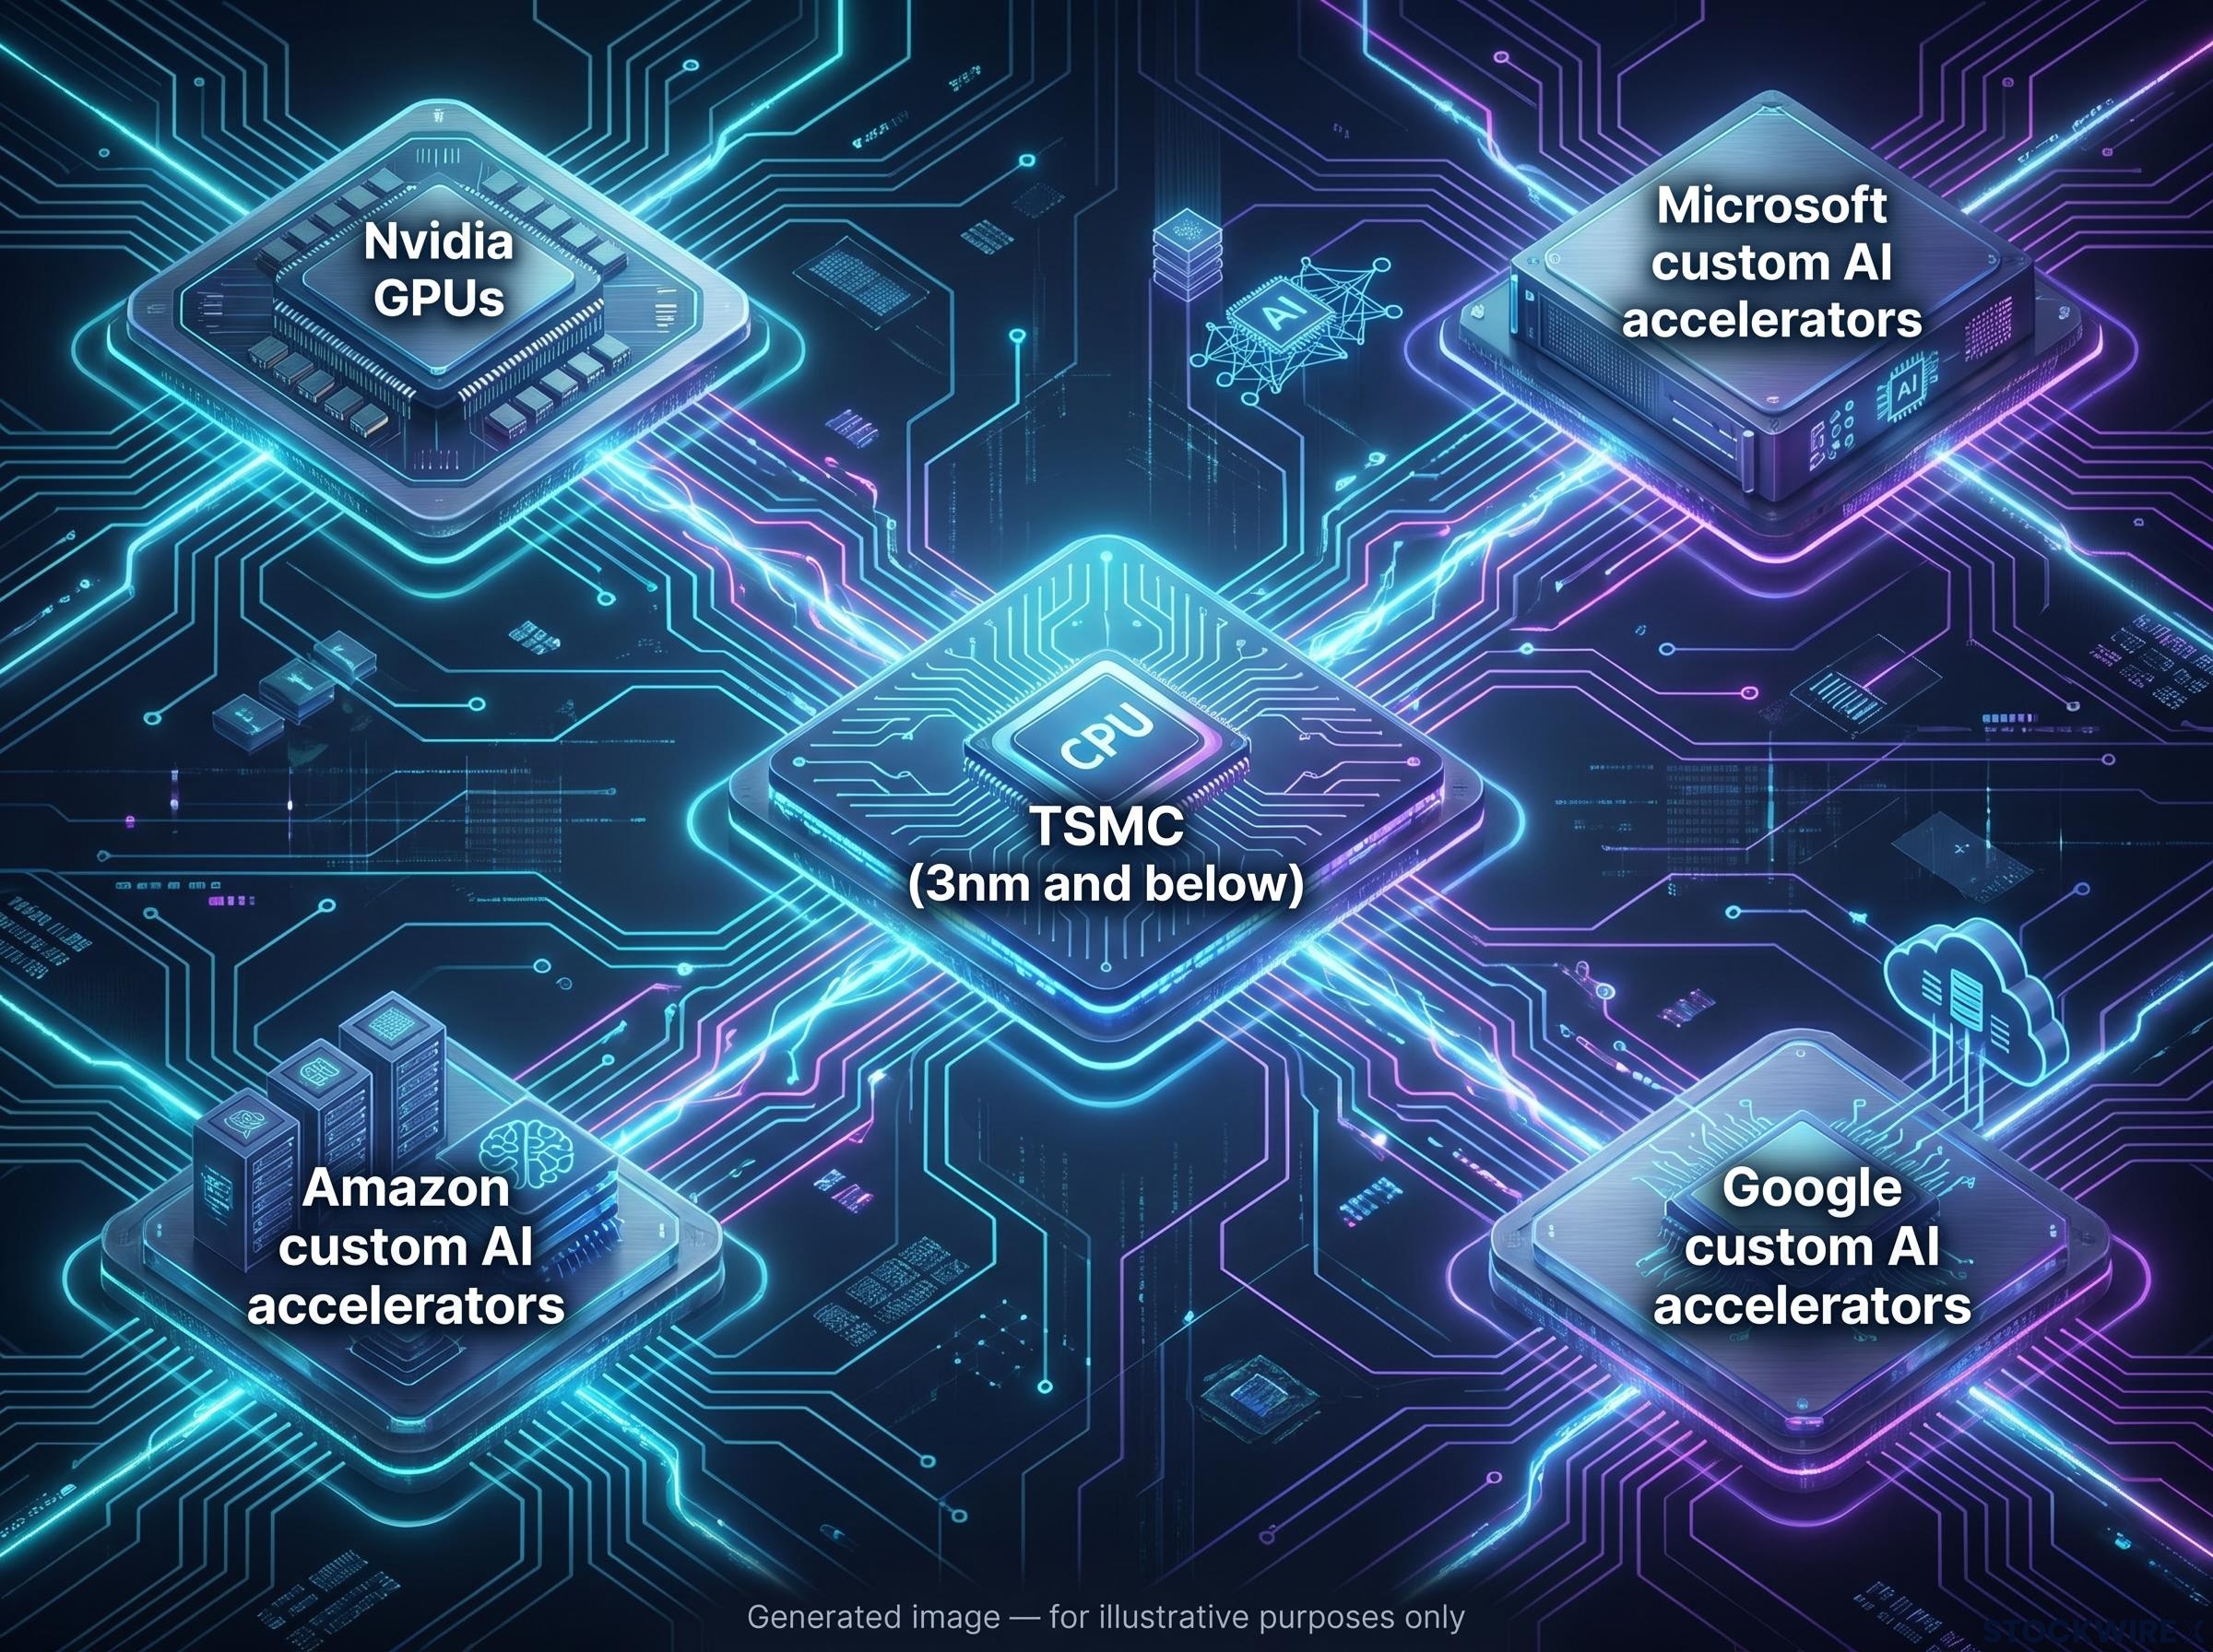
TSMC is the world’s largest contract chipmaker and the dominant foundry at leading-edge process nodes, fabricating chips at 3nm and below for the major fabless designers that power AI compute. A contract chipmaker, or foundry, manufactures chips designed by other companies rather than designing its own. When those customers order more, TSMC’s utilisation and revenue follow directly.
The key customer relationships driving the current cycle are concentrated:
- Nvidia GPUs, the primary hardware behind AI training and inference workloads
- Microsoft custom AI accelerators
- Amazon custom AI accelerators
- Google custom AI accelerators
All are manufactured at TSMC’s advanced fabs. Q1 2026 strength was attributed to demand for advanced nodes serving AI workloads, and Q2 continued that trajectory without interruption.
TSMC’s competitive moat at leading-edge nodes is substantially wider than headline market share figures suggest: the company is targeting approximately 180,000 wafers per month at 3nm by end-2026, roughly eight times the estimated capacity at both Samsung and Intel, a gap that underpins the pricing power embedded in current margin guidance.
Analysts previewing Q2 emphasised that results would “test whether the AI buildout has a ceiling,” underscoring the scale of what TSMC’s revenue line is actually measuring.
Understanding TSMC as AI infrastructure rather than a generic chipmaker reframes the 36% growth number. This is not simply TSMC outperforming; it is a direct readout of how fast global AI compute capacity is actually expanding. That concentration in a small number of hyperscaler and chip-designer customers is both the source of the current growth and the source of forward-guidance sensitivity on 16 July.
What the revenue figure cannot tell you, and why 16 July matters
The NT$1.27 trillion figure is a revenue-only estimate derived from monthly sales disclosures. It is not the full consolidated earnings release. Gross margin, operating margin, net income, EPS, and forward guidance are all still pending, and those are the numbers that typically move the stock.
The 16 July release, scheduled before market open, will add the following in rough order of what investors weight most heavily:
- Margin guidance: gross margin and operating margin trajectory, with the most recent reference point being Q1 guidance of a mid-60% gross margin range
- Forward guidance: formal Q3 and full-year 2026 revenue and margin projections, plus management commentary on AI demand visibility into H2 2026
- Segment and node mix detail: how much of Q2 growth came from AI versus smartphone, PC, and automotive segments, and utilisation at 3nm and 2nm nodes
| What is known now | What 16 July will reveal |
|---|---|
| Q2 revenue: ≈US$39.63 billion | Gross margin and operating margin |
| YoY growth: ~36% | Net income and EPS |
| June monthly revenue: NT$442.68 billion | Q3 and full-year 2026 guidance |
| Result within TSMC’s guidance range | Segment and node mix breakdown |
The revenue confirmation reduces uncertainty without resolving it. For anyone making a position decision, the guidance commentary on 16 July is where the real information event sits. In the chipmaking sector, TSMC is treated as a leading indicator whose quarterly projections shape expectations for Nvidia, AMD, Apple, and the wider fabless ecosystem.
For investors wanting to stress-test the demand visibility argument before the 16 July release, our full explainer on AI capex risks in the semiconductor sector examines the 18-24 month lag between hyperscaler spending commitments and the semiconductor revenue those commitments ultimately generate.
What to watch when the full earnings release drops
Three signals will determine whether the market treats Q2 as a setup for further upside or as a peak-growth marker. In priority order:
- Gross margin trajectory. TSMC last guided gross margins in the mid-60% range for Q1. If Q2 margins held or expanded at higher volumes, it confirms pricing power is intact as AI demand scales. If margins compressed despite record revenue, it raises questions about whether volume growth is coming at the expense of profitability.
- AI demand visibility into H2 2026. Management commentary on whether AI GPU and accelerator orders are still accelerating, holding steady, or showing early signs of digestion or push-outs. The difference between “demand visibility extends through year-end” and “we are seeing customers adjust order timing” is material for any semiconductor position.
- Capex and U.S. fab progress. Whether TSMC intends to increase capital expenditure further to meet AI demand, or whether a plateau is forming. The Arizona fab cost structure and any subsidy commentary will matter for multi-year margin assumptions.
Analyst estimates (per MarketBeat, not independently verified) point to trailing EPS of approximately US$12.02 with forward expectations ranging from approximately US$15.39 to US$19.69 per ADR share. At roughly 36x trailing earnings (likewise estimate-based), the stock’s valuation already embeds substantial growth expectations.
If management signals that AI demand visibility extends well into H2 2026 with margins holding in the mid-60s, that combination makes the current valuation easier to justify. If either softens, the revenue beat alone will not protect the stock from multiple compression.
This article is for informational purposes only and should not be considered financial advice. Investors should conduct their own research and consult with financial professionals before making investment decisions. Forward-looking statements regarding earnings, margins, and demand are speculative and subject to change based on market developments and company performance.
Three days out: what the revenue record confirms and what it leaves open
TSMC’s Q2 revenue of approximately US$39.63 billion, up 36% year-over-year, landed within the company’s own guidance range and slightly ahead of consensus growth expectations. AI chip demand at leading-edge nodes did the heavy lifting, and the 68% June surge confirmed momentum was still building as the quarter closed.
The revenue figure is a strong foundation, not a complete picture. Margin trajectory and forward guidance on 16 July are what determine whether the current valuation holds, extends, or corrects. The distinction between a revenue beat and an earnings beat is where position decisions will be made.
The full Q2 earnings release arrives before market open on Thursday, 16 July. Gross margin guidance and management commentary on AI demand visibility into H2 2026 are the two signals that will tell investors the most about what comes next.
For readers who want a structured framework before interpreting the 16 July figures, our dedicated guide to fundamental analysis metrics covers how EPS, gross margin, revenue growth, and return on equity interact as a set rather than as isolated readings, which is the analytical approach the full earnings release will require.