AI Disruption in Tech: the $2T Legacy Software Repricing
4 mins ago

T-Mobile stock has fallen roughly 8% year-to-date while the S&P 500 gained nearly 5%, a gap that sharpened even as the company reported Q1 2026 earnings per share of $2.27, beating Wall Street’s $2.05 consensus by more than 10%.
That disconnect between strong fundamentals and a sliding share price is the central question for investors evaluating TMUS right now. Two Wall Street firms, JPMorgan and Oppenheimer, both issued bullish calls on 29 April 2026, with price targets implying 37-45% upside from current levels near $190. What follows works through the actual numbers behind those calls: what the earnings beat reveals about T-Mobile’s business momentum, what the valuation multiples imply about risk and reward, and where the AI narrative fits into an investment case built primarily on subscriber growth and cash flow.
The headline numbers were unambiguous. T-Mobile delivered Q1 2026 earnings per share of $2.27 against a consensus estimate of $2.05, a positive surprise of roughly 10.7%. Revenue came in at $23.11 billion versus the $22.97 billion estimate.
$2.27 versus the $2.05 Wall Street consensus, a positive surprise of roughly 10.7%.
The operationally significant layer sits beneath those topline figures. Key Q1 2026 metrics include:
Management raised full-year postpaid net account additions guidance to 950,000-1,050,000, up from the prior range of 900,000-1,000,000. That upward revision signals the company’s own expectation that Q1 momentum is not a one-quarter anomaly.
T-Mobile’s Q1 2026 earnings beat extended to shareholder returns as well as headline metrics, with the company returning over $6 billion through buybacks and dividends in the quarter, a figure that underscores how cash generation is already flowing to investors even before the projected 12% FCF per share CAGR through 2028 fully materialises.
The earnings beat matters here not as a backward-looking scorecard but as evidence that the stock’s year-to-date decline reflects macro sentiment or sector rotation rather than company-specific deterioration. That distinction shapes how investors should frame the valuation question that follows.
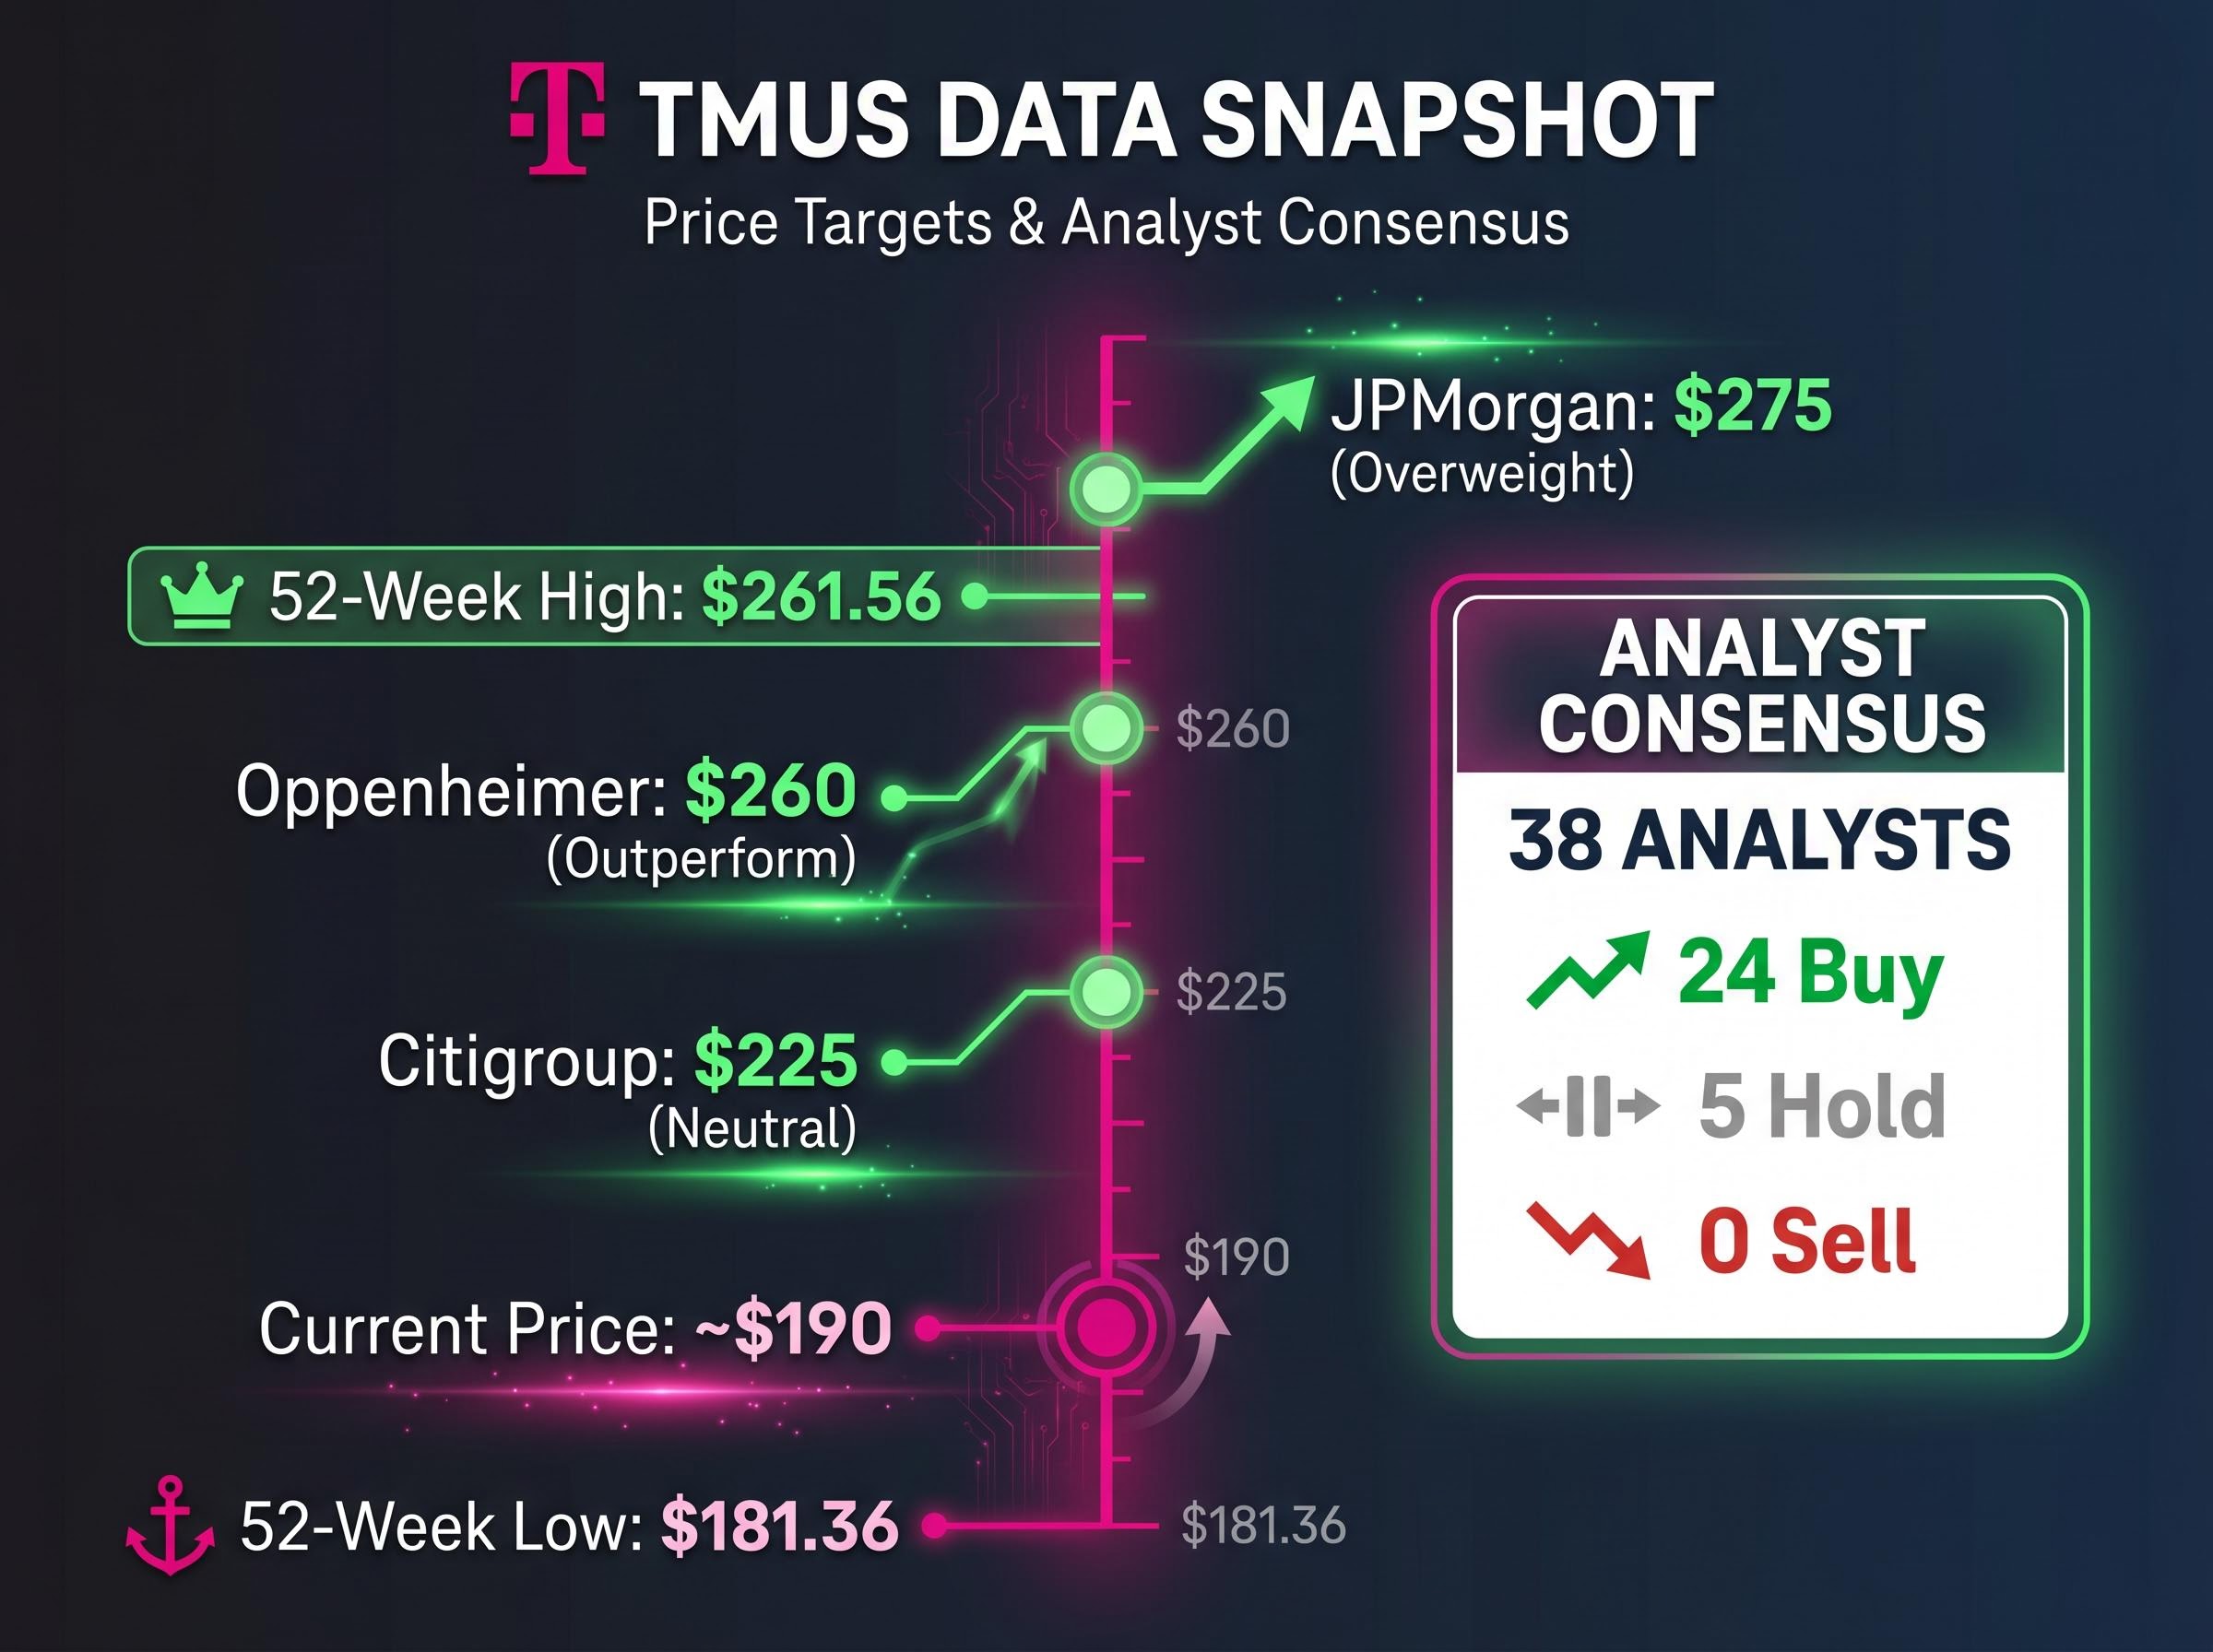
At $190.18 (as of 29 April 2026 pre-market), TMUS trades near the bottom of its 52-week range of $181.36-$261.56. The question is what that price actually implies about how the market values the business.
Two multiples tell the story. Enterprise value to EBITDA (EV/EBITDA) measures what an acquirer would pay for the company’s operating earnings; free cash flow (FCF) per share measures the cash profit available to shareholders after all spending. At current levels, TMUS trades at approximately 7.0 times estimated 2027 EV/EBITDA and 9.6 times estimated 2027 free cash flow per share. Telecoms are a sector known for modest multiples, but these sit at the lower end of the historical range for a company with T-Mobile’s growth profile.
Oliver Wyman telecom valuation analysis places the typical EV/EBITDA range for large-cap telecoms at 9-11 times, a benchmark that makes T-Mobile’s current implied multiple of approximately 7.0 times 2027 EBITDA appear materially discounted relative to sector norms.
| Metric | Current Implied Multiple | JPMorgan Fair-Value Multiple |
|---|---|---|
| EV/EBITDA (2027 est.) | ~7.0x | Higher (not disclosed) |
| FCF per share (2027 est.) | ~9.6x | 14.2x |
JPMorgan’s $275 price target is built on a 14.2 times estimated 2027 free cash flow per share multiple. The gap between 9.6 times (where the market prices TMUS today) and 14.2 times (where JPMorgan’s model places fair value) is the core of the bull case. That gap implies the market is either sceptical of T-Mobile’s growth trajectory or applying a macro discount that could compress once conditions stabilise.
The average consensus price target for TMUS falls in the $254-$268 range, depending on the analyst panel surveyed. But averages flatten the signal. The two analyst actions issued on 29 April 2026 warrant closer attention because they arrive from different analytical starting points.
JPMorgan maintained its Overweight rating and reduced its target from $300 to $275. That reduction was framed explicitly as a valuation recalibration, not a downgrade in conviction; JPMorgan retained T-Mobile on its U.S. Equity Analyst Focus List. Oppenheimer upgraded TMUS from Perform to Outperform with a $260 target, a fresh bullish initiation driven partly by AI tailwinds alongside the earnings beat.
| Firm | Rating | Price Target | Date |
|---|---|---|---|
| JPMorgan | Overweight | $275 | 29 April 2026 |
| Oppenheimer | Outperform | $260 | 29 April 2026 |
| KeyBanc | Overweight | $260 | 13 April 2026 |
| Morgan Stanley | Overweight | $260 | 16 April 2026 |
| Citigroup | Neutral | $225 | 17 March 2026 |
Across the broader 38-analyst survey, the breakdown reads 24 Buy, 5 Hold, and 0 Sell. Even Citigroup’s Neutral rating at $225 implies roughly 18% upside from current levels. When multiple firms using different methodological frameworks converge on similar upside, the signal carries more weight than any single target; the Citigroup floor helps investors calibrate the downside scenario within what remains a broadly bullish consensus.
The analyst targets are opinions. The growth engine beneath them is measurable. T-Mobile’s investment case rests on three compounding levers:
These levers connect directly to the valuation argument. JPMorgan projects approximately 8% compound annual growth (CAGR) in core adjusted EBITDA and approximately 12% CAGR in free cash flow per share through 2028. Those growth rates are what justify a higher trading multiple than the 7.0 times EV/EBITDA the market currently assigns.
JPMorgan’s 2026 free cash flow estimate of $18.43 billion falls within T-Mobile’s own guidance range of $18.1-$18.7 billion. Meanwhile, ARPA growth of 3.9% year-on-year to $151.92 and Mint Mobile’s role in capturing value-segment customers provide a monetisation pipeline: lower-cost subscribers entering through Mint can migrate to premium tiers over time, expanding revenue per account across the base.
The CAGR figures and cost programme give investors a framework for stress-testing whether the current 7.0 times EBITDA multiple represents a genuine discount or simply reflects scepticism that these growth rates are sustainable through 2028.
Oppenheimer’s upgrade from Perform to Outperform at $260 on 29 April 2026 explicitly cited AI as a lever for pricing power, operational cost reduction, and service expansion. The thesis positions T-Mobile’s network infrastructure as the foundation on which AI-enabled services could be built, differentiating the company from Verizon and AT&T.
The evidence, however, remains directional. No specific AI initiative metrics, partnership announcements, or tied revenue figures have been publicly disclosed in T-Mobile’s 2025-2026 filings as of the analysis date. The AI upside is a qualitative view from analysts, not a quantified financial item.
What makes the thesis plausible, rather than speculative, is the infrastructure layer. T-Mobile’s 5G-Advanced network lead, cited by multiple analysts as a competitive moat, provides the substrate on which any AI-enabled service differentiation would be built. Network superiority is measurable today; AI monetisation is not.
Oppenheimer’s AI thesis is anchored partly in the Nvidia AI-RAN partnership, which positions T-Mobile’s 5G-Advanced network as the infrastructure layer for AI-enabled service differentiation, a partnership that has not yet produced disclosed revenue figures but represents the specific technical programme analysts are pointing to when they describe AI as a pricing power lever.
The core bull case, built on subscriber growth, FCF CAGR, and the $2.7 billion cost programme, is already in the numbers. AI represents potential upside that is not yet in the model.
Investors relying on the AI narrative as a primary catalyst should recognise it functions as option value layered on top of an investment case that does not require it to work.
The analytical threads converge on a specific picture. TMUS trades near the bottom of its 52-week range following an earnings beat that exceeded consensus by more than 10%, with a consensus of roughly 24 Buy ratings and zero Sell ratings across 38 analysts, and implied upside of 37-41% to the $260-$275 analyst target cluster.
Three scenarios frame the risk-reward:
Near 52-week lows, post-earnings beat, zero Sell ratings across 38 analysts.
The key risks are explicit. The growth rate assumptions, 8% EBITDA CAGR and 12% FCF per share CAGR through 2028, would need to hold through potential macro headwinds. JPMorgan’s price target reduction from $300 to $275 is a multiple recalibration reflecting that uncertainty, not a thesis change; the firm retained T-Mobile on its U.S. Equity Analyst Focus List as of 29 April 2026.
The macro headwinds that could pressure T-Mobile’s multiple re-rating are not purely telecom-sector specific: Brent crude sitting approximately $1.50 below Goldman Sachs’s S&P 500 sell-off trigger, alongside a 25% Goldman-assigned recession probability for 2026, represents the broader market environment in which any multiple expansion thesis must prove out.
The Citigroup Neutral at $225 anchors the downside. Even in that scenario, investors entering near $190 face a stock where the most cautious active rating implies meaningful upside rather than capital loss.
The TMUS investment thesis is anchored in measurable, already-reported metrics: a Q1 earnings beat, raised full-year subscriber guidance, projected 12% FCF per share CAGR through 2028, and a $2.7 billion cost reduction programme. The AI narrative adds option value but does not yet carry quantified weight in analyst models.
The stock’s current position near the bottom of its 52-week range, combined with near-unanimous bullish analyst sentiment and zero Sell ratings, creates an asymmetric risk-reward profile. Investors should monitor the Q2 2026 subscriber and EBITDA trajectory to validate whether the 8% EBITDA CAGR assumption is tracking as projected.
One concrete milestone to watch: the Q2 2026 earnings report will be the first meaningful test of whether the raised full-year guidance of 950,000-1,050,000 postpaid additions is on pace. That report will either confirm the momentum Q1 established or force a reassessment of the growth assumptions underpinning every bullish target on the street.
This article is for informational purposes only and should not be considered financial advice. Investors should conduct their own research and consult with financial professionals before making investment decisions. Past performance does not guarantee future results. Financial projections are subject to market conditions and various risk factors.
T-Mobile stock has fallen roughly 8% year-to-date while reporting a Q1 2026 earnings beat of over 10% versus Wall Street consensus, suggesting the decline reflects broader macro sentiment and sector rotation rather than any deterioration in the underlying business.
The consensus price target for TMUS falls in the $254-$268 range, with JPMorgan setting a $275 target and Oppenheimer issuing a $260 target, both on 29 April 2026, implying upside of 37-45% from the current price near $190.
JPMorgan projects approximately 12% compound annual growth in T-Mobile's free cash flow per share through 2028, supported by subscriber momentum, a $2.7 billion cost reduction programme, and EBITDA expansion already visible in Q1 2026 results.
Oppenheimer cited AI-enabled services and T-Mobile's Nvidia AI-RAN partnership as a potential pricing power lever in its upgrade to Outperform, but analysts acknowledge AI represents option value layered on top of the core bull case, with no specific revenue figures yet disclosed.
The Q2 2026 earnings report is the key near-term milestone: investors should monitor whether postpaid net additions are tracking toward the raised full-year guidance of 950,000-1,050,000 and whether the 8% EBITDA CAGR assumption remains on pace.