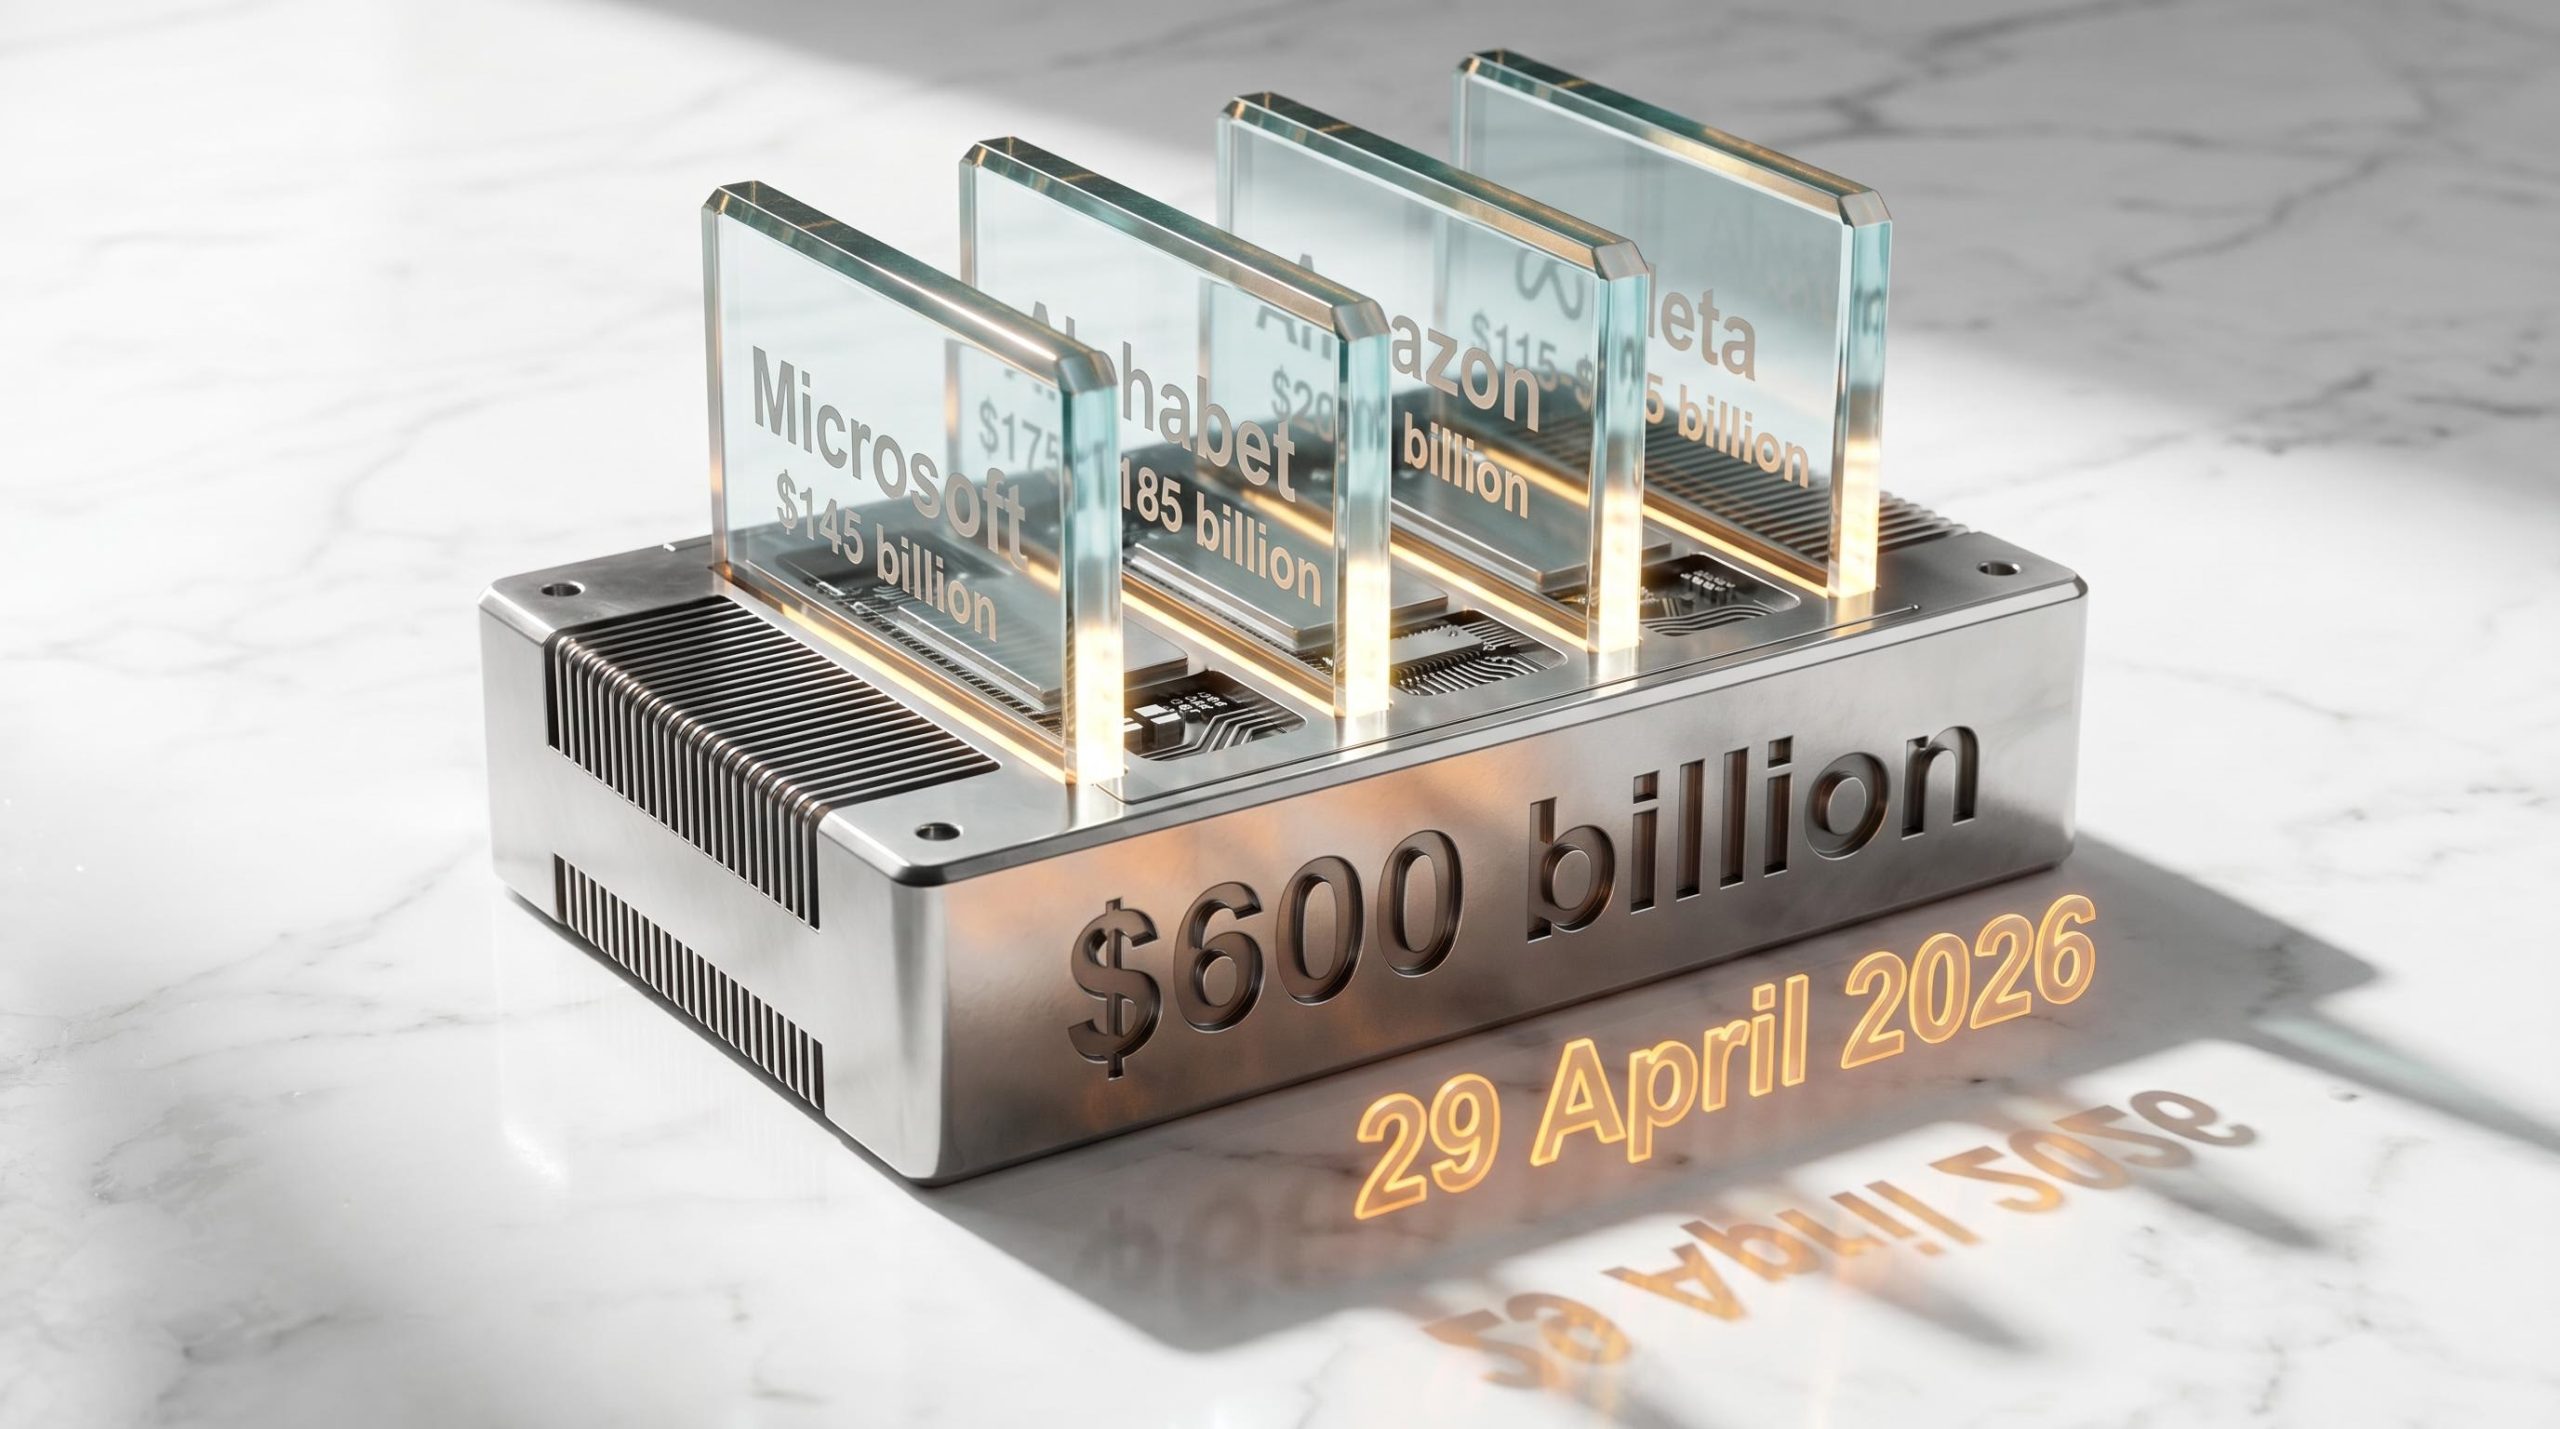
Big Tech Earnings Face $600B AI Reality Check Today
2 mins ago

T-Mobile reported first-quarter 2026 earnings per share of $2.27 against a consensus estimate of $2.06, a roughly 11% positive surprise that arrived alongside beats on revenue, adjusted EBITDA, and free cash flow. The results, released on 28 April 2026, also included a company record: the highest-ever proportion of new subscribers who cited network quality as their primary reason for switching to T-Mobile. For investors in T-Mobile stock, the quarter landed at a particularly charged moment. TMUS shares had declined approximately 8% year-to-date heading into the print, underperforming the S&P 500 by roughly 13 percentage points. A clean earnings sweep, a raised full-year guidance range, and a post-earnings price target action from JPMorgan now reframe the risk/reward calculus. What follows covers the headline numbers, the subscriber story behind them, the updated guidance, where the stock sits on valuation, and what Wall Street is saying.
Four metrics. Four beats. That is not routine for a large-cap wireless carrier in a quarter where the market was pricing in caution.
Q1 2026 EPS: $2.27 reported vs. $2.06 consensus, an approximately 10.7% positive surprise.
Diluted EPS led the sweep, but the breadth extended across the income statement and cash flow statement simultaneously. Total revenue reached $23.11 billion against a $22.97 billion consensus. Core adjusted EBITDA came in at $9.2 billion, up 12% year-over-year and roughly 2% above estimates. Adjusted free cash flow hit $4.6 billion, a 5% year-over-year increase.
| Metric | Reported | Consensus | Beat / Miss |
|---|---|---|---|
| Diluted EPS | $2.27 | $2.06 | Beat (~10.7%) |
| Total Revenue | $23.11B | $22.97B | Beat |
| Core Adjusted EBITDA | $9.2B | Estimates ~$9.0B | Beat (~2%) |
| Adjusted Free Cash Flow | $4.6B | Prior quarter run-rate | Beat (up 5% YoY) |
Net income of $2.5 billion did decline approximately 15% from $2.941 billion in Q1 2025. That drop reflects elevated integration costs tied to the UScellular acquisition and increased capital deployment, not a deterioration in operating performance. Operating cash flow reached $7.222 billion against capex of $2.623 billion.
Telecom acquisition integration timelines directly shape earnings quality in the quarters immediately following a deal close, with subscriber migration, cost normalisation, and white-label partnership structuring each introducing temporary distortions to reported net income that do not reflect underlying operating performance.
For investors tracking earnings quality, the simultaneous beat on profitability and cash generation signals that Q1 was not a single-lever story.
A one-quarter beat can be noise. A guidance raise is a decision.
Telecom guidance raises have become a recurring signal of management confidence across the sector, with carriers tightening their full-year ranges only when underlying subscriber and EBITDA trajectory data supports the commitment; Telstra’s February 2026 move to narrow its FY26 EBITDAaL band after a 14% Cash EBIT surge, paired with an expanded buyback programme, illustrates how carriers translate operational momentum into formal forward guidance.
T-Mobile lifted its full-year 2026 postpaid phone net addition guidance to a range of 950,000 to 1,050,000, an upgrade from the prior range that reflects management’s willingness to commit to sustained subscriber momentum rather than simply flow through a strong Q1.
CFO Peter Osvaldik: “Based on this strong start to the year, we’re raising our 2026 outlook.”
JPMorgan’s own estimates sit at the upper end of that range. The firm models approximately 1.035 million postpaid net additions for 2026, above the guidance midpoint of 1,000,000. That positioning provides a credible read on what a bullish-but-grounded scenario looks like.
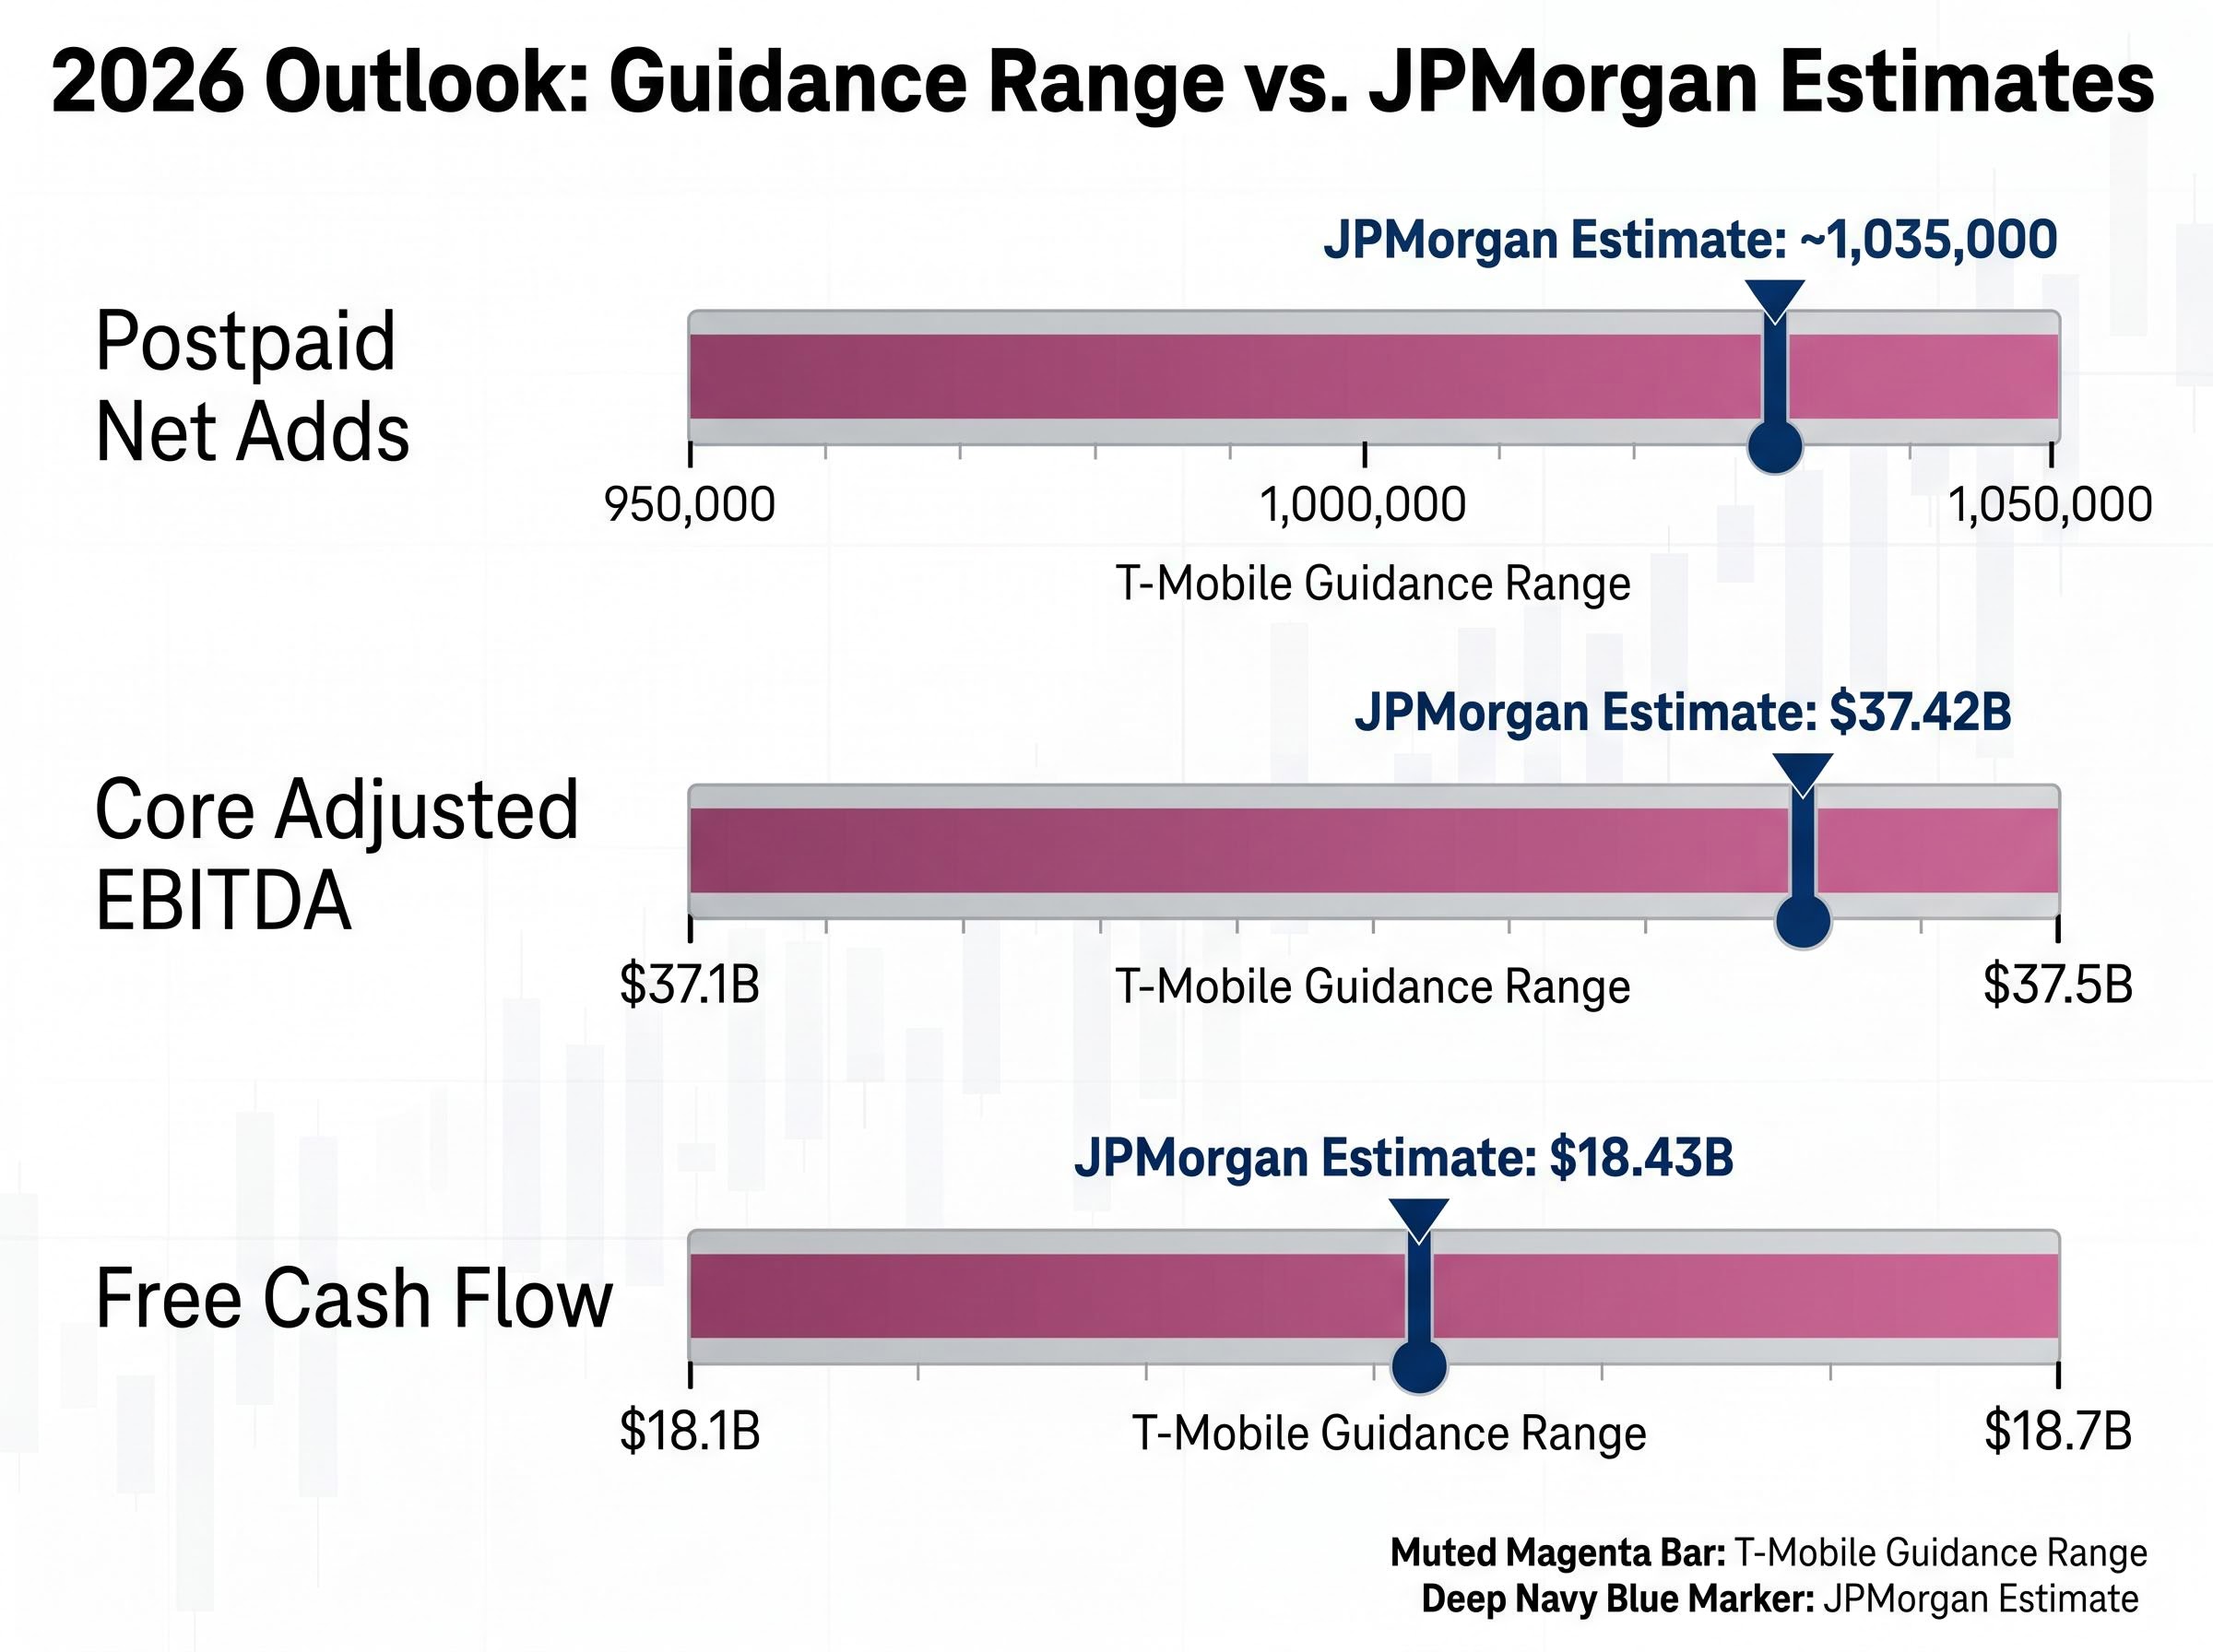
| Metric | T-Mobile Guidance Low | T-Mobile Guidance High | JPMorgan Estimate |
|---|---|---|---|
| Postpaid Net Adds | 950,000 | 1,050,000 | ~1,035,000 |
| Core Adjusted EBITDA | $37.1B | $37.5B | $37.42B |
| Free Cash Flow | $18.1B | $18.7B | $18.43B |
The EBITDA and free cash flow guidance ranges confirm that management expects the profitability trajectory to hold alongside subscriber growth. Investors now have a concrete anchor for tracking execution through the rest of 2026.
The S&P Global wireless industry credit outlook projects postpaid net addition trajectories and service revenue growth benchmarks for 2025-2026, offering an independent frame against which T-Mobile’s raised guidance range and EBITDA compounding target can be assessed.
Not all subscriber additions carry equal weight. When a customer switches carriers because of a promotional discount, the economics are fragile; that customer is likely to leave when the next promotion arrives. When a customer switches because of network quality, the retention profile and lifetime value shift materially.
T-Mobile reported that Q1 2026 set a company record for the proportion of new subscribers who cited network quality as their primary reason for switching. That distinction matters because network-driven switching reduces customer acquisition costs over time and supports pricing power, two factors that feed directly into the free cash flow trajectory underpinning the stock’s valuation.
The FCC Communications Marketplace Report documents how network quality rankings have increasingly become a primary competitive differentiator in U.S. wireless, giving additional regulatory context to the record share of quality-driven switchers T-Mobile reported in Q1 2026.
Postpaid net account additions reached 217,000, up year-over-year. CEO Srini Gopalan pointed to “accelerated YoY postpaid account growth alongside tremendous postpaid ARPA growth,” where ARPA (average revenue per account) measures the revenue generated per customer account.
Maintaining stable ARPU alongside subscriber expansion is one of the harder balancing acts in wireless, because aggressive subscriber acquisition typically requires promotional pricing that compresses per-account revenue; Tuas’s H1 FY26 results, where gross mobile ARPU held at S$9.61 while the subscriber base grew from 1.16 million to 1.4 million, provide a useful reference point for how network-driven switchers can support revenue-per-account stability at scale.
Management attributed subscriber momentum to three drivers:
The combination of higher-quality subscriber acquisition and rising revenue per account is the signal institutional investors track when assessing whether wireless growth is durable or promotional.
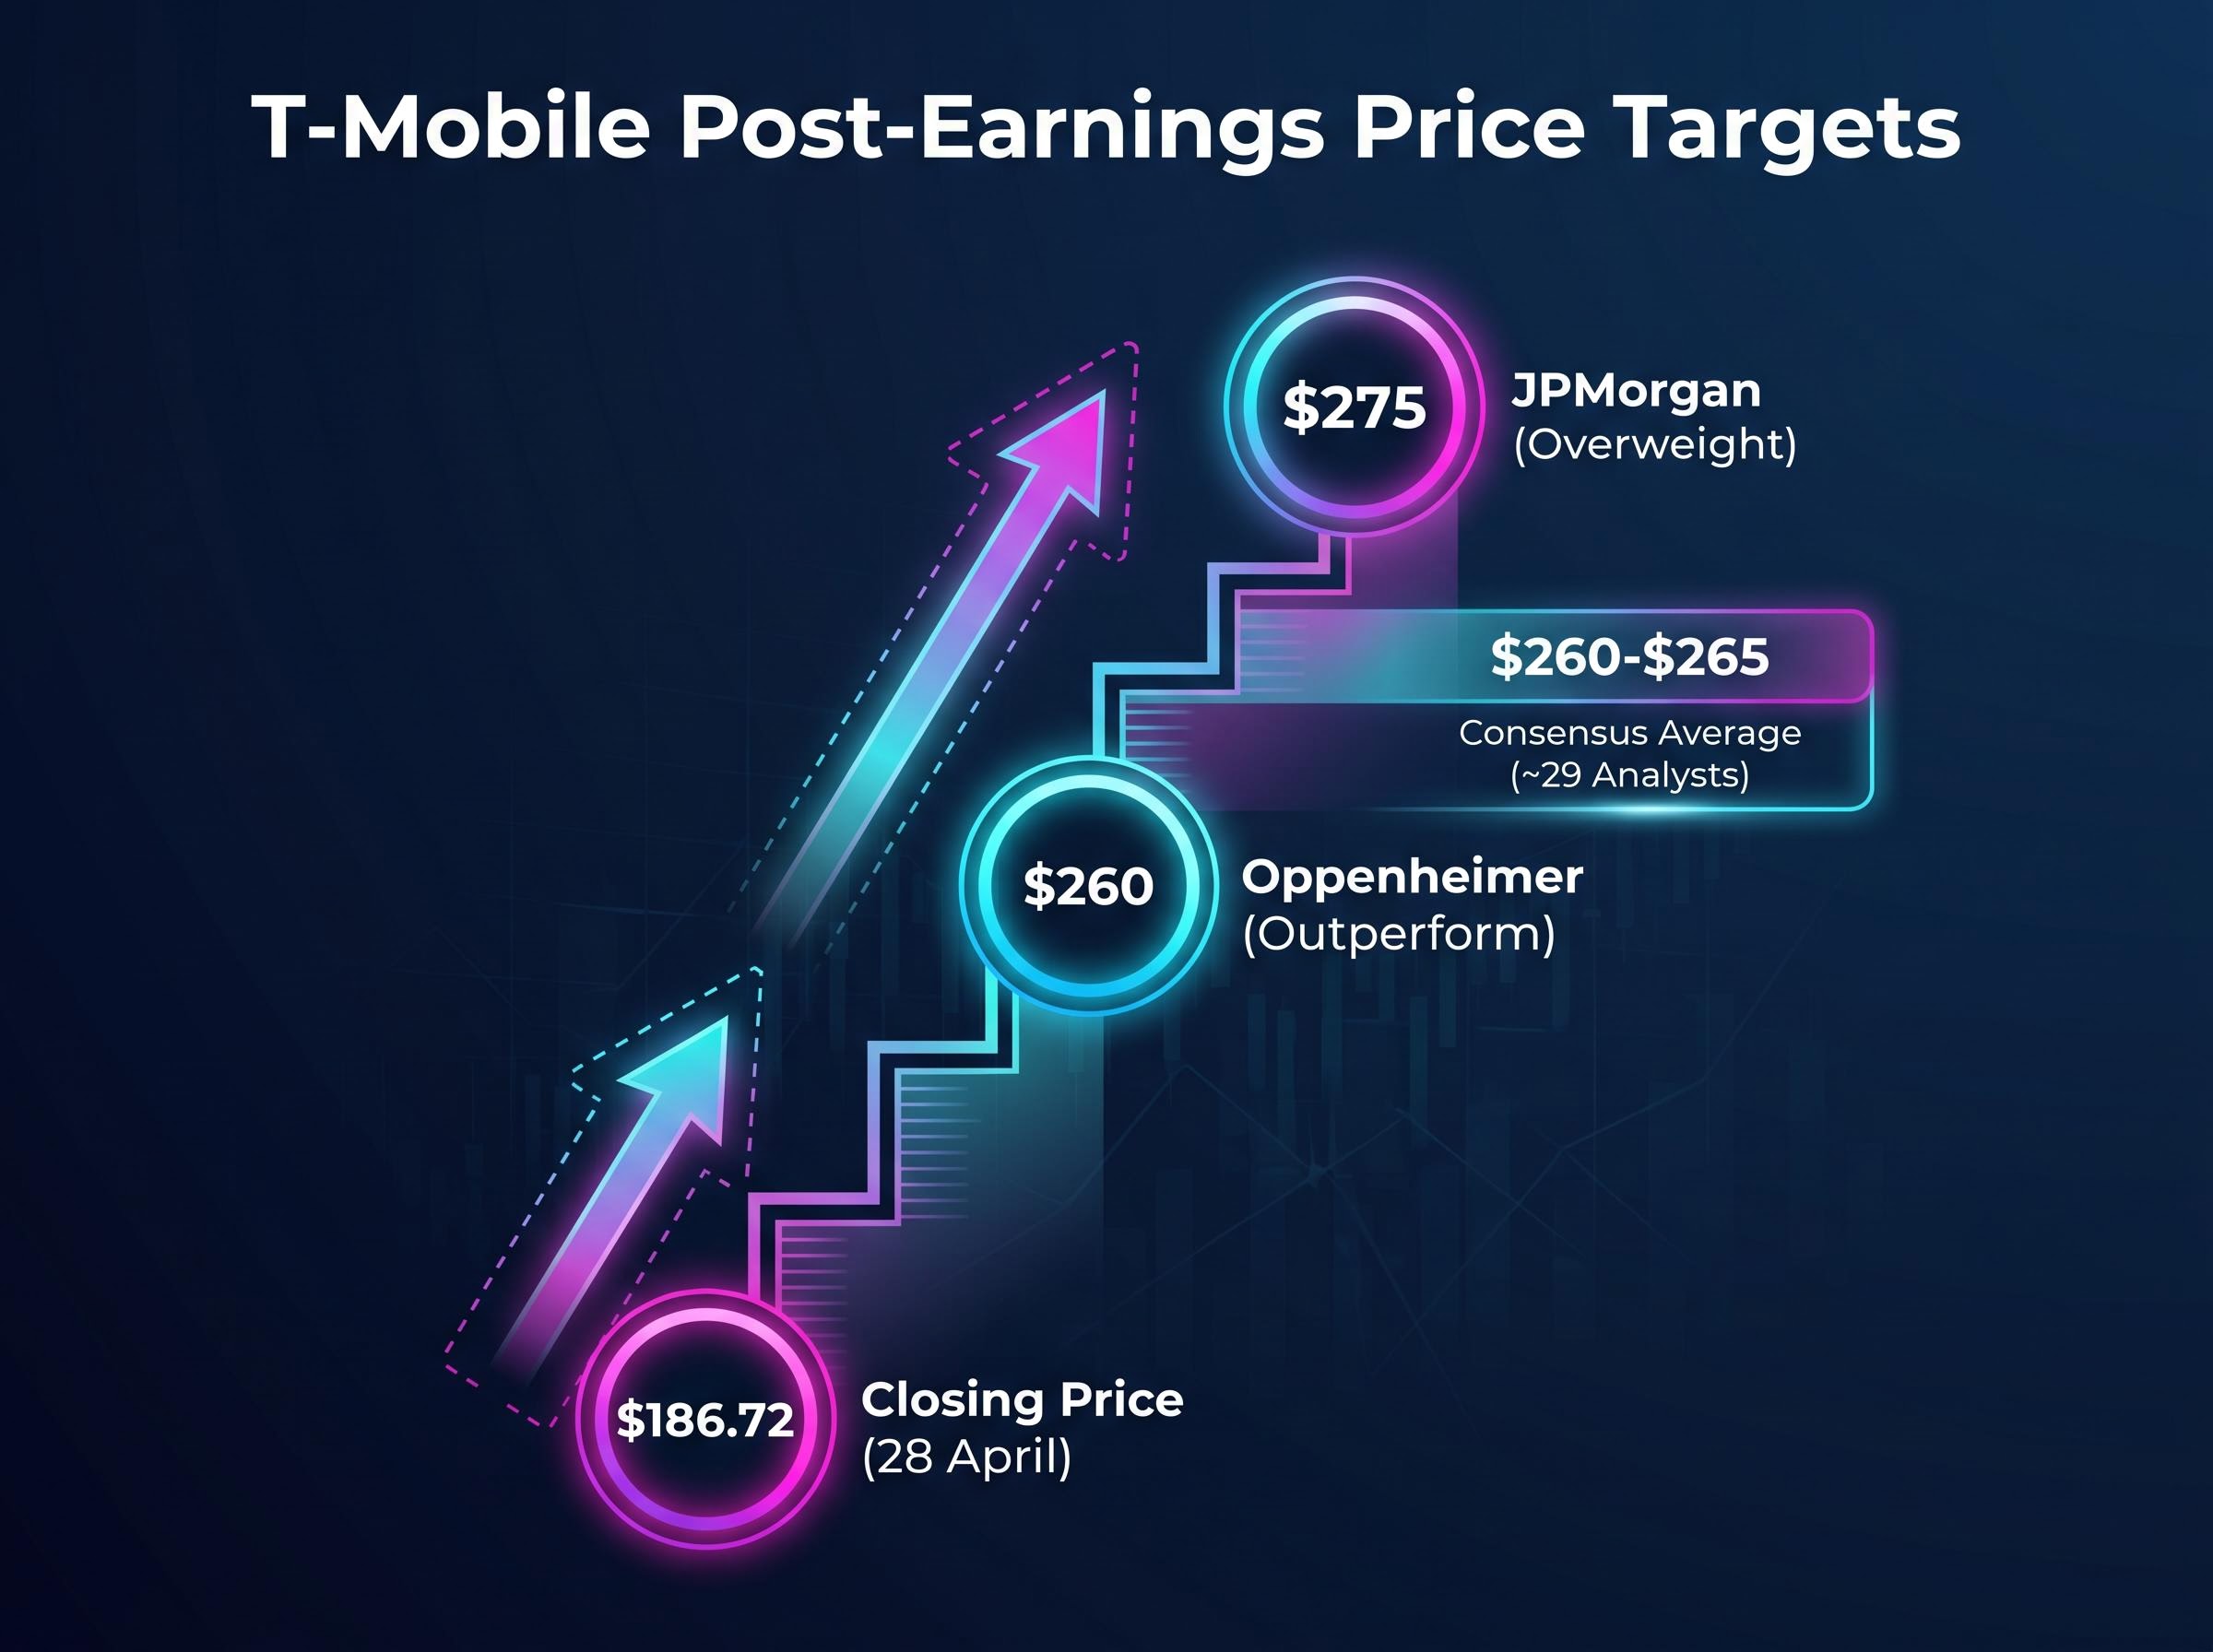
Here is the tension. TMUS shares closed at $186.72 on 28 April, up $3.97 (+2.17%) on earnings day, with after-hours trading reaching $190.21. The stock is still down approximately 8% year-to-date while the S&P 500 has gained roughly 4.7% over the same period.
That gap between share price performance and underlying business momentum is precisely what value-oriented growth investors interrogate. On 2027 estimates, TMUS trades at approximately 7.0x EV/EBITDA and approximately 9.6x free cash flow per share.
Free cash flow per share is projected to compound at approximately 12% annually through 2028.
Core adjusted EBITDA is projected to compound at approximately 8% annually through 2028. A $2.7 billion cost reduction target by 2027 provides a margin-expansion lever that may not yet be fully reflected in consensus estimates.
Capital returns in Q1 underscored management’s confidence: $4.95 billion in buybacks and $1.1 billion in dividends, totalling over $6 billion returned to shareholders in a single quarter.
Analysts have identified three forward catalysts that could close the valuation gap:
Whether those catalysts materialise will determine if the current multiple compression represents opportunity or appropriate caution.
Two analyst actions frame the post-earnings debate, and the nuance between them is instructive.
The JPMorgan action is worth parsing carefully. A price target cut paired with a retained Overweight signals a valuation recalibration, not a conviction downgrade. Even the reduced $275 target represents a roughly 47% premium to the 28 April close of $186.72.
Oppenheimer’s thesis introduces a distinct angle. CEO Gopalan noted on the earnings call: “Our Live Translation beta launches soon. Real-time voice translation with AI built into the network.” That AI capability is part of the broader thesis that T-Mobile can differentiate on service innovation, not just network speed.
Approximately 29 analysts cover TMUS, with the distribution predominantly Buy-rated. The average price target sits in the range of approximately $260-$265, implying meaningful upside from current levels even before accounting for the firms positioned at the upper end of the range.
The Q1 print confirmed that T-Mobile is in execution mode. Every headline metric beat, guidance moved higher, and the subscriber quality story strengthened. The stock, however, remains well below its analyst consensus target and behind the broader market year-to-date.
The resolution to that gap now rests on three active programmes, each with measurable milestones investors can track:
Total Q1 capital returns of over $6 billion ($4.95 billion in buybacks, $1.1 billion in dividends) signal that management views the free cash flow trajectory as sustainable. The full-year 2026 postpaid net addition guidance midpoint of 1,000,000 now serves as the benchmark.
This article is for informational purposes only and should not be considered financial advice. Investors should conduct their own research and consult with financial professionals before making investment decisions. Past performance does not guarantee future results. Financial projections referenced are subject to market conditions and various risk factors.
T-Mobile reported Q1 2026 diluted EPS of $2.27, beating the consensus estimate of $2.06 by approximately 10.7%, alongside beats on revenue, adjusted EBITDA, and free cash flow.
T-Mobile lifted its full-year 2026 postpaid phone net addition guidance to a range of 950,000 to 1,050,000, reflecting management confidence in sustained subscriber momentum following a strong Q1 performance across all key financial metrics.
JPMorgan lowered its T-Mobile price target to $275 from $300 on 29 April 2026 but retained its Overweight rating, representing approximately 47% upside from the 28 April closing price of $186.72.
T-Mobile reported a company record for the proportion of new subscribers citing network quality as their primary switching reason, which reduces customer acquisition costs over time and supports pricing power, both of which feed into the free cash flow trajectory underpinning the stock's valuation.
T-Mobile returned over $6 billion to shareholders in Q1 2026, comprising $4.95 billion in share buybacks and $1.1 billion in dividends, signalling management confidence in the sustainability of the company's free cash flow.