AI Disruption in Tech: the $2T Legacy Software Repricing
3 mins ago

T-Mobile beat Wall Street on every major metric in Q1 2026 and raised its subscriber outlook for the full year. Adjusted earnings per share came in at $2.27 against a $2.05 consensus. Core adjusted EBITDA reached $9.24 billion, running 2% above estimates, and service revenue margin hit 49.1%. The results dropped after market close on 28 April 2026, and the gap between that operational performance and the stock’s roughly 8% year-to-date decline, set against the S&P 500’s approximately 4.7% gain over the same period, is the tension investors are pricing this morning.
What follows breaks down what the Q1 numbers mean, why JPMorgan cut its price target while maintaining an Overweight rating, what the raised guidance signals about subscriber momentum, and whether the current valuation multiples create a compelling entry point.
The beat was not narrow. T-Mobile cleared consensus on earnings, revenue, and EBITDA simultaneously, a breadth that points to operational consistency rather than a single-line accounting benefit.
Q1 2026 EPS: $2.27 actual versus $2.05 consensus, a positive surprise of roughly 10.7%.
Total revenue reached $23.11 billion against a $22.97 billion consensus estimate. Core adjusted EBITDA of $9.24 billion marked a 12% increase year-over-year, and the 49.1% service revenue margin, calculated against $18.8 billion in service revenues, reinforced the profitability signal embedded across the quarter’s results.
Key Q1 metrics at a glance:
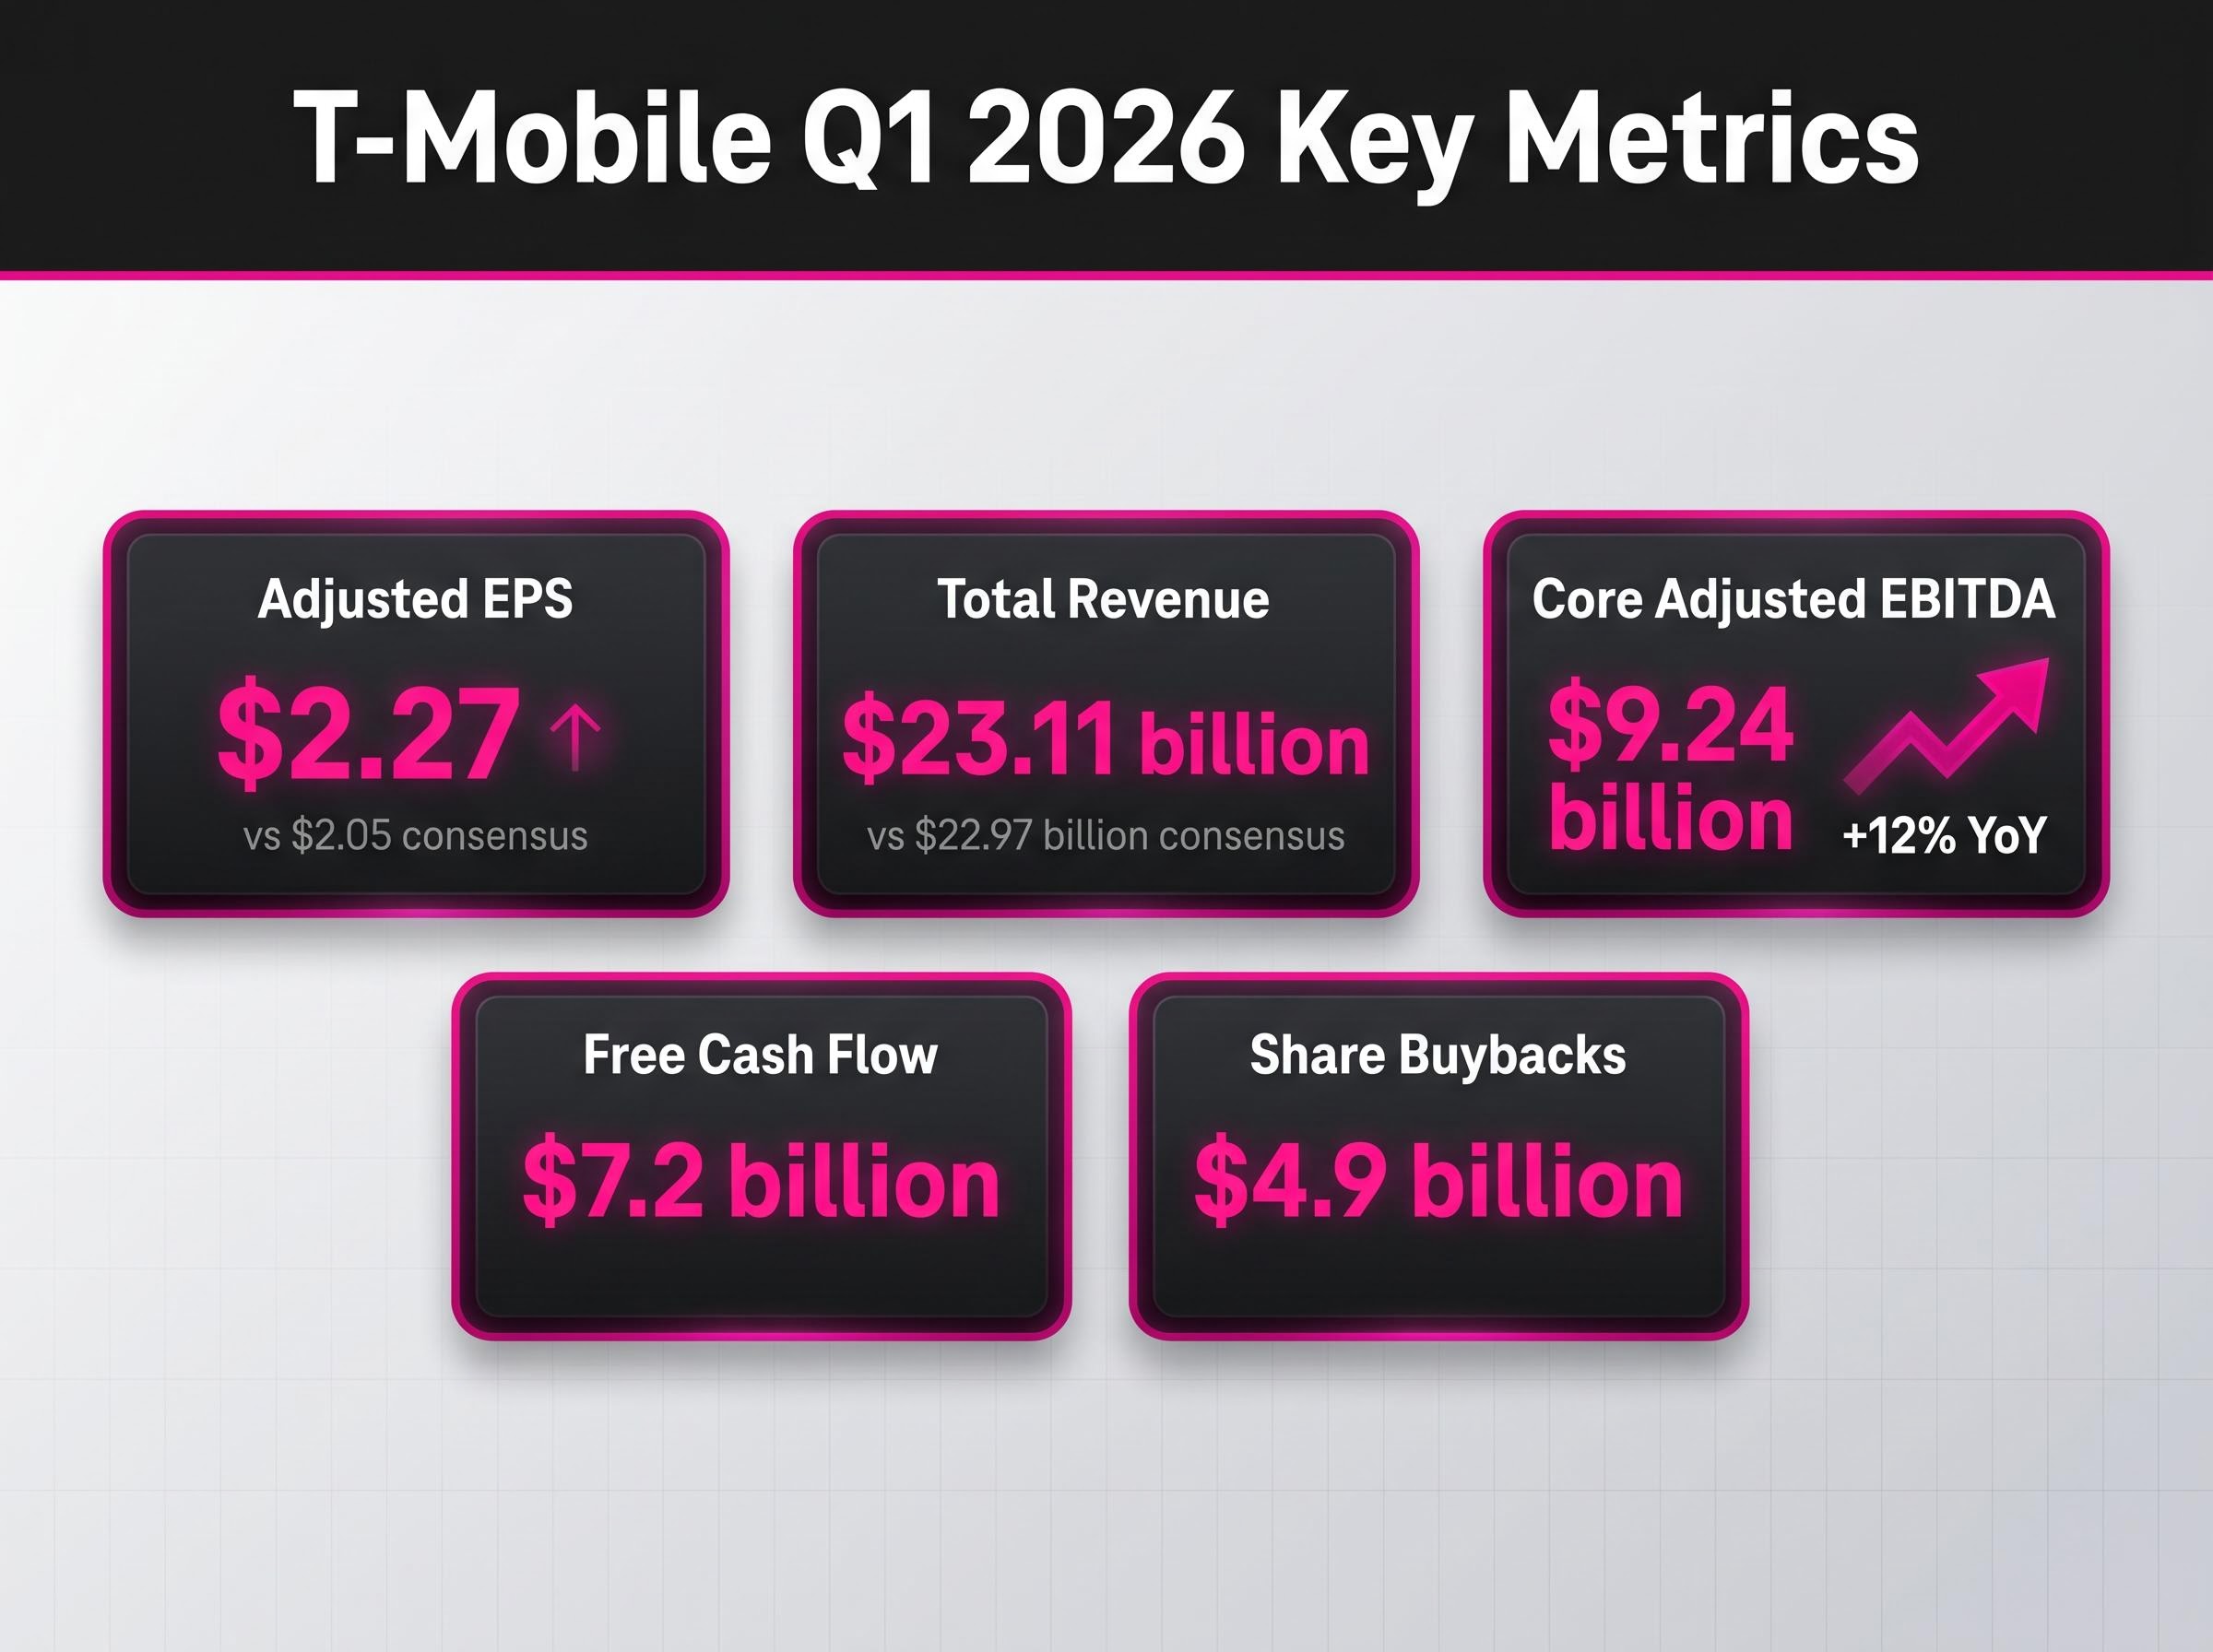
When all three headline metrics clear the bar together, the question shifts from whether the quarter was good to whether the trajectory behind it is durable.
T-Mobile added 217,000 postpaid net accounts in Q1, a 6% increase year-over-year. A base adjustment reduced postpaid accounts by 18,000, though this had no impact on net additions.
The figure that anchors those additions is postpaid account churn of 1.04%. Growing subscriber volume matters less if the back door is open. At 1.04%, the retention rate suggests the additions are sticking, not cycling.
Postpaid average revenue per account (ARPA) rose to $151.93, up 3.9% year-over-year. That means T-Mobile is growing both volume and per-account revenue at the same time, the combination that compounds free cash flow over multi-year holding periods.
The company’s investor relations commentary noted a record-high proportion of carrier-switchers citing network quality as their reason for choosing T-Mobile. Low churn paired with rising ARPA is the revenue durability signal investors should weigh most heavily in assessing the wireless business.
T-Mobile’s Net Promoter Score advantage over its nearest competitor, measured at more than 20 percentage points, provides a structural support mechanism for the raised subscriber guidance that raw account addition figures alone do not fully capture.
T-Mobile raised its 2026 postpaid account net addition guidance to a range of 950,000 to 1,050,000. The raise, coming in the first quarter, implies confidence in subscriber momentum across the remaining three quarters rather than a one-off seasonal surge.
JPMorgan’s revised estimate of approximately 1.035 million net additions for 2026 sits near the top of that range. When a sell-side analyst’s central forecast gravitates toward the upper bound of company guidance, it reflects genuine confidence in execution rather than conservative modelling.
The UScellular integration was cited as a contributing factor to subscriber momentum, adding incremental account growth from previously underpenetrated customer segments.
The DOJ antitrust review of the merger established the regulatory conditions under which T-Mobile completed its UScellular acquisition, clearing the path for the subscriber and revenue integration that management cited as a contributor to Q1 momentum.
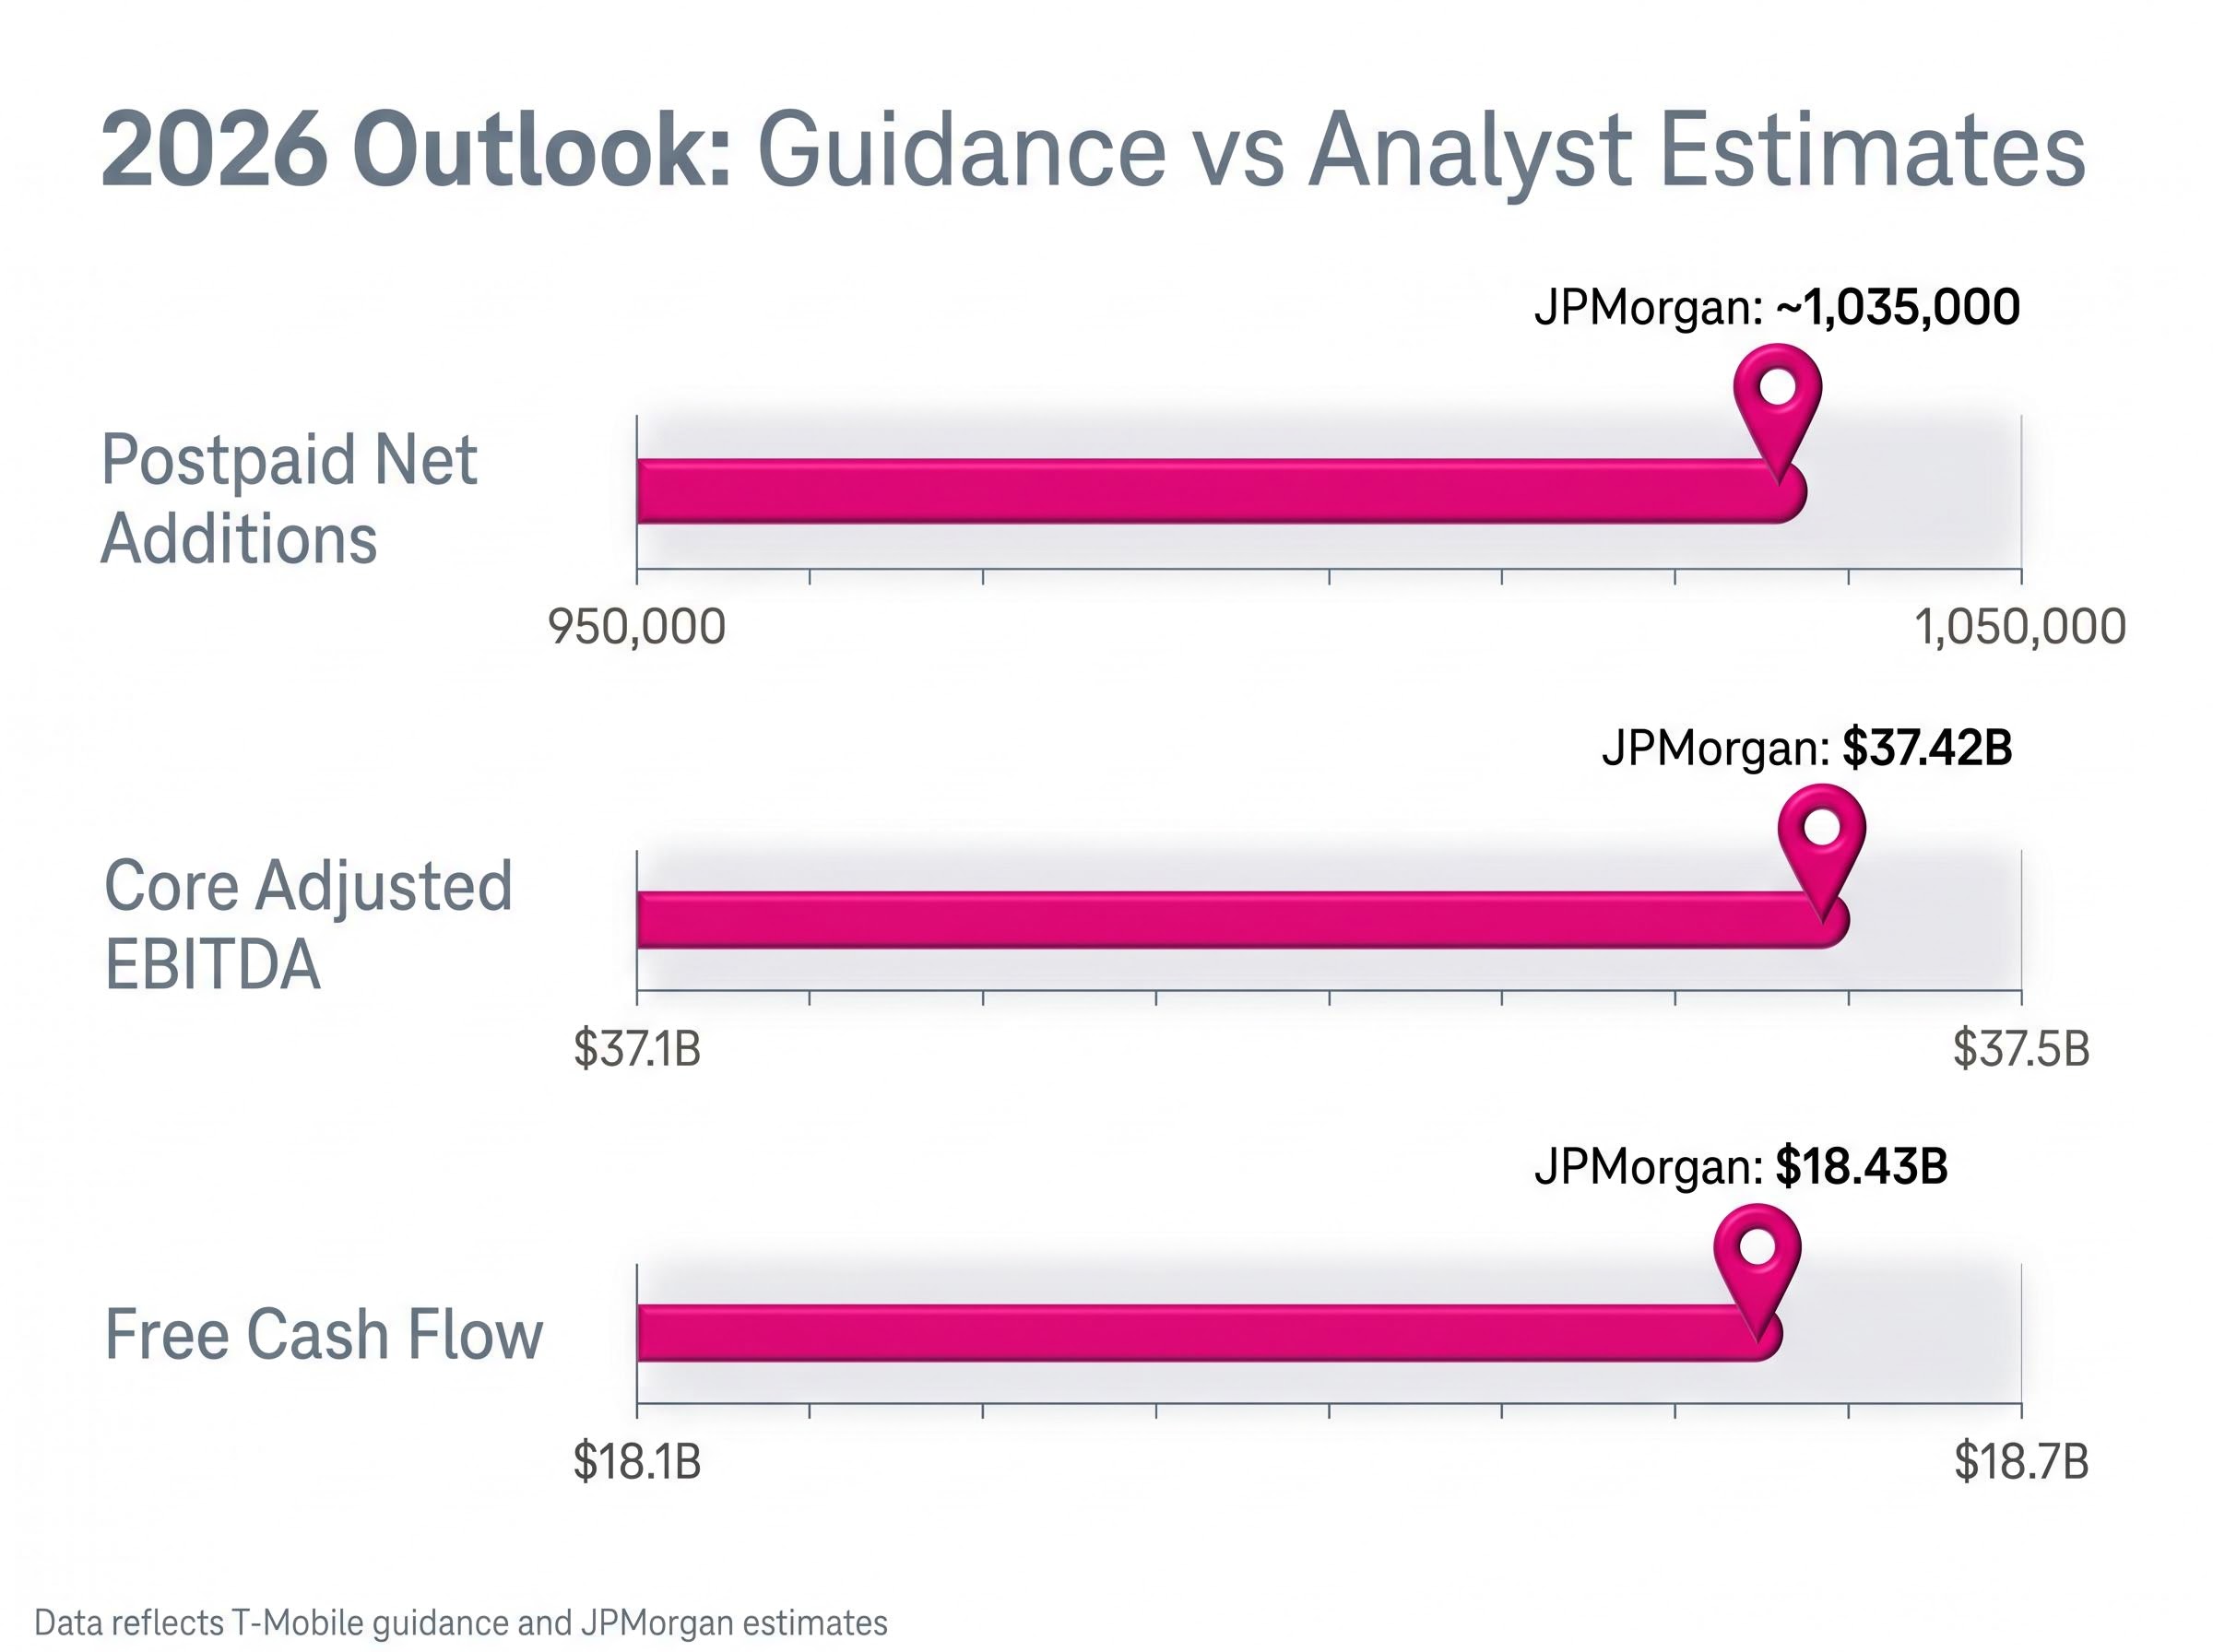
| Metric | Company Guidance | JPMorgan Estimate |
|---|---|---|
| Postpaid net additions | 950,000-1,050,000 | ~1,035,000 |
| Core adjusted EBITDA | $37.1B-$37.5B | $37.42B |
| Free cash flow | $18.1B-$18.7B | $18.43B |
Across all three metrics, JPMorgan’s estimates cluster in the upper half of management’s own range. Investors should treat that alignment as a signal that the guidance raise functions more as a floor than a ceiling.
JPMorgan cut its price target on TMUS to $275 from $300. At the same time, the firm maintained its Overweight rating and kept the stock on its U.S. Equity Analyst Focus List.
The distinction matters. A price target reduction from a firm that simultaneously reaffirms its overweight conviction is a valuation recalibration, not a deterioration thesis. A valuation multiple, in this context, is the price investors pay per dollar of a company’s earnings or cash flow; when multiples compress, the stock becomes cheaper relative to its underlying financial performance even if that performance is improving.
Current TMUS valuation: approximately 7.0 times estimated 2027 EV/EBITDA and 9.6 times estimated 2027 free cash flow per share. The $275 target corresponds to approximately 14.2 times 2027 FCF per share.
The stock’s roughly 8% year-to-date decline, against the S&P 500’s approximately 4.7% gain, is the backdrop that explains the multiple compression. Two analyst actions frame the current positioning:
Investors who conflate a price target cut from a bull with an exit signal risk misreading the investment thesis at what current multiples suggest could be a compressed entry point.
Investors exploring the full breadth of the re-rating thesis, including the 28-analyst consensus average and the Nvidia AI-RAN partnership underpinning Oppenheimer’s upgrade, will find our dedicated guide to T-Mobile’s analyst consensus upside, which details why Wall Street’s aggregate price target implies roughly 35-40% from current levels and where the $2.7 billion cost programme fits within that framework.
T-Mobile’s $23.11 billion in Q1 revenue sits well below Verizon’s $34.4 billion and AT&T’s $31.5 billion. The gap, however, reflects business mix more than competitive weakness. Verizon and AT&T carry substantial wireline, enterprise, and media segments. T-Mobile operates as a more purely wireless business.
The meaningful comparison lies in wireless-specific metrics. T-Mobile’s 217,000 postpaid net account additions dwarfed Verizon’s 55,000 postpaid phone net additions. And T-Mobile’s 12% year-over-year EBITDA growth, paired with a 49.1% service revenue margin, outpaced the growth rates posted by either competitor.
| Metric | T-Mobile | Verizon | AT&T |
|---|---|---|---|
| Q1 revenue | $23.11B | $34.4B | $31.5B |
| YoY revenue growth | Not specified | ~3% | 2.9% |
| EBITDA / EBITDA growth | $9.24B (up 12%) | $13.4B (up 6.7%) | Not directly comparable |
| Postpaid net adds | 217,000 (accounts) | 55,000 (phone) | 584,000 (fiber/FWA) |
AT&T’s 584,000 net additions came from fibre and fixed wireless, a different product category. Absolute revenue comparisons across these three carriers are structurally misleading. Investors evaluating TMUS against its peers should isolate wireless margins and subscriber velocity, the two dimensions where T-Mobile’s lead is most pronounced.
The Q1 snapshot fits within a broader multi-year trajectory. Three structural drivers underpin the bull case:
Forward FCF growth: JPMorgan estimates approximately 12% compound annual growth in free cash flow per share through 2028, a rate that, if sustained, would compound meaningfully at current entry multiples.
Several data points remain unconfirmed as of publication: 29 April intraday stock price movement, postpaid phone net adds specifics, and prepaid performance figures. Investors should monitor these as they become available.
Past performance does not guarantee future results. Financial projections are subject to market conditions and various risk factors.
T-Mobile beat estimates broadly, raised guidance, and carries two supportive analyst actions, yet trades at a year-to-date discount to the broader market. The current multiple implies investors can access a high-confidence free cash flow compounder at a compressed entry price relative to the forward earnings trajectory JPMorgan and Oppenheimer have modelled.
The data points to monitor in coming weeks include 29 April trading volume and price action, additional analyst revisions beyond the two confirmed, and the Q2 2026 earnings date as the next fundamental catalyst. The evidence from Q1 supports operational momentum; the market’s pricing of that momentum remains the open question.
For readers wanting to understand why two firms can arrive at bullish convictions through entirely different methodologies, our full explainer on T-Mobile’s competing analyst frameworks examines the JPMorgan valuation model alongside Oppenheimer’s AI-driven pricing thesis, including the IntentCX partnership with OpenAI and the 6G Innovation Hub with Deutsche Telekom, and explains how T-Mobile’s 35% wireless market share underpins both approaches.
This article is for informational purposes only and should not be considered financial advice. Investors should conduct their own research and consult with financial professionals before making investment decisions.
T-Mobile reported adjusted EPS of $2.27 against a $2.05 consensus, total revenue of $23.11 billion, and core adjusted EBITDA of $9.24 billion, beating estimates across all major metrics.
JPMorgan cut its price target to $275 from $300 while maintaining an Overweight rating, indicating a valuation recalibration due to the stock's year-to-date decline, not a fundamental downgrade.
The raised 2026 postpaid account net addition guidance to 950,000-1,050,000, coming in the first quarter, signals management's confidence in sustained subscriber momentum for the full year.
T-Mobile's wireless-specific metrics, such as 217,000 postpaid net account additions and 12% year-over-year EBITDA growth, significantly outpaced Verizon and AT&T in wireless performance.
Key drivers include projected 12% compound annual growth in free cash flow per share through 2028, a $2.7 billion cost reduction program, and AI-enabled operational efficiencies.