Why AI Is Pushing Memory Chip Prices Higher Through 2028
2 hrs ago

T-Mobile US posted $2.27 in earnings per share for Q1 2026, roughly 11% above what Wall Street had pencilled in, and raised its full-year subscriber guidance on the same call. The result lands with particular weight because Q4 2025 had delivered a miss at $1.88 against a $2.00 consensus, making this quarter’s beat both a recovery and an acceleration. For investors tracking TMUS stock news heading into the rest of 2026, the picture now includes raised guidance across three metrics, two fresh analyst actions from JPMorgan and Oppenheimer, and a Net Promoter Score more than 20% above the nearest competitor. What follows covers the key Q1 metrics, what the guidance raise signals about management conviction, how two major firms are positioning around the stock, and what the 2026 to 2028 growth arithmetic looks like for shareholders.
The earnings-per-share figure carried the largest surprise. T-Mobile reported $2.27, a roughly 10.73% beat against the $2.05 consensus, and the gap widened further when measured against the $1.88 posted in Q4 2025, a quarter that had missed expectations by $0.12.
$2.27 actual EPS vs. $2.05 consensus: an approximately 10.73% positive surprise, reversing the Q4 2025 miss.
Revenue reinforced the signal. $23.11 billion came in above the $22.97 billion estimate, driven by postpaid service revenue growth of 15% year-over-year and total service revenue growth of 11% year-over-year. Core adjusted EBITDA rose 12% year-over-year. The company returned $6 billion to shareholders during the quarter.
| Metric | Q1 2026 Actual | Consensus Estimate | YoY Growth |
|---|---|---|---|
| Earnings Per Share | $2.27 | $2.05 | — |
| Revenue | $23.11B | $22.97B | — |
| Core Adjusted EBITDA | — | — | 12% |
A clean beat across EPS, revenue, and EBITDA simultaneously points to broad operational execution rather than a single-line accounting adjustment. The reversal from Q4 2025’s miss gives the Q1 result additional credibility with investors who had been waiting for confirmation that the prior quarter was an anomaly.
The T-Mobile Q1 2026 earnings snapshot reported by MarketScreener, citing the Associated Press, confirmed the $2.27 EPS and $23.11 billion revenue figures, both clearing analyst estimates and establishing the broadest beat the company has posted in recent quarters.
The beat was backward-looking. The guidance raise is the forward-looking tell.
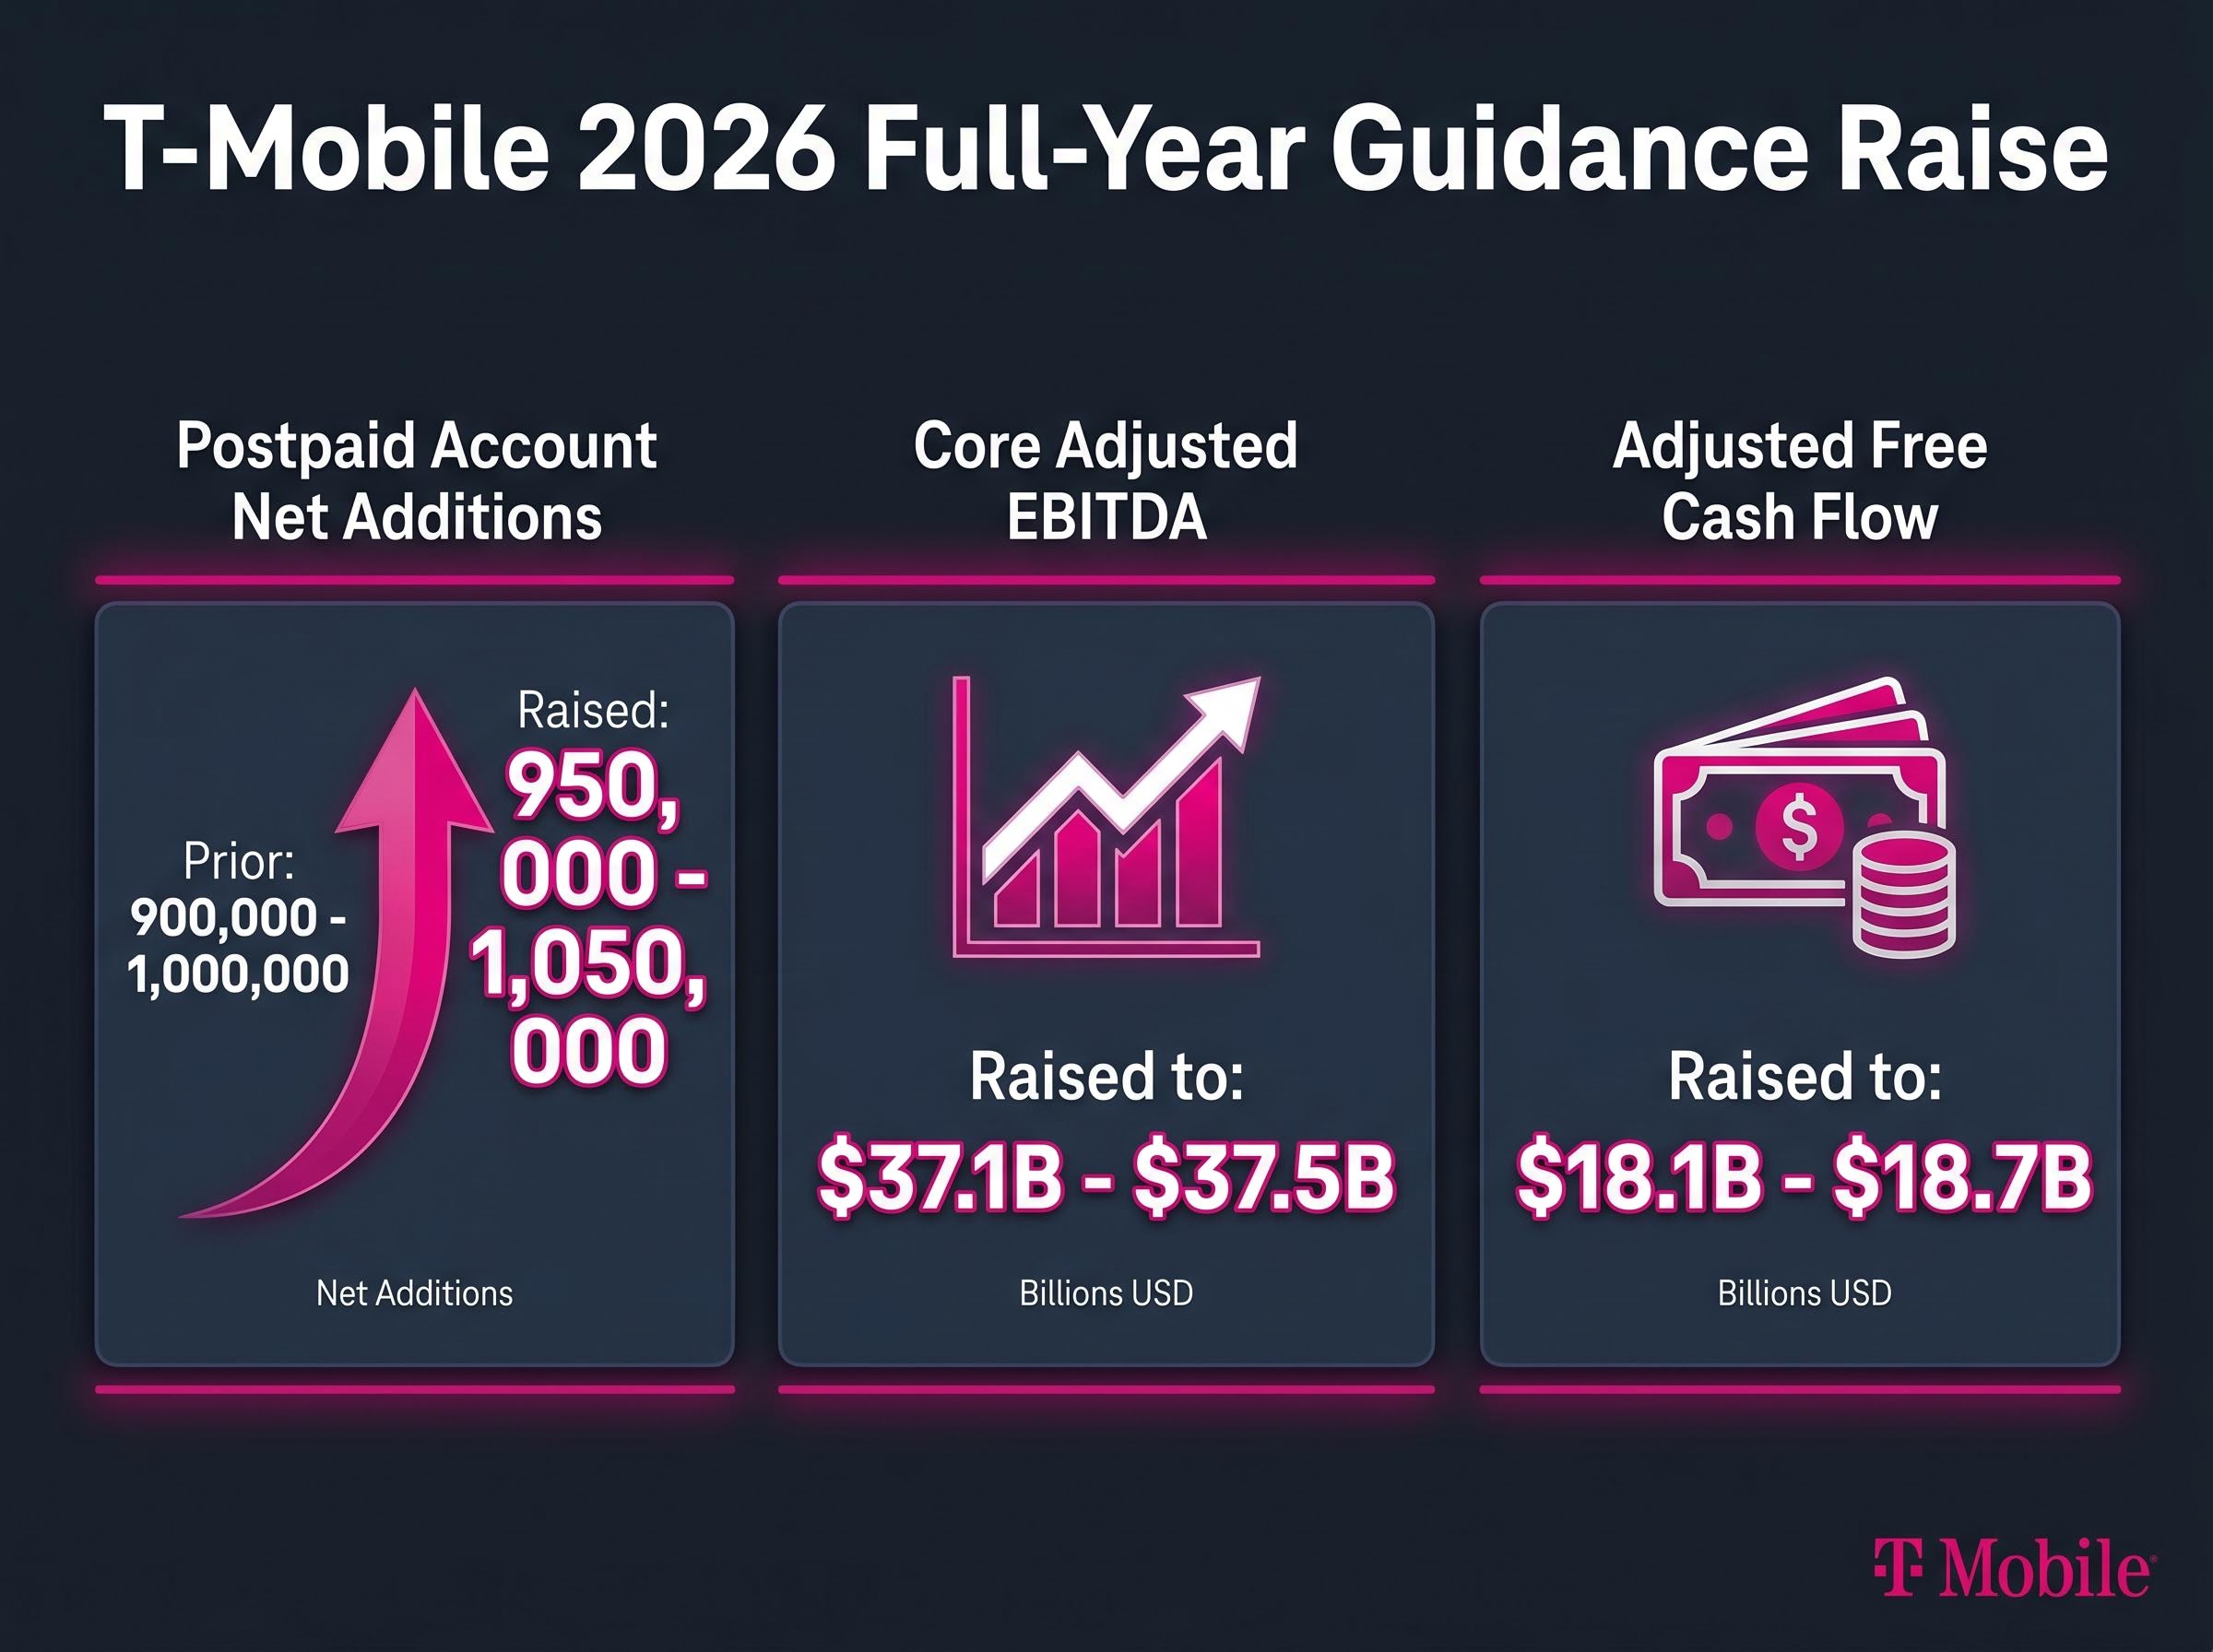
T-Mobile lifted all three of its full-year 2026 targets on the same call:
The postpaid net addition raise is the most telling of the three. Moving the floor from 900,000 to 950,000 and the ceiling from 1,000,000 to 1,050,000 implies management sees subscriber momentum accelerating, not plateauing, after Q1. On the earnings call, management cited continued gains in underpenetrated market segments as the driver behind the raise.
Guidance increases issued alongside a quarterly beat carry more weight than standalone revisions. Management is expressing confidence at the moment of maximum information. All three ranges moving higher simultaneously suggests the conviction is broad-based, not concentrated in a single metric.
A price target cut and an upgrade arrived within the same cycle. The apparent contradiction resolves when the two actions are read from their respective starting points.
JPMorgan cut its price target on TMUS to $275 from $300 but maintained its Overweight rating and kept the stock on its U.S. Equity Analyst Focus List. The revised $275 target corresponds to 14.2 times estimated 2027 free cash flow per share.
The cut reflects a valuation reset rather than a change in fundamental view. At the time of the revision, TMUS traded at 7.0 times estimated 2027 EV/EBITDA and 9.6 times estimated 2027 free cash flow per share. The stock had declined approximately 8% year-to-date, compared to the S&P 500’s gain of approximately 4.7% over the same period.
The maintained Overweight is backed by numbers. JPMorgan’s own 2026 estimates sit above T-Mobile’s guidance midpoints on all three metrics:
| Metric | JPMorgan 2026 Estimate | T-Mobile Guidance Midpoint |
|---|---|---|
| Postpaid Net Additions | ~1.035 million | 1.0 million |
| Core Adjusted EBITDA | $37.42B | $37.3B |
| Free Cash Flow | $18.43B | $18.4B |
When a firm cuts its price target but simultaneously keeps a stock on its top-pick list, the signal is that the absolute price level has reset while relative conviction has not. For investors interpreting the headline, that distinction matters.
Oppenheimer took a different route, upgrading TMUS to Outperform from Perform with a $260 price target. The primary thesis centres on AI-driven pricing strategy and cost efficiencies that the firm believes are not yet fully reflected in consensus models.
The two actions are compatible. JPMorgan recalibrated the destination; Oppenheimer upgraded the conviction. Both reflect long-term confidence in T-Mobile’s operational trajectory.
The guidance raise and analyst conviction rest on a structural foundation: T-Mobile continues to take postpaid subscribers from AT&T and Verizon at a rate the mature U.S. wireless market would not ordinarily support.
Net Promoter Score: 45, more than 20% above the nearest competitor. A Net Promoter Score measures how likely customers are to recommend a service to others, and the gap at this level indicates a sustained satisfaction advantage.
Q1 2026 marked a record-high proportion of switchers citing network quality as their primary reason for choosing T-Mobile. Three structural advantages are reinforcing one another:
A 20%-plus NPS lead over competitors is the kind of durable advantage that supports a raised subscriber guidance target rather than making it look like a stretch. For investors evaluating whether T-Mobile’s growth is sustainable, the competitive data suggests it is structurally driven rather than promotional.
CustomerGauge’s telecom NPS benchmarks, which draw on Bain and Company methodology and track scores across major U.S. carriers, place the industry average at 31, a figure that contextualises T-Mobile’s reported score of 45 as a sustained structural advantage rather than a short-term promotional effect.
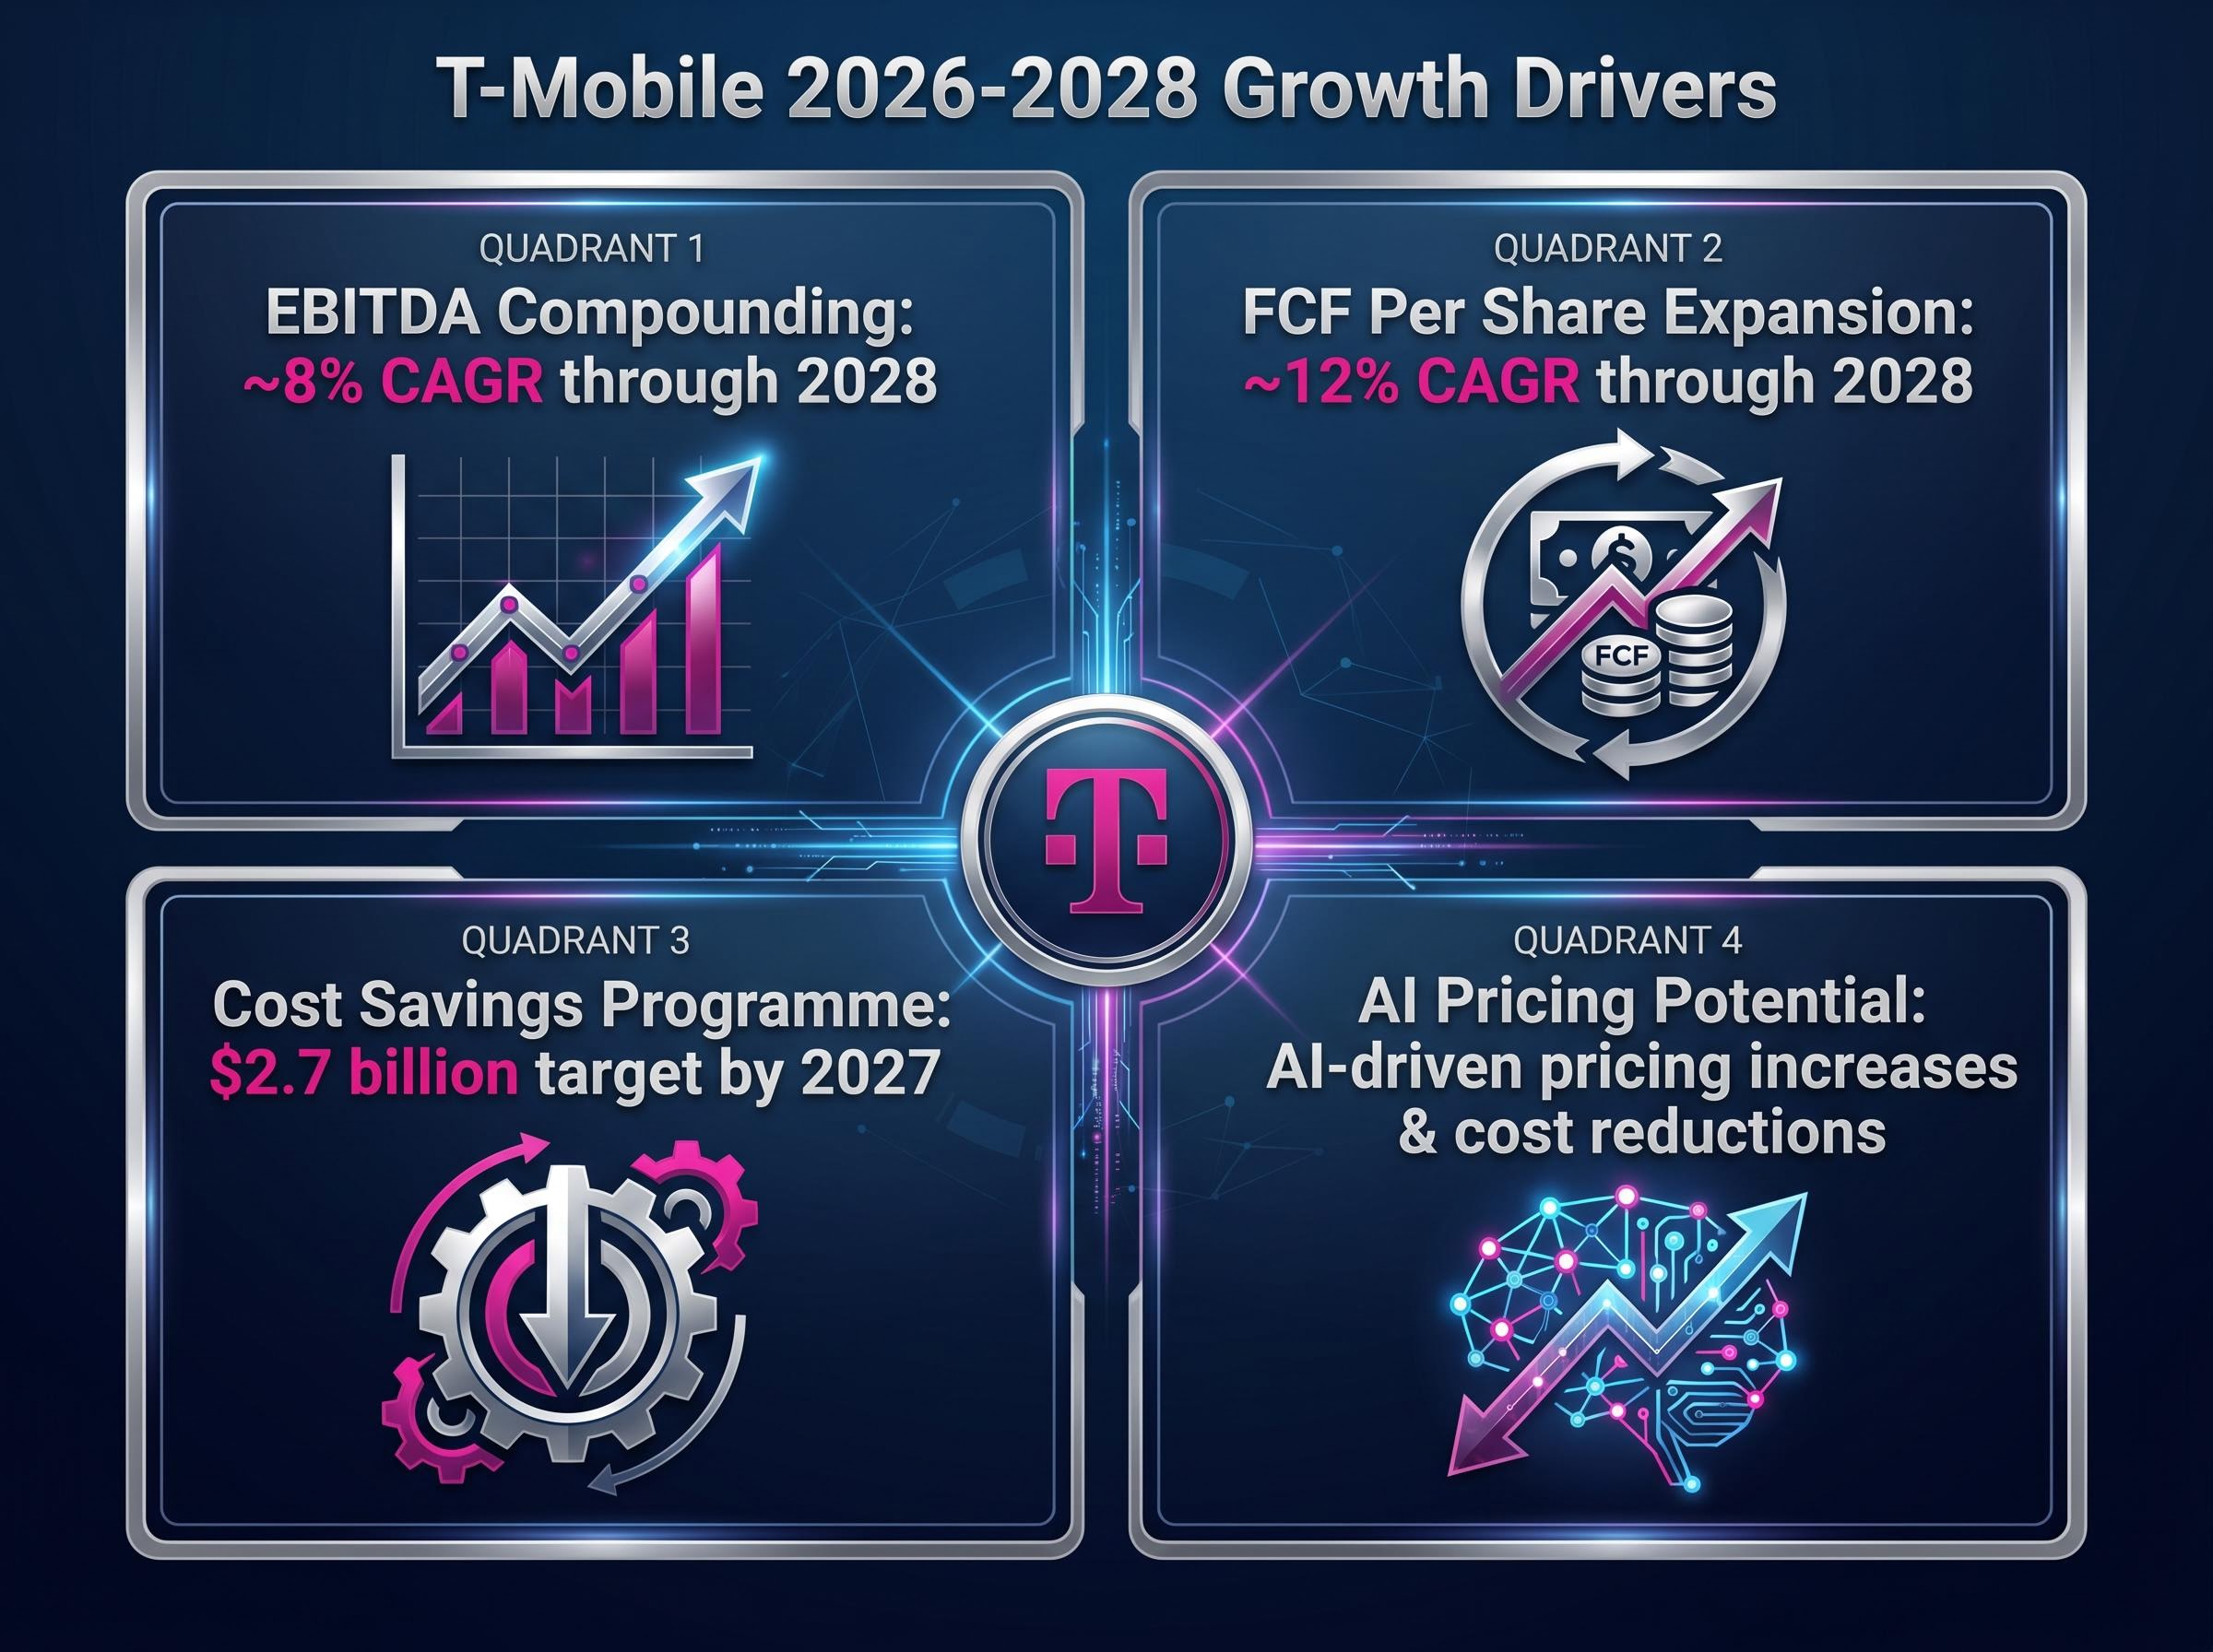
JPMorgan projects a core adjusted EBITDA compound annual growth rate (CAGR) of approximately 8% through 2028. That figure forms the backbone of the multi-year thesis, but the more revealing number sits one layer deeper.
Free cash flow per share is projected to grow at approximately 12% CAGR through 2028, according to JPMorgan estimates.
Cash flow growth outpacing EBITDA growth at that ratio implies improving capital efficiency, not just top-line expansion. The operational lever supporting that trajectory is a $2.7 billion cost savings programme targeted for completion by 2027.
Four identified drivers reinforce one another:
Investors evaluating TMUS on a multi-year horizon should note that the growth case does not depend on a single catalyst. Subscriber expansion in underpenetrated segments, an identified cost savings target, and an emerging AI thesis represent multiple reinforcing tailwinds.
Three takeaways define the Q1 2026 earnings cycle for T-Mobile: a broad beat across every headline metric, a meaningful guidance raise across all three tracked ranges, and two analyst actions that express long-term conviction through different mechanisms and at different price points.
The context matters. TMUS entered this print down approximately 8% year-to-date against an S&P 500 gain of approximately 4.7%. A single quarter, however strong, does not close that gap on its own.
The question that frames the rest of 2026 is whether T-Mobile can sustain the subscriber and margin momentum that justified the raised guidance, particularly as AT&T and Verizon respond competitively. The Q1 numbers earned the right to ask that question from a position of strength.
This article is for informational purposes only and should not be considered financial advice. Investors should conduct their own research and consult with financial professionals before making investment decisions. Past performance does not guarantee future results. Financial projections referenced are subject to market conditions and various risk factors.
A Net Promoter Score measures how likely customers are to recommend a service to others; T-Mobile's score of 45 is more than 20% above its nearest competitor, indicating a structural customer satisfaction advantage that supports sustained subscriber growth.
T-Mobile reported earnings per share of $2.27 against a consensus estimate of $2.05, representing an approximately 10.73% positive surprise and reversing the Q4 2025 miss of $1.88 against a $2.00 consensus.
T-Mobile raised its postpaid account net additions range to 950,000-1,050,000, its core adjusted EBITDA range to $37.1 billion-$37.5 billion, and its adjusted free cash flow range to $18.1 billion-$18.7 billion.
JPMorgan reduced its TMUS price target from $300 to $275 to reflect a valuation reset after the stock declined approximately 8% year-to-date, but maintained its Overweight rating and kept TMUS on its U.S. Equity Analyst Focus List because its own estimates remain above T-Mobile's guidance midpoints on all three key metrics.
JPMorgan projects T-Mobile's free cash flow per share to grow at approximately 12% CAGR through 2028, supported by an 8% EBITDA CAGR, a $2.7 billion cost savings programme targeted for completion by 2027, and AI-driven pricing and efficiency gains identified by Oppenheimer.