Cook Warns Memory Costs Will Force Apple Price Increases in 2026
1 hr ago
North America same-store sales growth improved 13 percentage points across six consecutive quarters, yet Wall Street’s EPS forecasts for Starbucks in fiscal 2028 spread across a $0.35-per-share gap depending on which analyst firm is doing the modelling. The quarterly beat matters. The divergence matters more.
Starbucks reported Q2 FY2026 results on 28 April 2026, delivering revenue up 9% to $9.5 billion, adjusted EPS of $0.50 (beating consensus), and global comparable sales growth of 6.2%. Management simultaneously raised full-year comparable sales guidance to above 5% (from above 3%) and lifted the EPS guidance range to $2.25-$2.45 from $2.15-$2.40. Shares jumped approximately 6% on the news.
Both Evercore and Wolfe Research have since revised their multi-year estimates, arriving at meaningfully different conclusions about the pace of margin recovery through fiscal 2028. What follows moves past the headline stock move to examine what is actually being priced in, where the two forecasts diverge, which catalysts will determine who is right, and what that framework means for investors weighing SBUX near $98.67.
A 6% post-earnings pop looks like a strong quarter rewarded. It is. But the more significant signal sits beneath the single-quarter result.
Revenue of $9.5 billion (up 9%), global comparable sales of $6.2%, and adjusted EPS of $0.50 ahead of estimates are the surface metrics. The trajectory underneath them is what shifted analyst models:
The Starbucks Q2 FY2026 earnings release confirmed consolidated net revenues of $9.5 billion, global comparable store sales growth of 6.2%, and the simultaneous guidance raise across both comparable sales and EPS ranges, providing the primary-source financial disclosures that underpinned the subsequent analyst revisions.
The credibility marker analysts pointed to was not the headline beat but the composition of North America growth. Transaction growth, rather than ticket size increases, drove the improvement. That distinction matters because traffic-driven comparable sales carry higher repeat probability than price-driven gains.
North America comparable store sales of 7.1% were powered by transaction volume growth of 4.4%, the strongest transaction growth in three years and the second consecutive quarter of positive traffic, a sequencing that makes the recovery harder to dismiss as a single-period anomaly.
Evercore noted that North America same-store sales improved 13 percentage points across the six most recent quarters, a trajectory that has become statistically difficult to dismiss as a one-off recovery.
The guidance raise carries more analytical weight than the quarter itself. When management lifts both comparable sales and EPS ranges simultaneously, the signal is confidence in sustainability, not simply a reflection of a single strong period. For investors evaluating SBUX at current levels, the distinction between a one-quarter bounce and a multi-quarter inflection is the foundational analytical step.
Top-line recovery is confirmed. The harder question is how much of that revenue growth converts into earnings growth, and when. The bull case rests on a sequence of interlocking margin conditions, each with its own timing risk.
The first condition is the simplest mechanically but the most frequently misunderstood. Starbucks invested heavily in labour, staffing levels, and wages through FY2025 and into FY2026. Those costs compressed margins in the periods they were incurred. Once those elevated-cost quarters become the prior-year comparison base, FY2027 margins benefit mechanically from lapping the reinvestment.
This is a timing dynamic, not a permanent cost reduction. The labour costs remain in the cost structure. What changes is the year-over-year comparison, making margin expansion appear even if absolute costs hold steady.
Evercore estimates that North America incremental margins ran at approximately negative 7% in FY2026. The firm projects those same incremental margins will exceed 50% in FY2027 as the labour lapping effect, moderation in coffee cost inflation, and productivity savings accumulate simultaneously.
The second condition is the accumulation of productivity savings, which Evercore expects to reach a cumulative $2 billion by FY2028. The operational levers include technology deployment, supply chain optimisation, and store-level labour efficiency.
The cumulative framing is worth noting. A $2 billion total by FY2028 does not mean $2 billion per year; it means annual contributions that are smaller individually and back-loaded toward the later fiscal years.
| Metric (Evercore Estimates) | FY2026 | FY2027 | FY2028 |
|---|---|---|---|
| North America Incremental Margins | Negative 7% | Exceeds 50% | Further expansion expected |
| Cumulative Productivity Savings | Building | Accelerating | $2 billion target |
| EPS Estimate | $2.45 | $3.25 | $4.00 |
The FY2026-to-FY2027 incremental margin inflection is the single most consequential number in the multi-year thesis. If it arrives on schedule, the EPS step-up follows. If it stalls, the entire forward earnings trajectory compresses.
The numbers tell the story before the analysis does.
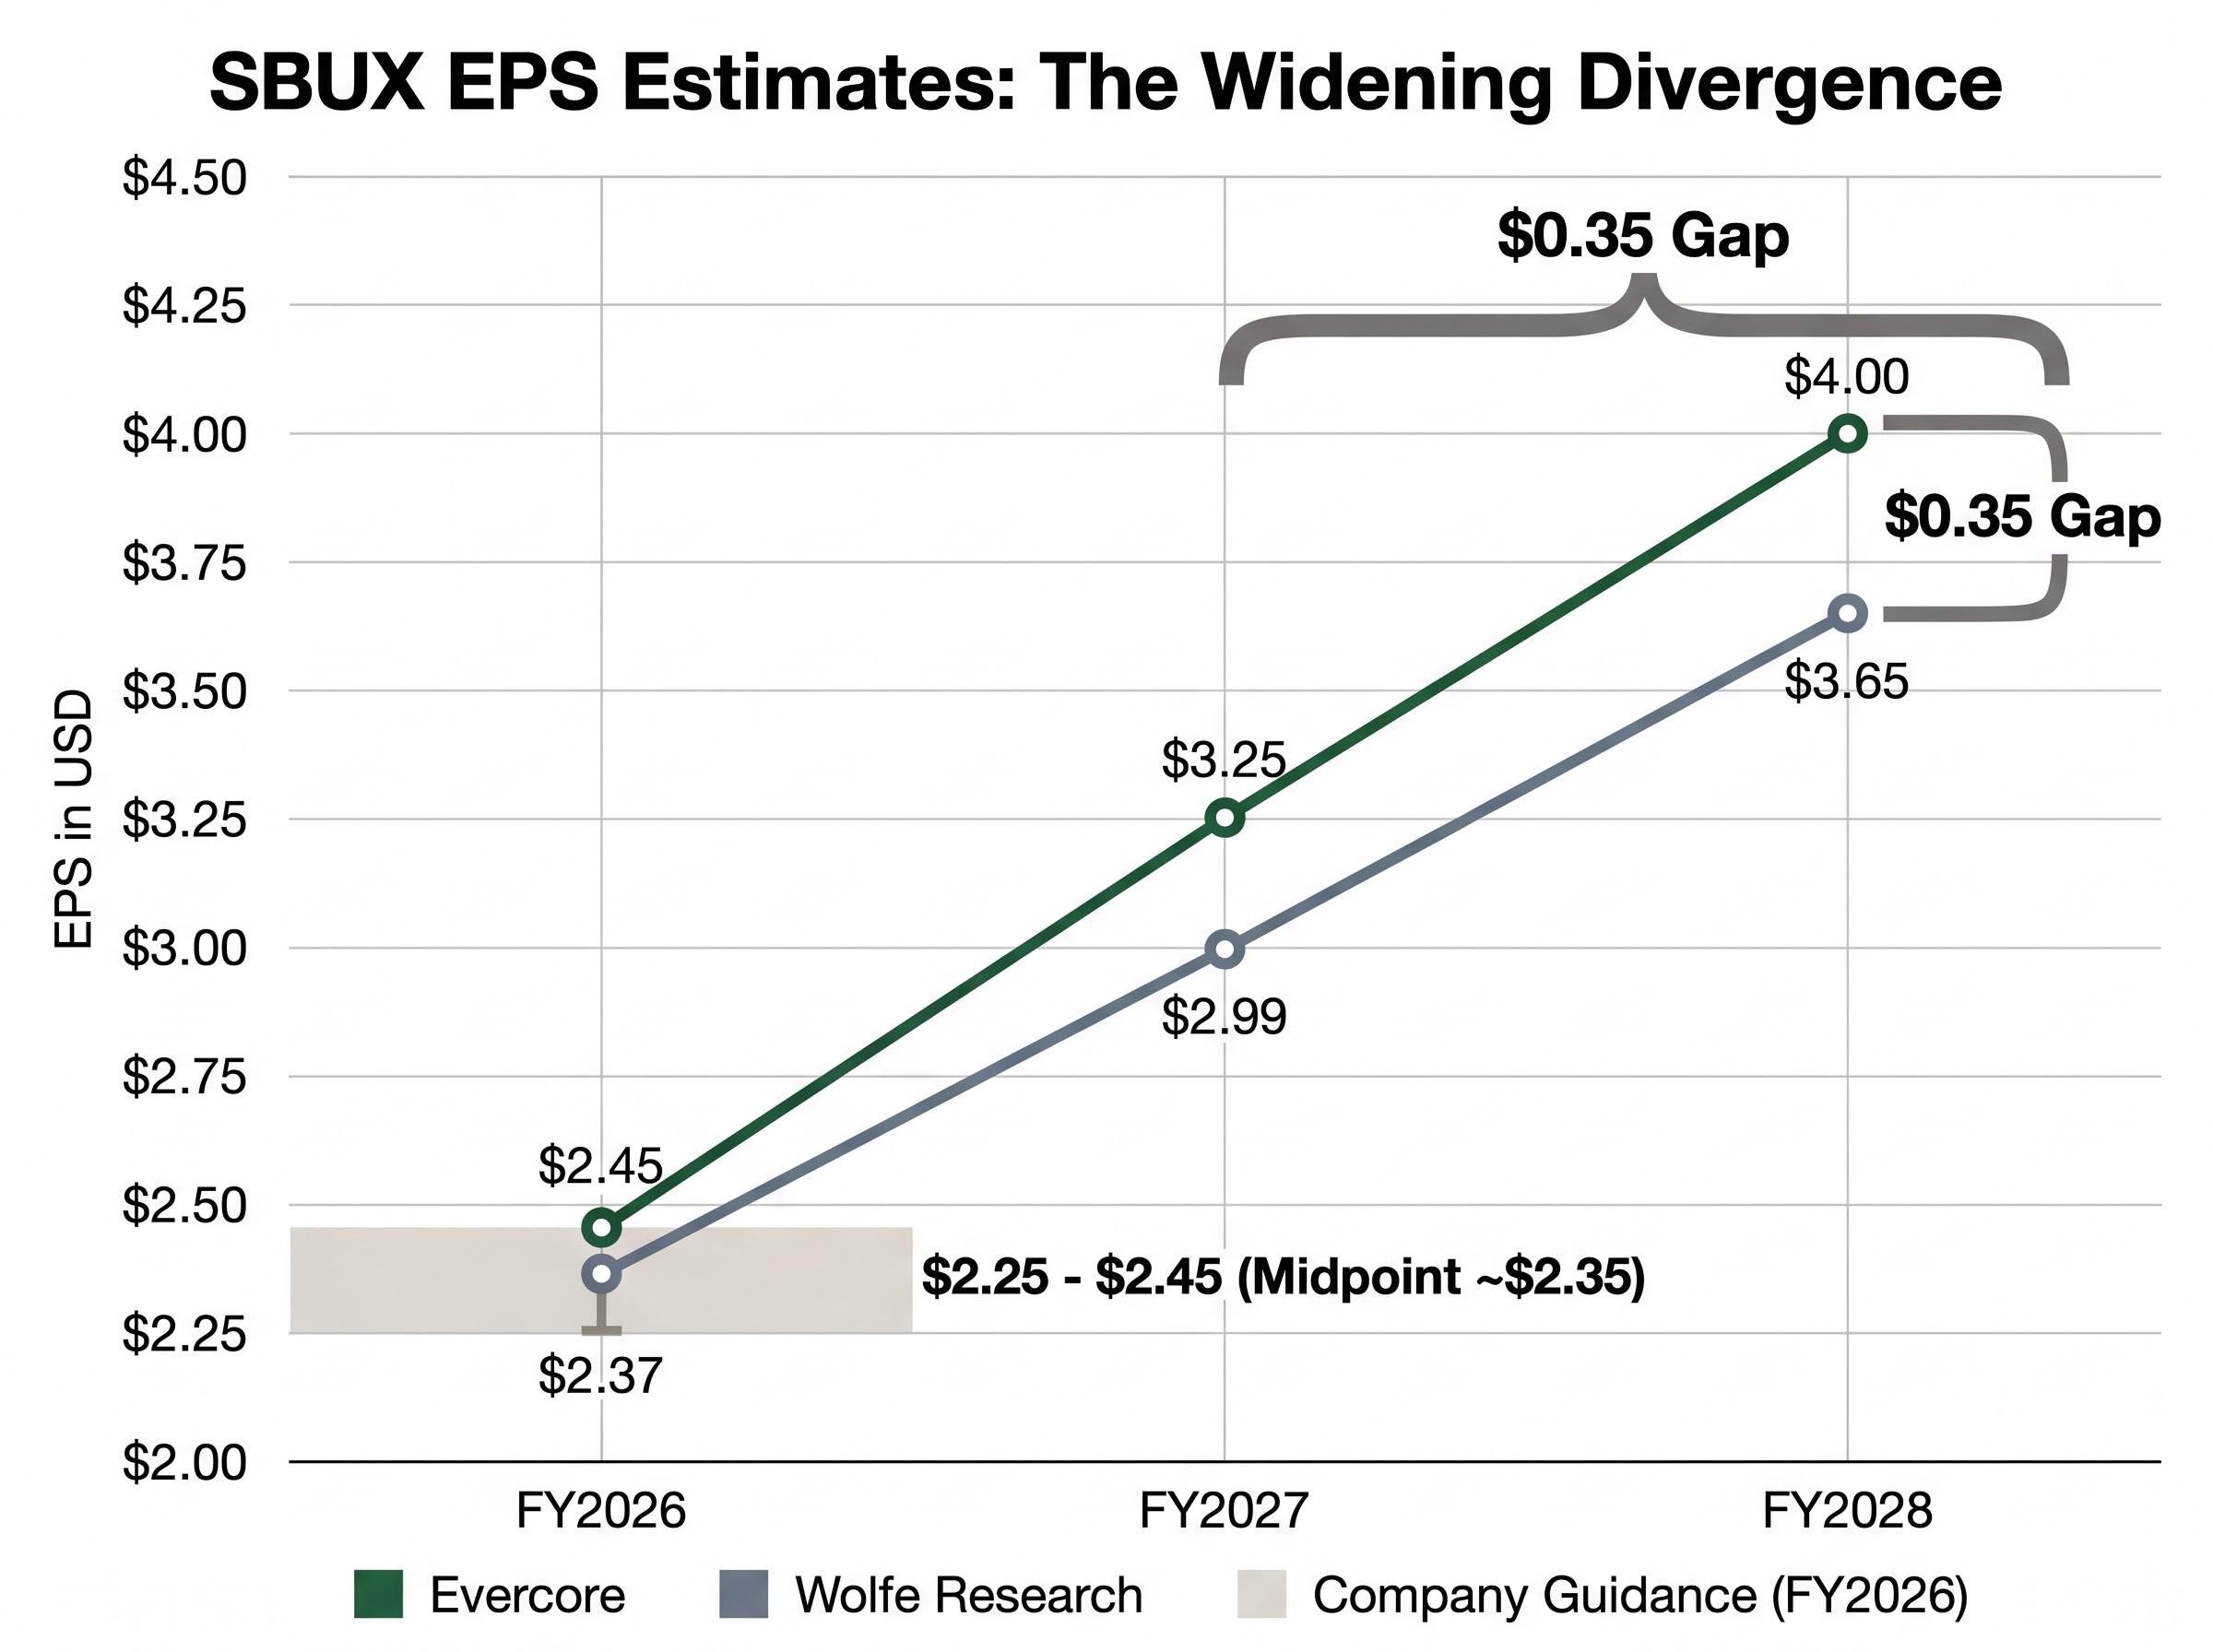
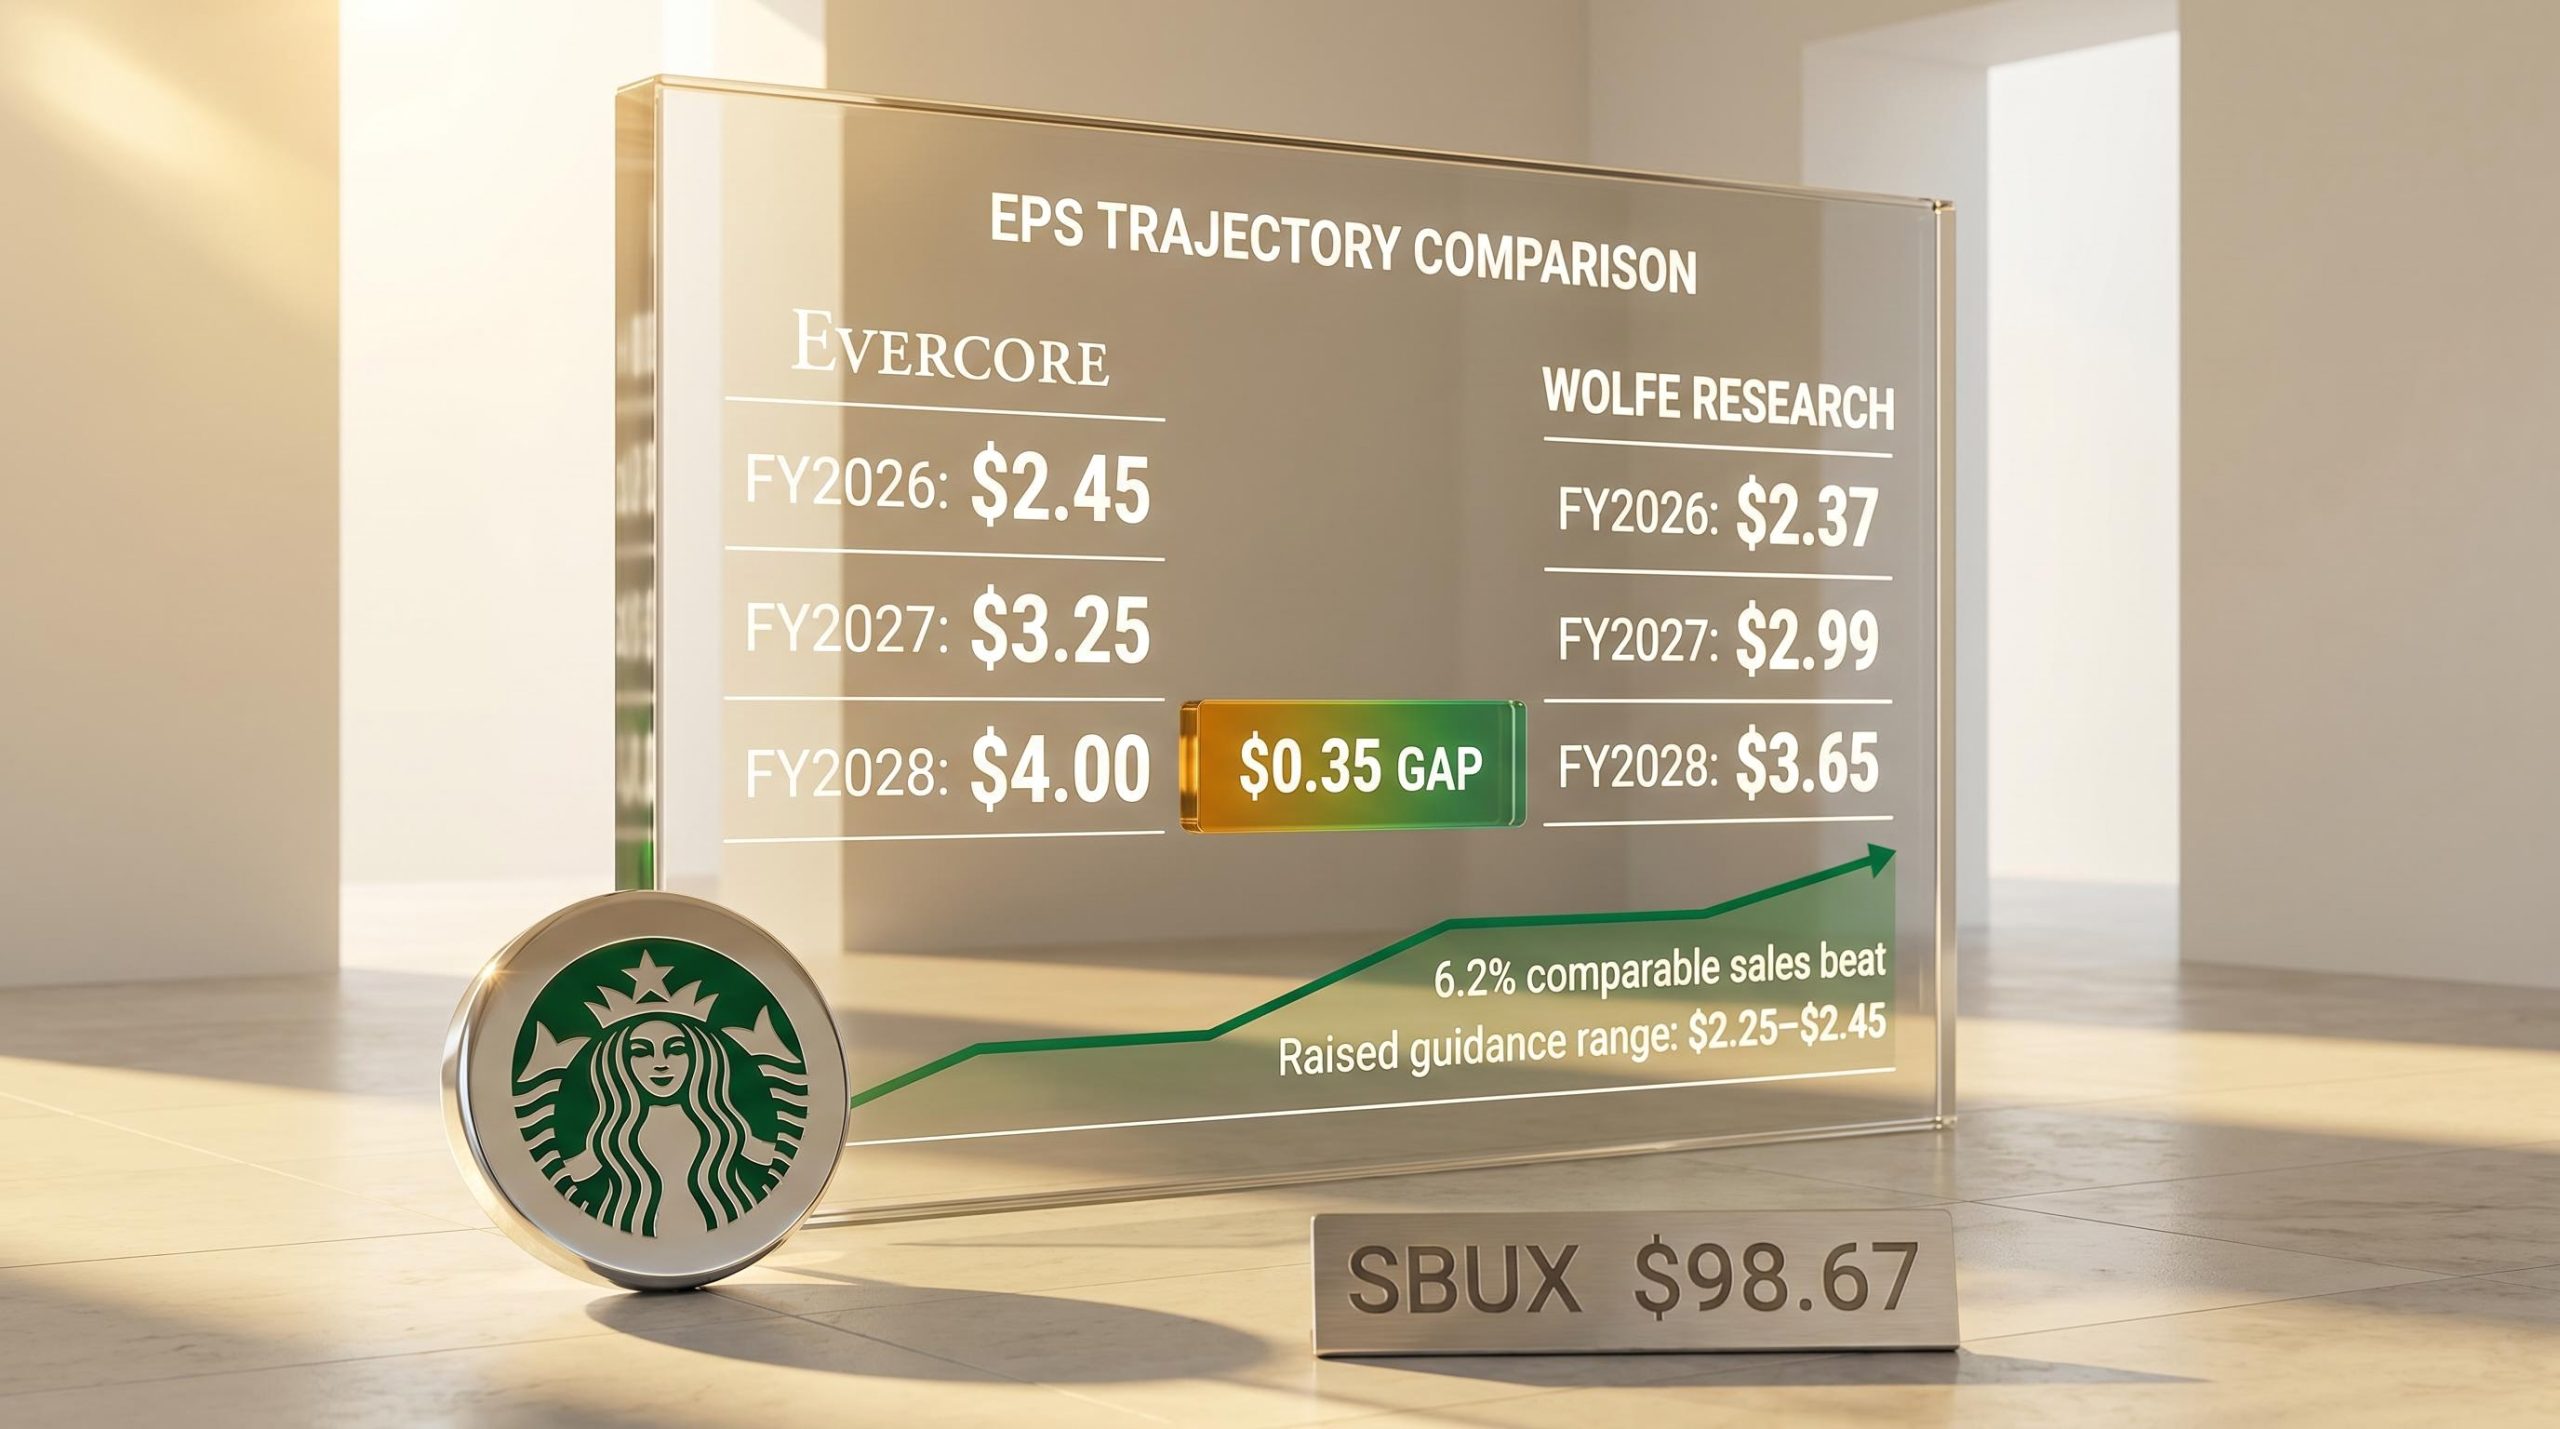
| Fiscal Year | Evercore EPS Estimate | Wolfe Research EPS Estimate | Company Guidance |
|---|---|---|---|
| FY2026 | $2.45 | $2.37 | $2.25-$2.45 (midpoint ~$2.35) |
| FY2027 | $3.25 | $2.99 | Not yet guided |
| FY2028 | $4.00 | $3.65 | Not yet guided |
In FY2026, the gap is a modest $0.08. By FY2028, it widens to $0.35. Both firms revised estimates upward following Q2, which is the consensus signal: the direction of the recovery is not in dispute. The divergence is about pace and magnitude.
The specific driver of the gap is margin recovery assumptions. Evercore’s model embeds the 50%-plus incremental margin projection for FY2027 and a steeper productivity savings ramp. Wolfe Research models a more conservative flow-through, implying that labour cost lapping and productivity savings accumulate more gradually than Evercore assumes.
The single most consequential assumption separating the two forecasts is Evercore’s projection that North America incremental margins will exceed 50% in FY2027, a figure that implies the vast majority of top-line growth in that year drops directly to the bottom line.
Evercore maintains an Outperform rating with a price target of $115 (raised from $110). For investors building a position thesis, knowing which margin assumption to test is more useful than averaging the two forecasts. The $0.35 FY2028 gap implies meaningfully different fair value outcomes at any given price-to-earnings multiple.
The backward-looking data is settled. The forward-looking question is which observable events over the next 12-18 months will tell investors whether the Evercore or Wolfe scenario is unfolding. Three catalysts carry the most diagnostic weight:
McKinsey research on loyalty program mechanics shows that points-based currencies and restructured redemption tiers can measurably increase visit frequency and customer lifetime value when programme changes successfully re-engage lapsed members rather than simply reshuffling existing spend, which is precisely the distinction Wolfe Research flagged as the key variable in assessing Starbucks’ March 2026 loyalty restructuring.
Analyst commentary on Q2 focused heavily on North America strength. International challenges were acknowledged but did not overshadow the domestic recovery narrative. Neither Evercore nor Wolfe appears to be embedding a meaningful international recovery in their base-case estimates.
That creates a form of optionality. If stabilisation occurs in markets such as China, it represents upside to both firms’ models rather than a required input. Investors should treat international recovery as a potential catalyst rather than a base-case assumption.
At approximately $98.67 (intraday on 29 April 2026), Starbucks is trading near the median consensus target of approximately $100. Year-to-date gains of approximately 16.27% and a price roughly 6% below the 52-week high of $104.82 suggest the initial turnaround narrative has been substantially priced in.
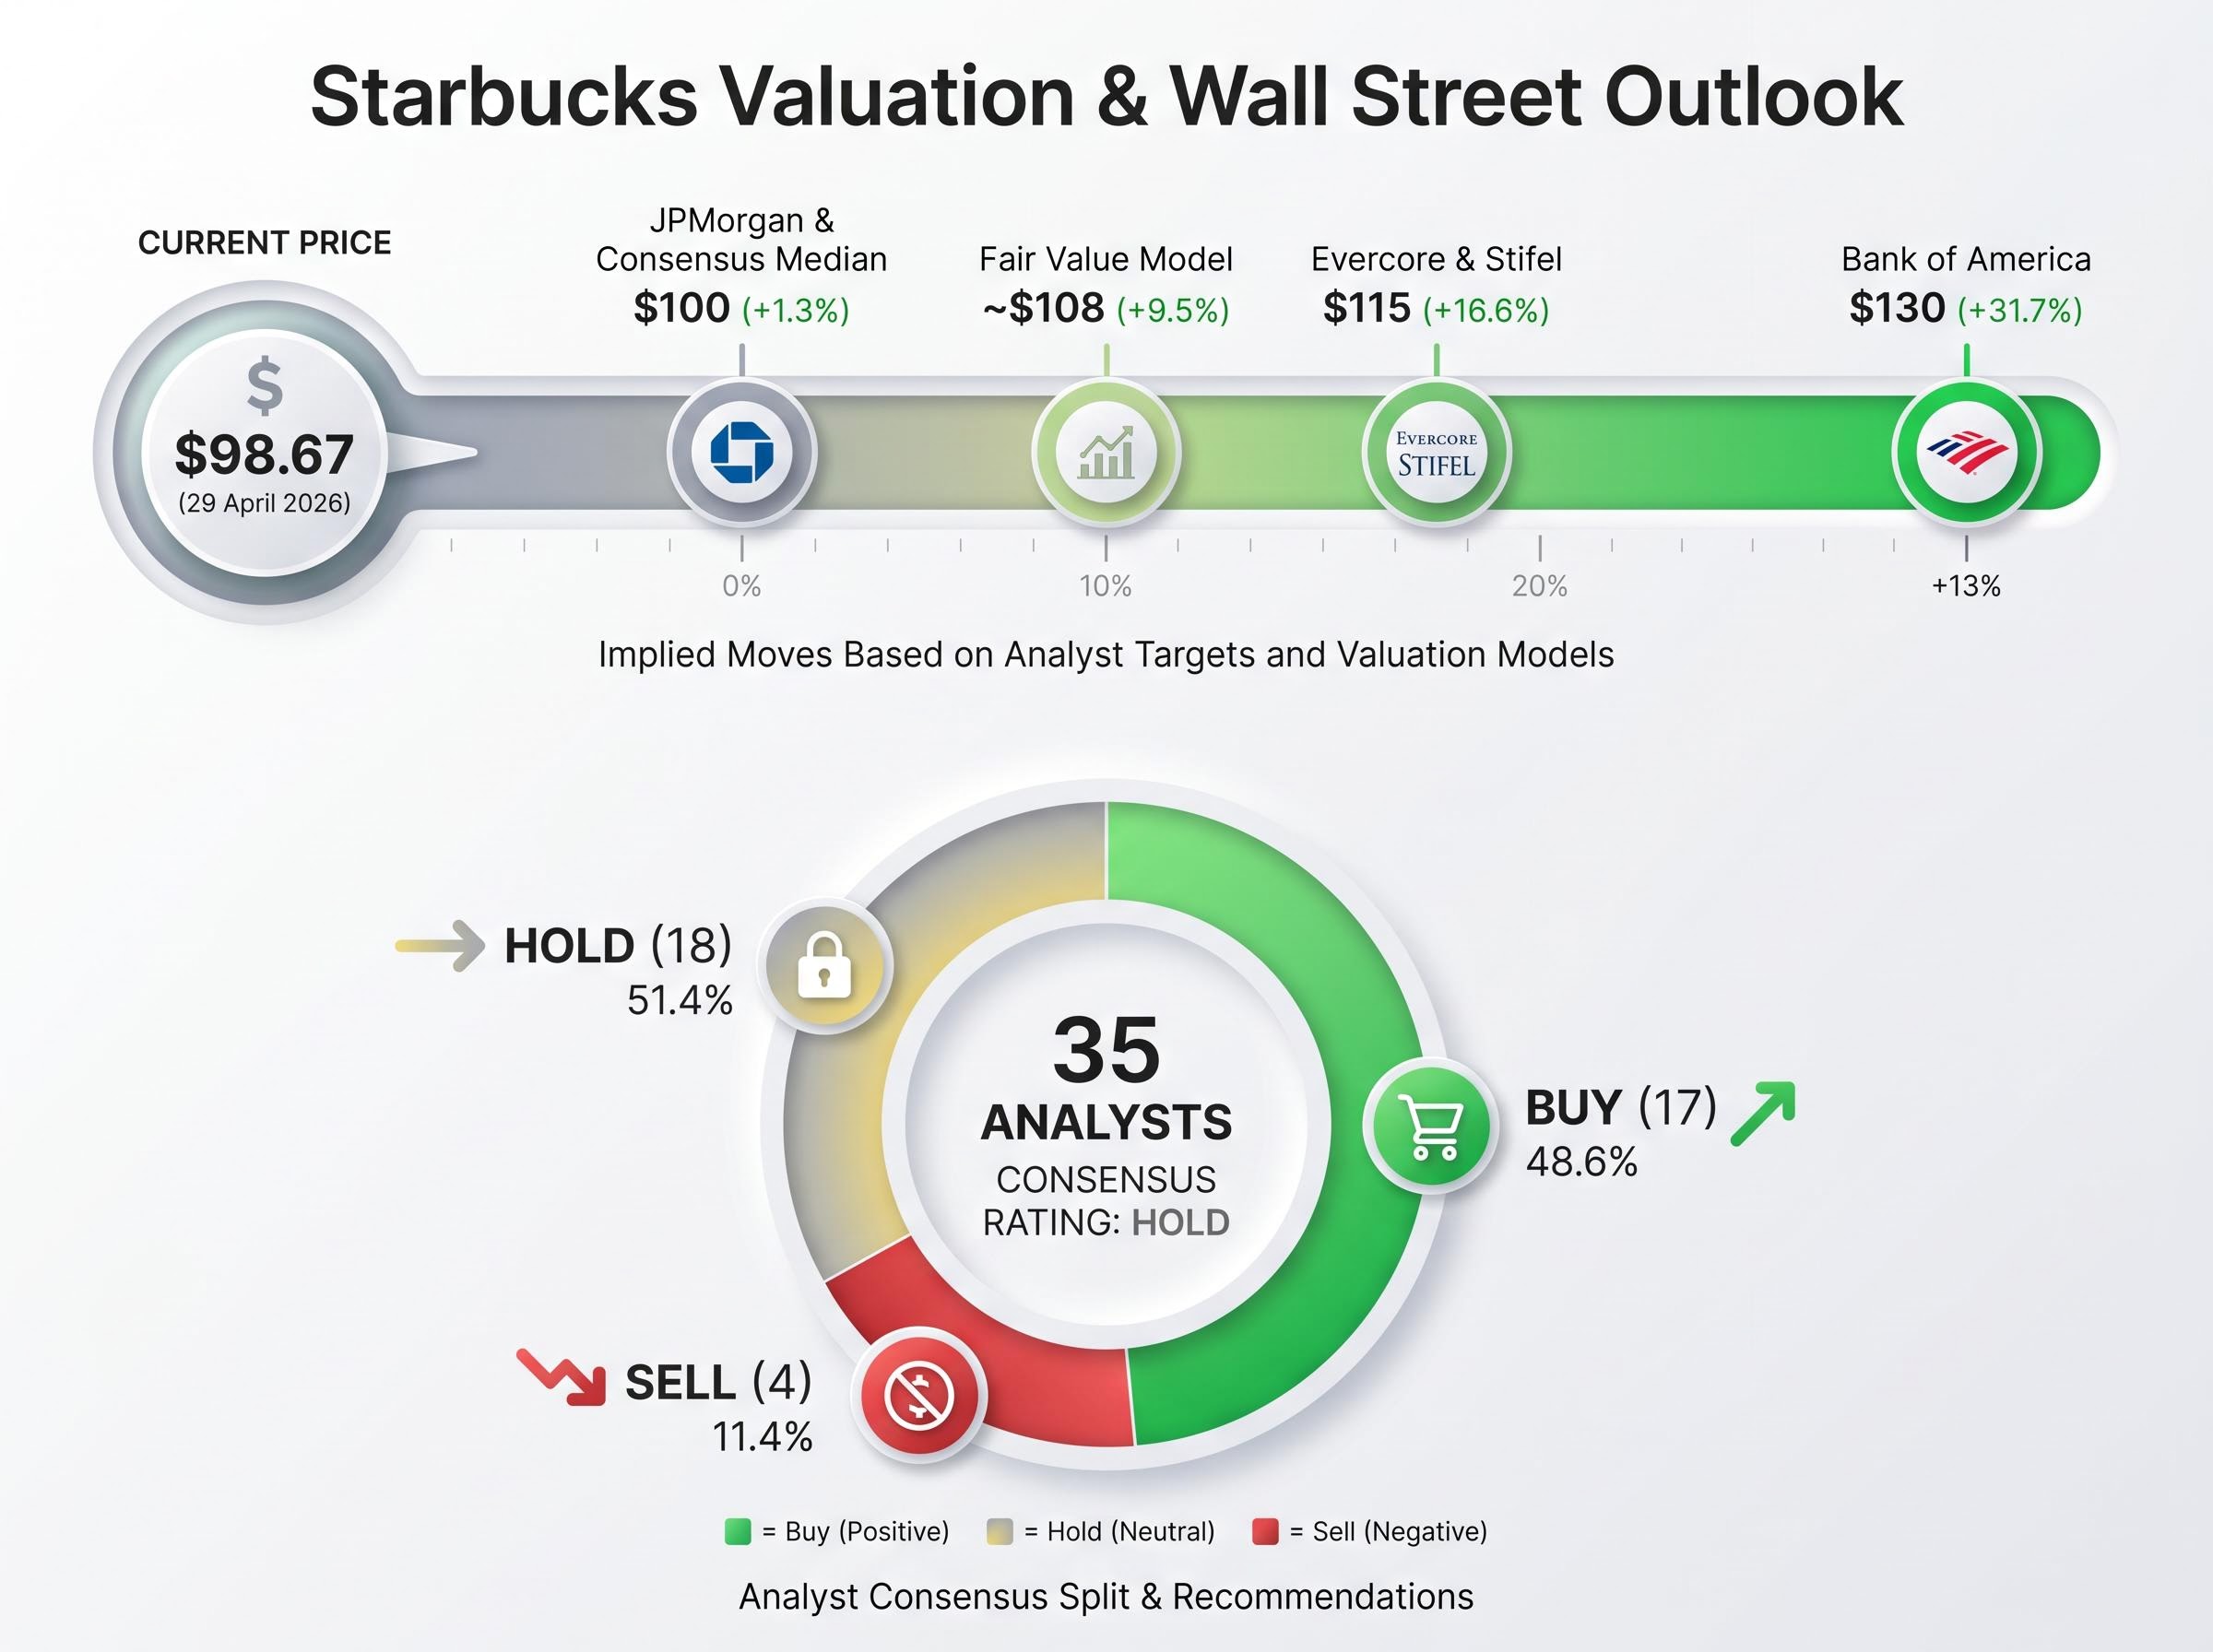
| Source | Price Target | Implied Move from $98.67 | Rating |
|---|---|---|---|
| Bank of America | $130 | +31.7% | Buy |
| Evercore | $115 | +16.6% | Outperform |
| Stifel | $115 | +16.6% | Buy |
| Fair Value Model | ~$108 | +9.5% | N/A |
| JPMorgan | $100 | +1.3% | Overweight |
| Consensus Median | ~$100 | +1.3% | Neutral |
Analyst ratings on Starbucks split nearly evenly: 17 Buy, 18 Hold, and 4 Sell across approximately 35 covering analysts, reflecting a market that recognises the turnaround direction but remains divided on the magnitude of remaining upside.
The 52-week range of $75.50 to $104.82 provides context. The stock has recovered 30.7% from its low. At $98.67, the consensus view implies limited near-term upside, while the bull-case targets from Evercore and Stifel ($115) and Bank of America ($130) imply 16-32% upside, contingent on the FY2027-FY2028 margin inflection arriving as modelled.
The next leg of upside, if it materialises, is an earnings-delivery story, not a narrative re-rating story.
The analytical conclusion from the preceding sections is straightforward in direction and uncertain in magnitude. The top-line recovery is confirmed. The margin recovery is still in transit. The FY2027 incremental margin inflection is the single event that will validate or challenge the bull case.
Investors who believe the margin mechanics will arrive on Evercore’s schedule (FY2028 EPS of $4.00) are buying a FY2027-FY2028 story at FY2026 prices. Those who align with Wolfe Research’s more conservative view (FY2028 EPS of $3.65) are pricing in a longer runway before full flow-through. The $0.35 gap between those endpoints defines the range of outcomes.
Three metrics over the next two to three quarters will provide the clearest signal:
The operating margin expansion required to close the gap between the current 9.4% operating margin and the 12.8% normalised assumption embedded in the $115 price target is 340 basis points, a figure that quantifies precisely how much execution headroom separates the bull case from current reality.
The guidance midpoint for FY2026 sits at $2.35. That is the near-term anchor. How the company tracks against it over the next two quarters will tell investors whether the margin inflection is arriving, or whether the consensus was right to price the stock at the median target.
This article is for informational purposes only and should not be considered financial advice. Investors should conduct their own research and consult with financial professionals before making investment decisions. Past performance does not guarantee future results. Financial projections are subject to market conditions and various risk factors.
—
Analyst estimates for Starbucks in fiscal 2028 range from $3.65 per share (Wolfe Research) to $4.00 per share (Evercore), a $0.35 gap driven primarily by differing assumptions about the pace of North America margin recovery.
Starbucks beat adjusted EPS estimates with $0.50 per share, reported global comparable sales growth of 6.2%, and simultaneously raised both its full-year comparable sales guidance (to above 5%) and EPS guidance range (to $2.25-$2.45), signalling confidence in the sustainability of its turnaround.
The core divergence is Evercore's projection that North America incremental margins will exceed 50% in FY2027, implying most top-line growth drops directly to the bottom line, while Wolfe Research models a more gradual accumulation of labour cost lapping and productivity savings.
Investors should track North America incremental margin progression in Q3 and Q4 FY2026, loyalty programme engagement metrics following the March 2026 restructuring, and management commentary on the pace of cumulative productivity savings toward the $2 billion FY2028 target.
At approximately $98.67, SBUX trades near the consensus median target of around $100, suggesting the initial turnaround narrative is largely priced in, with further upside of 16-32% contingent on the FY2027-FY2028 margin inflection arriving as modelled by the most bullish analysts.