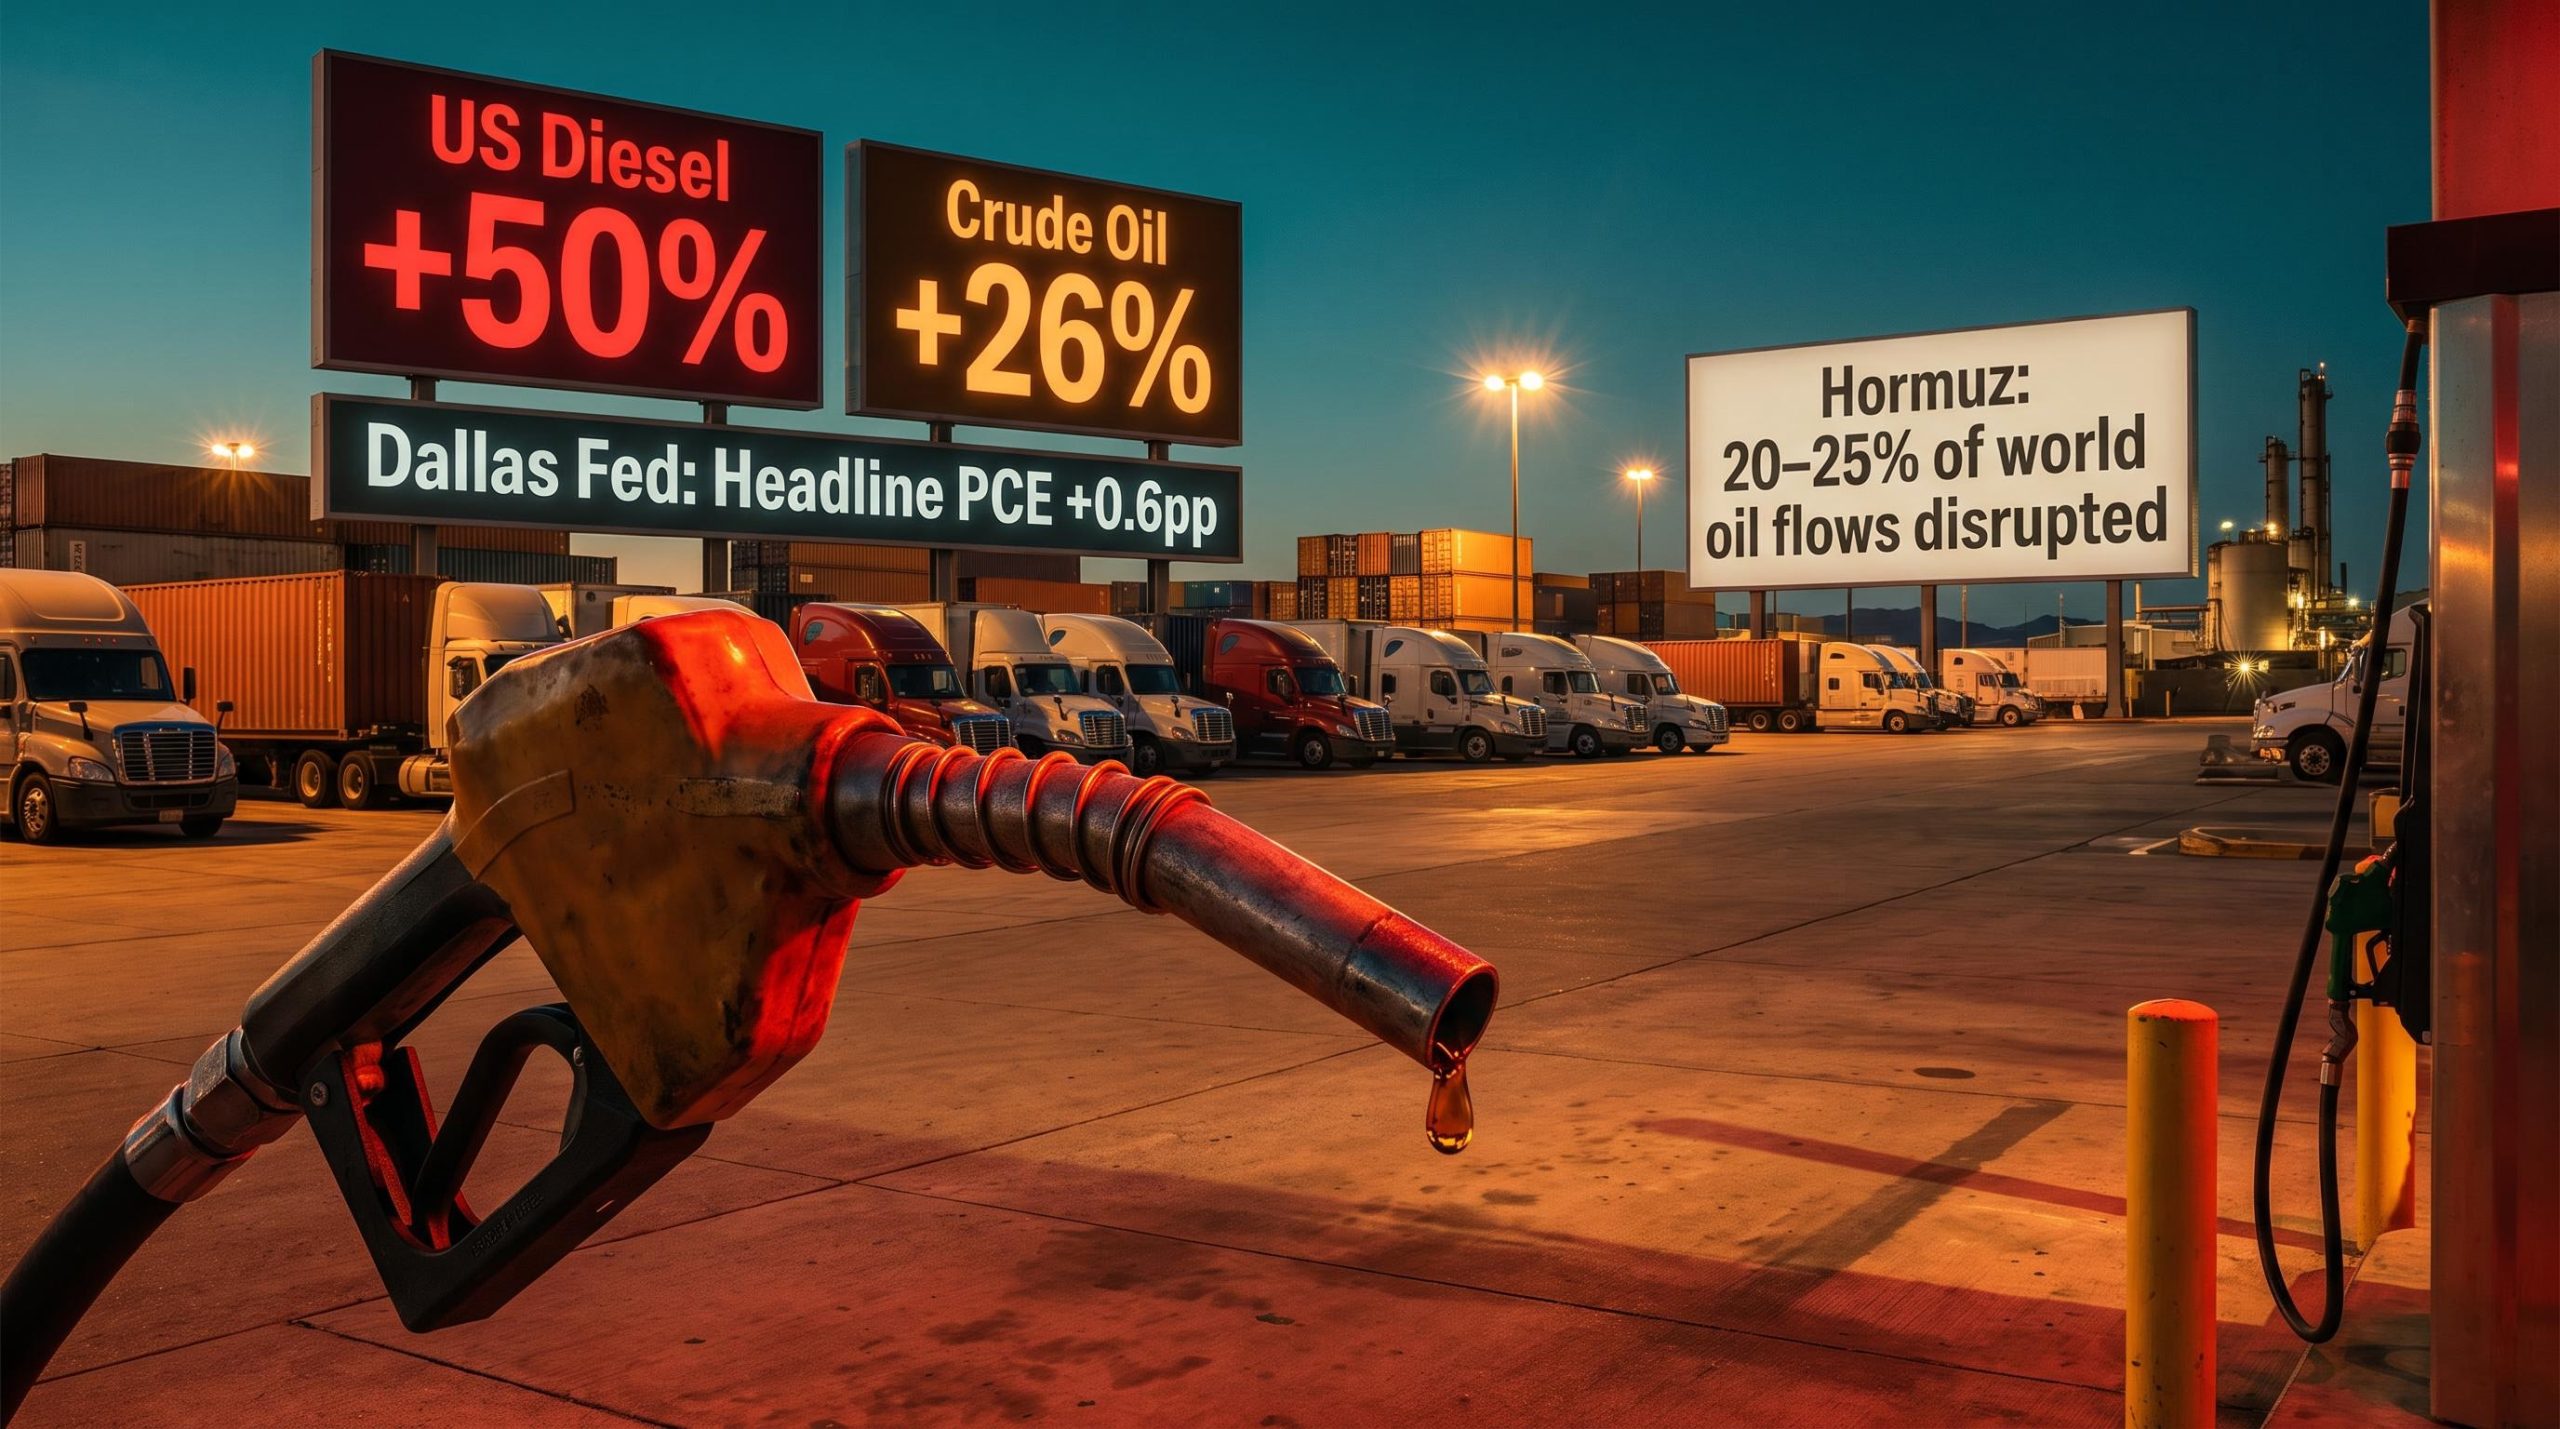
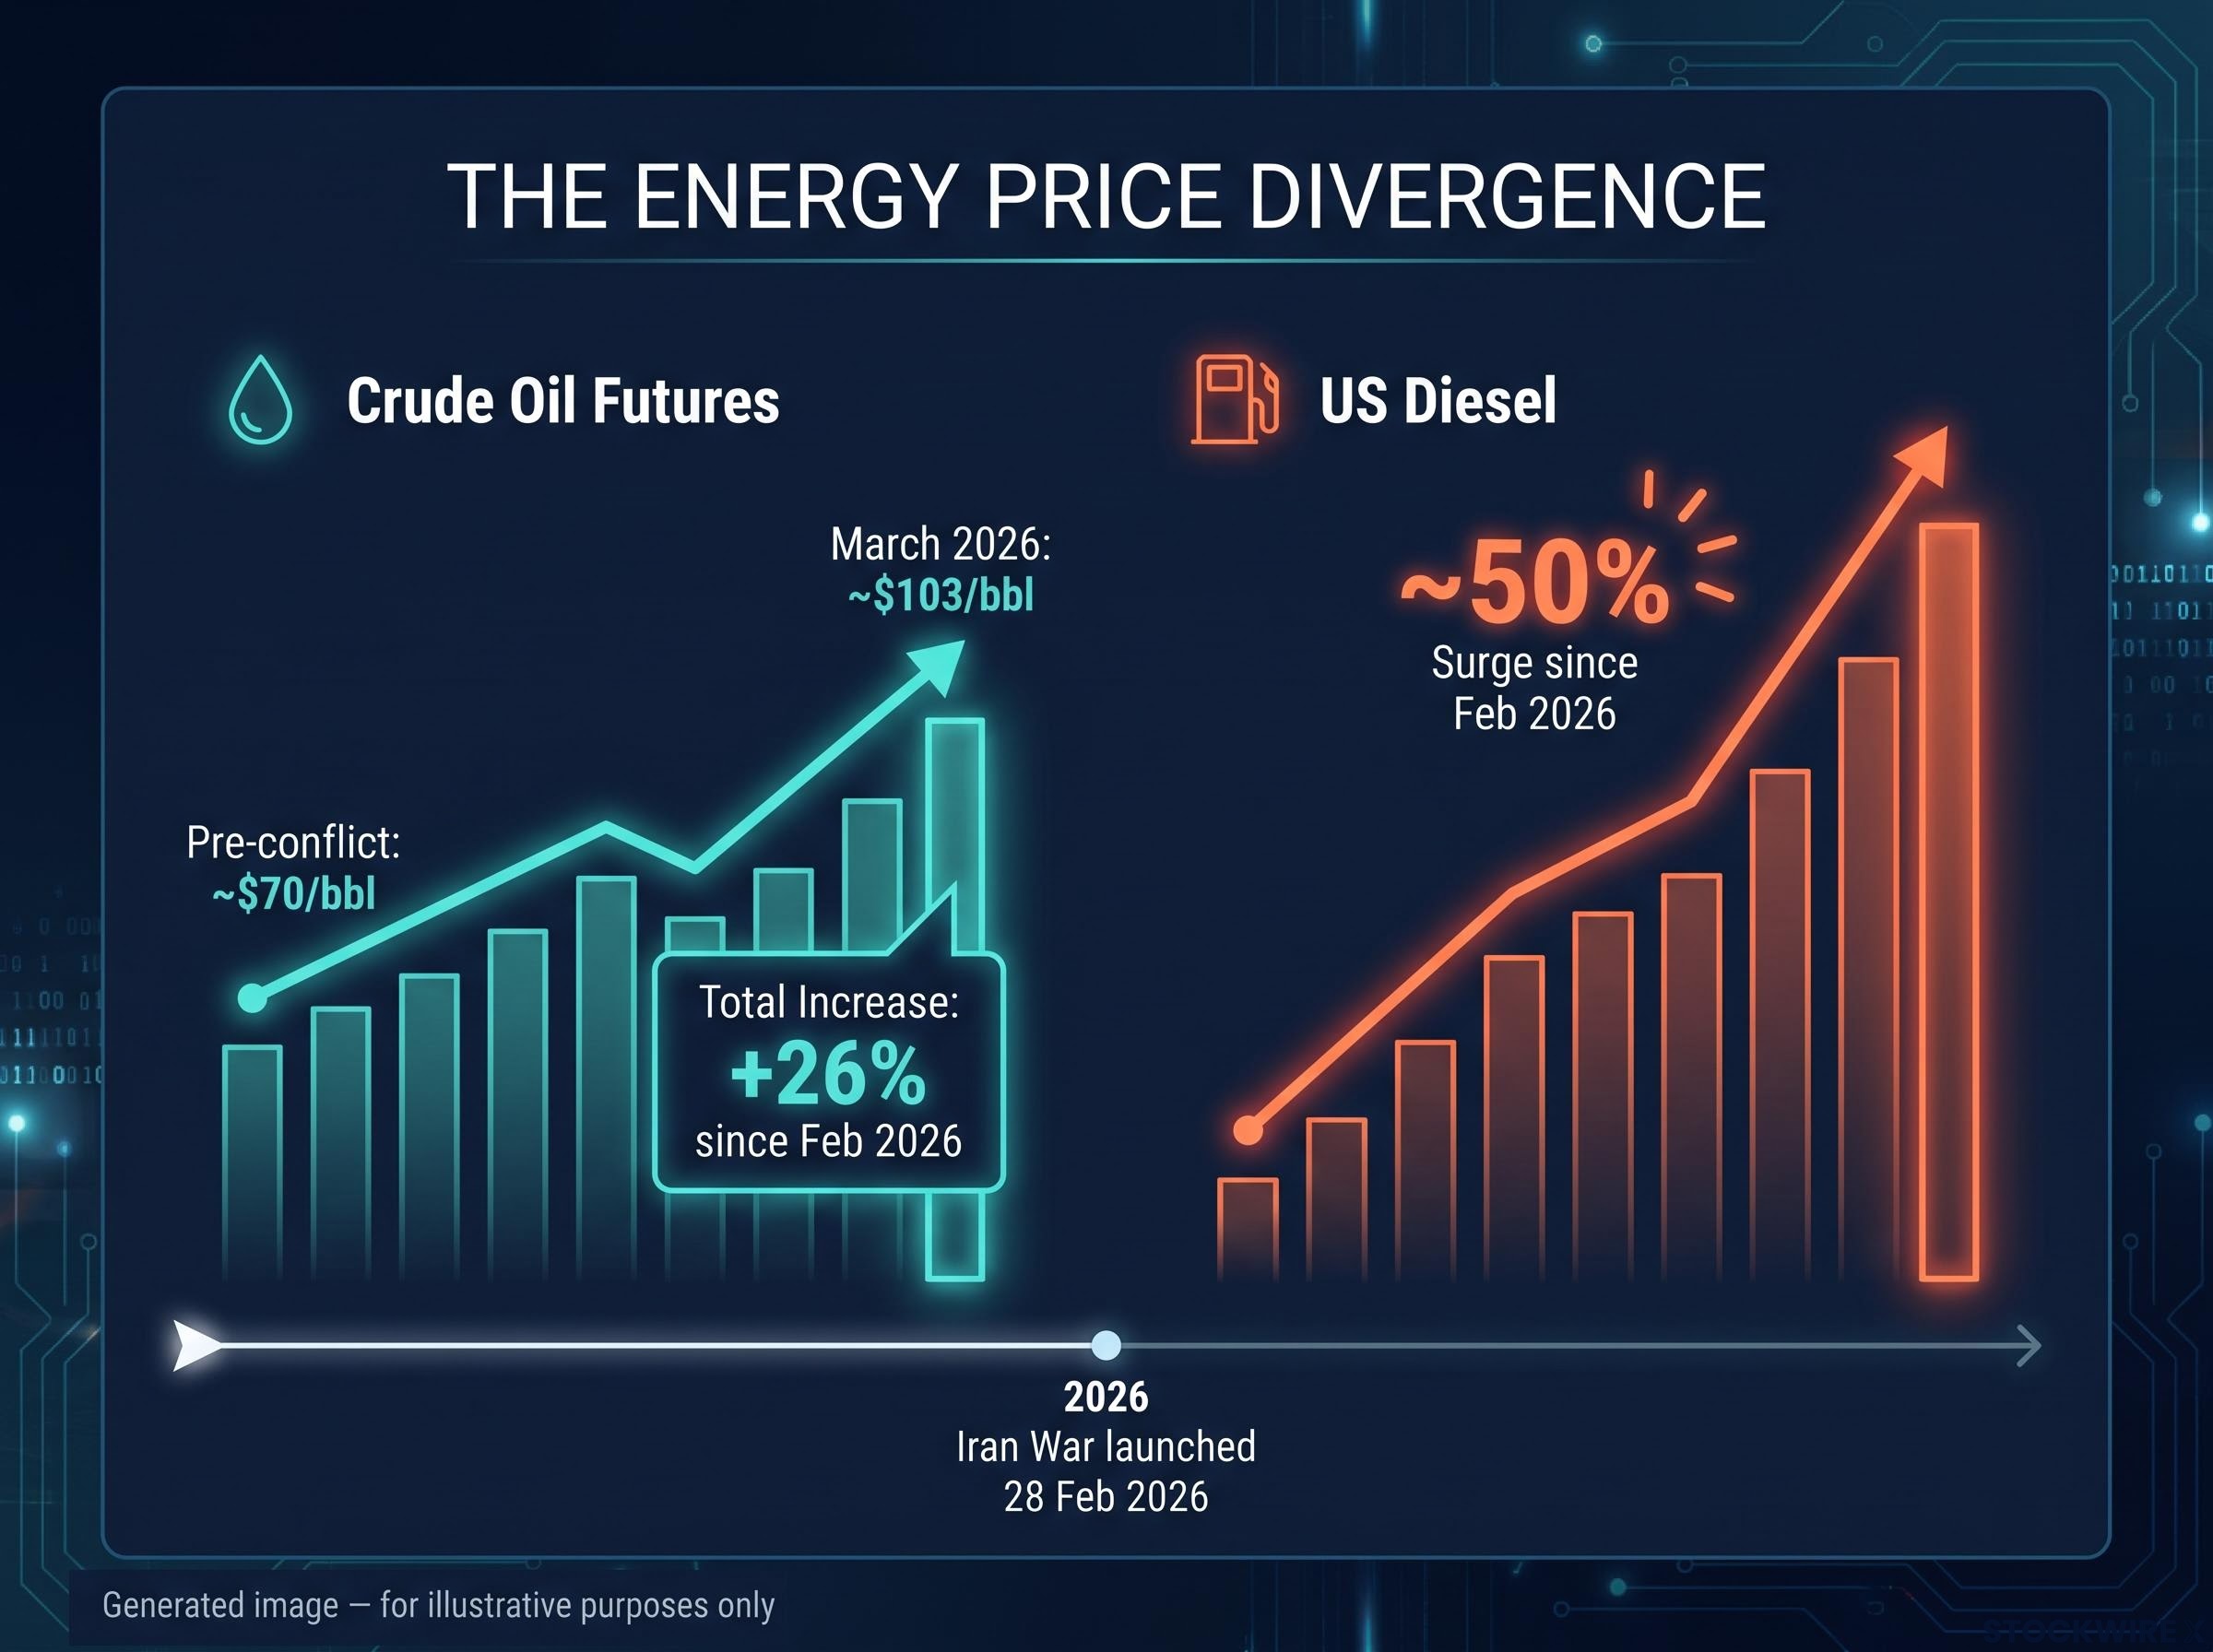
Since February 2026, the futures price for crude oil has climbed 26%, while US diesel has surged by close to 50% over the same period. That gap, nearly double, is the first signal that the standard way most people read inflation data right now is incomplete.
The 2026 Iran war, launched on 28 February 2026, has produced what the International Energy Agency (IEA) calls the largest seaborne oil supply disruption on record, affecting 20-25% of world oil flows through the Strait of Hormuz. Official inflation figures, the ones referenced by policymakers and repeated in headlines, are not capturing the full cost of this shock for households or investors.
Here is what the data actually tells you when you trace it properly: war-driven energy costs are filtering into prices that never show up under “energy” in any official breakdown, and understanding those hidden channels changes how you budget, how you invest, and how you interpret what central banks are signalling.
Why the official energy figure in CPI is structurally too narrow
In the US consumer price basket, energy accounts for just over 7% of the total weighting, while across the EU the equivalent HICP figure sits at close to 11%. Those weights look modest. They suggest energy is a secondary line item, not a dominant force.
That assumption is wrong, and the reason is structural. These weights capture only direct household uses of energy: the fuel you put in your car and the electricity bill you pay at home. They do not capture the energy embedded in producing and transporting every other good in the basket.
The diesel futures divergence from crude benchmarks confirmed physical delivery stress in refined products was materialising independently of the aggregate crude price — in mid-July, US diesel surged roughly 20% in a single week while WTI crude held near $79, a structurally predictable split that the crude-only headline figure never captured.
| Included in CPI energy weight | Not included in CPI energy weight |
|---|---|
| Petrol and diesel at the pump | Fuel used to transport food to supermarkets |
| Household electricity bills | Energy costs of manufacturing imported goods |
| Natural gas for home heating | Diesel powering logistics and courier networks |
| Piped gas supply | Aviation fuel costs embedded in airfare prices |
Why that matters during a supply shock
The IMF characterises energy price spikes as a negative supply shock that raises costs for energy-intensive goods and services across the entire supply chain. Energy is a universal production input. It is required to mine raw materials, run factories, refrigerate food, heat warehouses, and move goods to retailers. The gap between what the CPI energy line says and what energy actually costs the economy is the structural reason headline inflation consistently lags the lived experience of households and firms during an oil shock. If you are benchmarking inflation expectations to that 7-11% energy weight, you are systematically underestimating cost pressure.
When big ASX news breaks, our subscribers know first
How war-driven energy costs travel through prices outside the energy category
Core inflation, the measure that strips out direct food and energy line items, is widely presented as a cleaner signal of underlying demand pressure. It is supposed to tell you what is happening beneath the volatile surface of fuel and food prices.
In a war-driven energy shock, that distinction breaks down. Stripping “energy” from the measure does not strip out energy cost pressure.
UBS economist Paul Donovan has framed this directly:
Core inflation figures that formally exclude food and energy nevertheless incorporate energy cost effects through categories such as airfares and delivery charges.
Two specific channels illustrate the mechanism:
- Airfares: Aviation fuel is a major airline operating cost. When jet fuel prices surge, airlines pass costs into ticket prices. Airfares sit in the core CPI basket, not the energy category. Higher jet fuel shows up as “services inflation.”
- Delivery and logistics: Higher diesel costs for truck, van, and courier networks appear as shipping surcharges and higher retail prices for delivered goods. These are classified under transport or goods prices, not energy.
The ECB now explicitly acknowledges that the war-related rise in energy prices is the main driver of higher euro area inflation, with indirect effects on non-energy inflation wider and more persistent than standard models assumed. BNP Paribas warns that second-round effects, where firms pass higher energy input costs into final prices across the non-energy basket, are already visible in current data.
The Dallas Fed estimates US core inflation is approximately 0.2 percentage points higher on a Q4/Q4 2026 basis under its baseline war scenario. That number sounds small until you recognise it is measuring only the energy-driven contamination of a measure specifically designed to exclude energy. When a central bank says core inflation is elevated, and energy prices are simultaneously surging, you should treat core as a noisy signal rather than a clean read on demand. Part of what looks like demand-driven pressure is war-driven cost pass-through wearing a different label.
The headline versus core CPI split in May 2026 data — headline at 4.2% against a comparatively contained core of 2.9% — is the clearest real-world expression of this contamination: the 1.3 percentage-point gap was driven almost entirely by a 40.5% annual surge in gasoline prices, not by broad domestic demand pressure.
What the numbers actually show when you look beyond the headline
The gap between headline inflation and true war-driven price pressure has been quantified, and the institutional estimates are consistent in direction even where they differ in magnitude.
The Dallas Fed provides the most specific anchor. Under its baseline scenario, US headline Personal Consumption Expenditures (PCE) inflation, the Federal Reserve’s preferred measure, is approximately 0.6 percentage points higher on a Q4/Q4 2026 basis than it would be without the war. Core PCE is approximately 0.2 percentage points higher.
Central bank scenario modelling produces a wider range. Depending on how long Hormuz disruptions persist and how severely refining capacity remains impaired, US headline PCE could be between 0.35 and 1.47 percentage points higher in 2026 Q4/Q4 than in a no-war baseline.
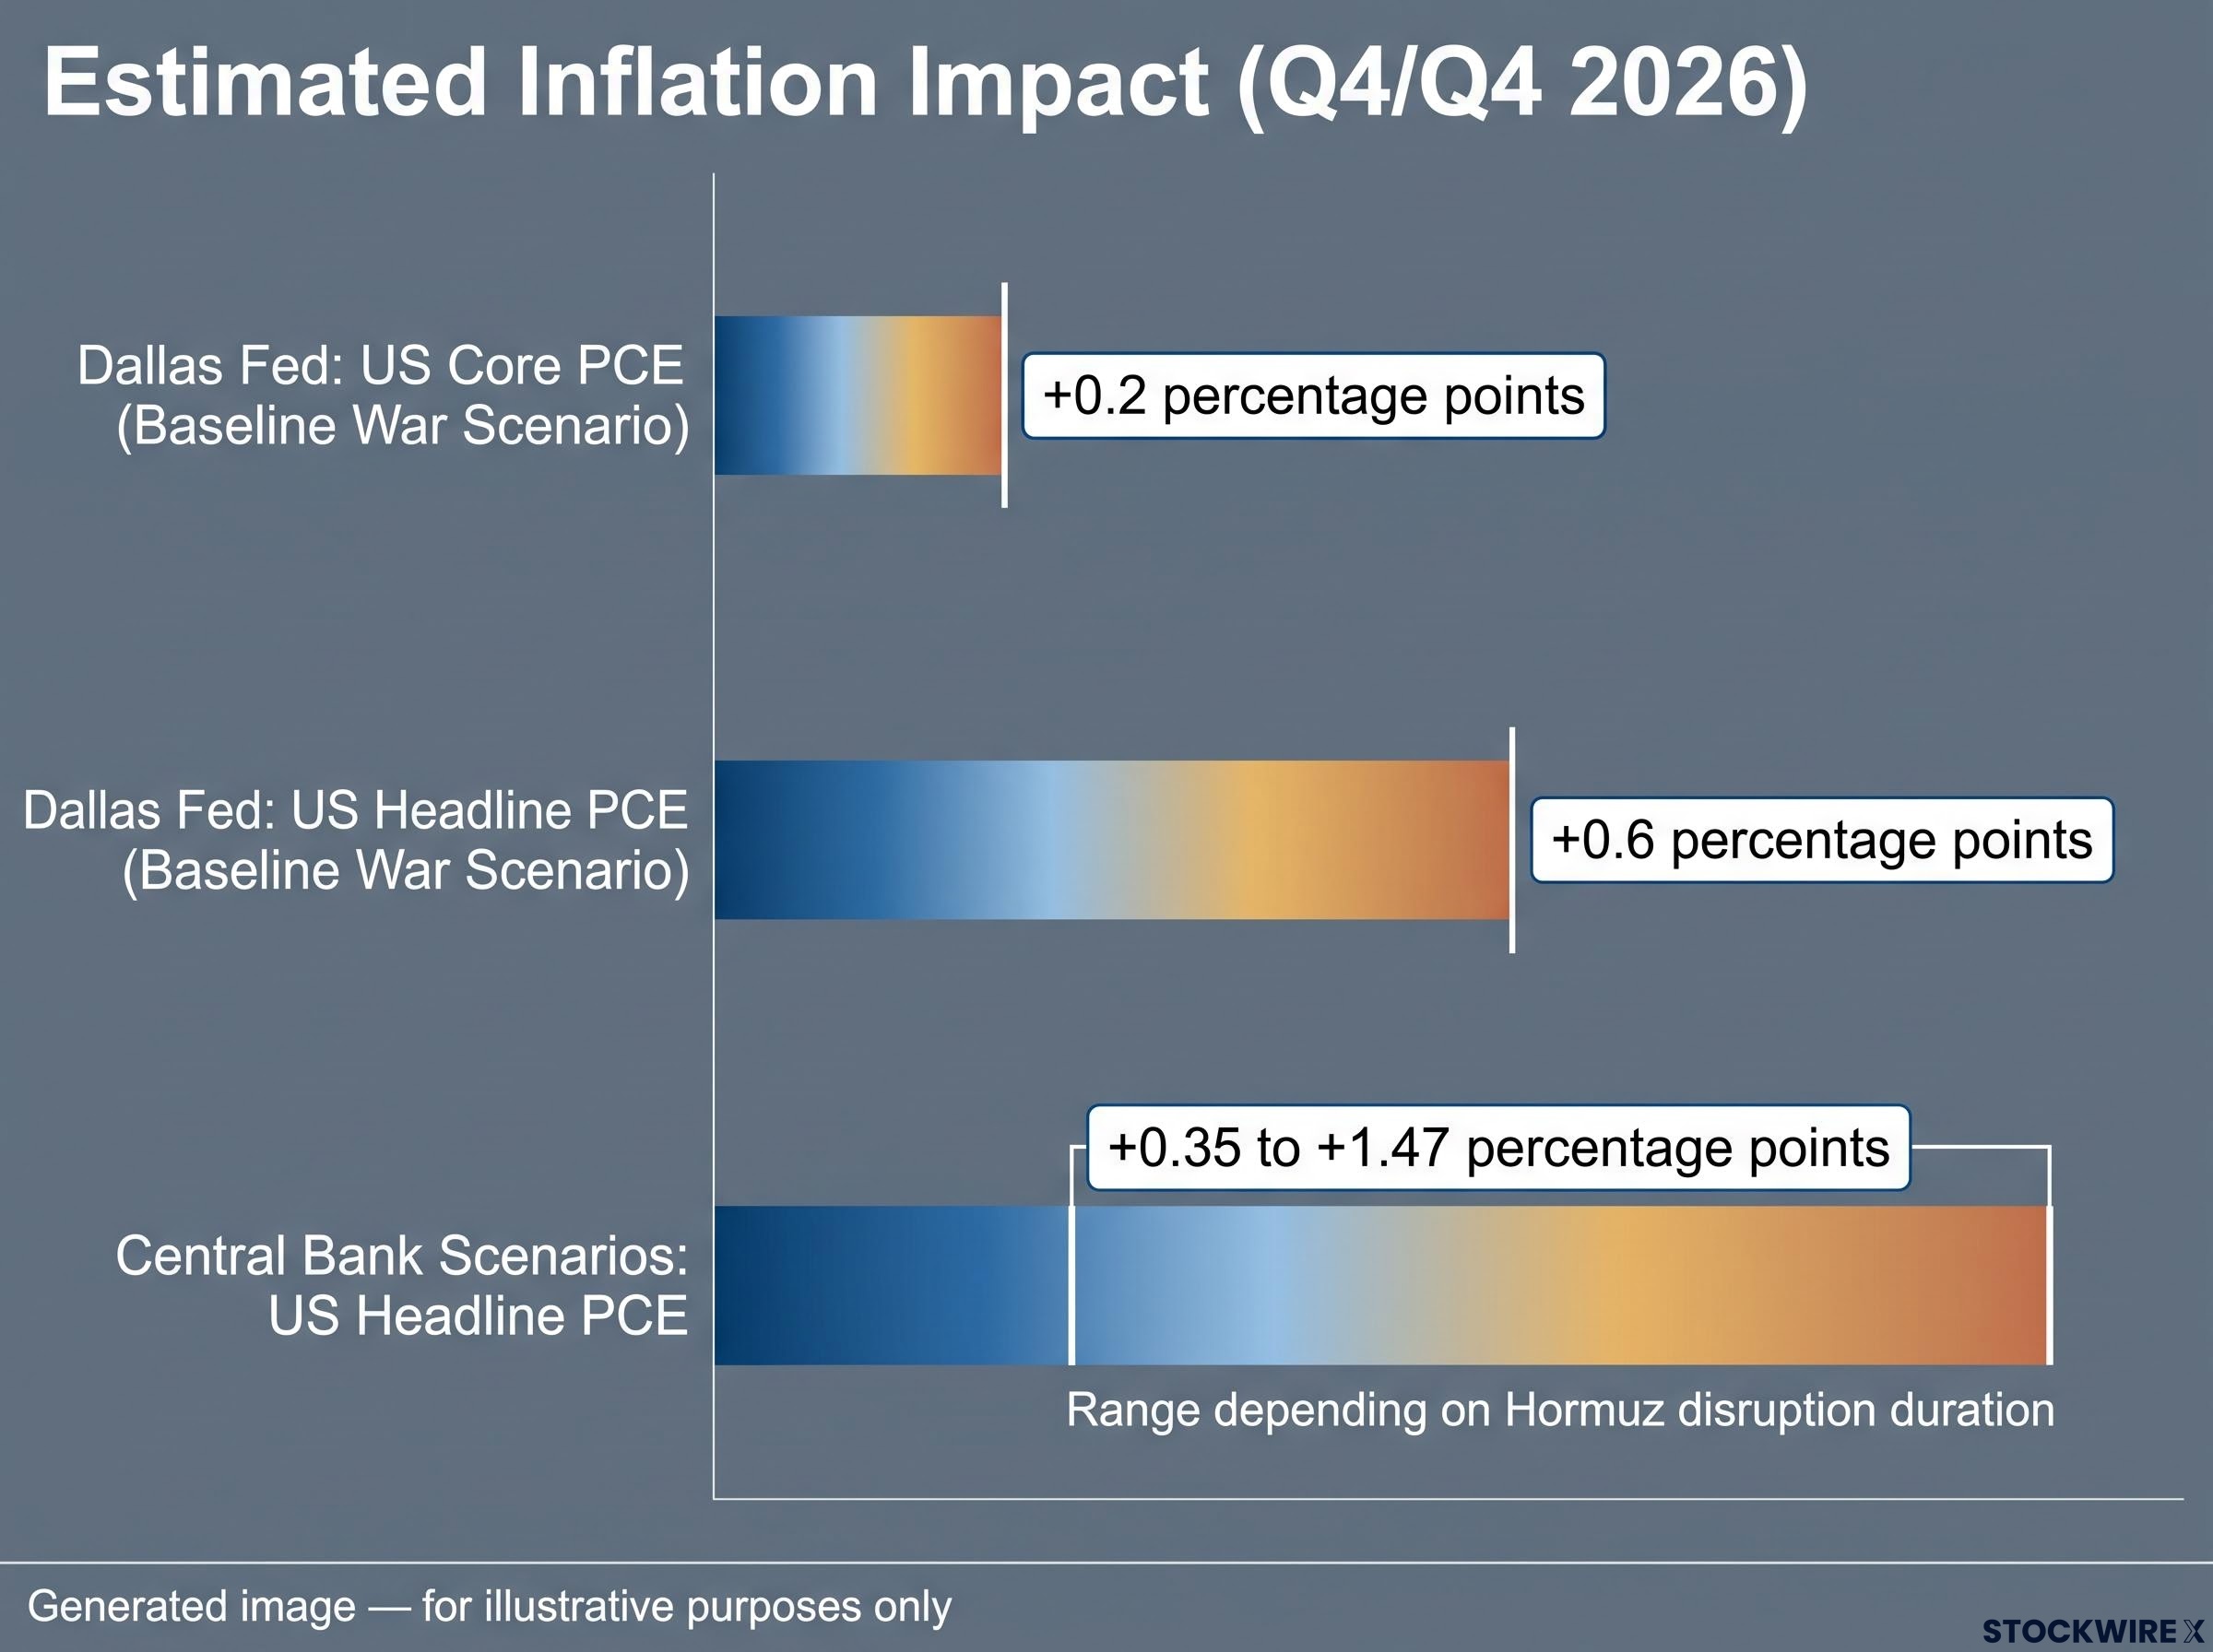
The width of that range, from 0.35 to 1.47 percentage points, tells you that the duration of the Hormuz disruption is the single most important variable in determining whether inflation returns to target in 2026 or stays elevated well into 2027.
US CPI was running at approximately 3.3-3.4% year-on-year by March 2026, according to San Francisco Fed data, materially above the 2% target. The ECB assesses that the war is the main driver of above-target euro area inflation, with indirect effects confirmed in the data.
| Institution | Metric affected | Estimated impact | Scenario condition |
|---|---|---|---|
| Dallas Fed | US headline PCE | +0.6 pp Q4/Q4 2026 | Baseline war scenario |
| Dallas Fed | US core PCE | +0.2 pp Q4/Q4 2026 | Baseline war scenario |
| Central bank scenarios | US headline PCE | +0.35 to +1.47 pp | Range depending on Hormuz disruption duration |
| ECB | Euro area inflation | Main driver of above-target inflation | Qualitative; structural supply shock |
For investors setting duration risk or equity sector positioning, these estimates clarify that war-driven inflation is material, quantified, and in the data. The spread of outcomes is wide enough to demand scenario planning, not a single base case.
Manufacturing costs and the hidden oil toll in traded goods prices
There is a cost channel that standard energy analysis misses entirely. Goods produced overseas and transported to a domestic market bring with them the oil costs accumulated throughout foreign manufacturing and transit. Those costs never appear as “energy” in the importing country’s CPI breakdown, but they are embedded in the final price paid by consumers.
Consider an imported refrigerator or electronic device. Its price already incorporates the fuel used in overseas factories, the diesel powering foreign logistics networks, and the bunker fuel that moved the container ship. When global refined product prices rise, those embedded costs increase. The consumer pays more. The CPI categorises it as a goods price increase, not an energy price increase.
Refinery throughput collapse has compounded the supply disruption in ways crude benchmarks alone do not capture: IEA July 2026 data recorded global refinery throughput at 80.9 million barrels per day — nearly five million barrels per day below the prior year — directly explaining why diesel has repriced far more severely than crude futures.
| Energy cost channel | What standard analysis captures | What standard analysis misses |
|---|---|---|
| Direct fuel imports | Volume and price of crude and refined imports | Refining margin premium from damaged Gulf capacity |
| Domestic energy use | Household fuel and electricity consumption | Energy costs embedded in domestic manufacturing inputs |
| Embedded energy in traded goods | Not typically measured | Foreign production energy costs absorbed via import prices |
Why the China-US energy cost gap matters
A striking asymmetry has emerged. Since February 2026, vehicle energy costs in China have increased by just 5%, a sharp contrast to the roughly 50% rise recorded for US diesel over the same period. As UBS economist Paul Donovan has noted, the energy costs built into Chinese goods exported to the US are therefore running well below those incurred in domestic US production, given the divergence in underlying fuel price movements between the two economies.
That does not mean Chinese imports are cheap overall; tariffs, shipping costs, and broader supply chain dynamics all apply. But on the energy cost dimension specifically, the divergence is significant and creates a structural cost disadvantage for certain US-made goods. This distributional effect within the inflationary shock is one that standard trade-balance analysis does not capture. For globally diversified investors tracking manufacturing margins, the asymmetry carries direct implications for relative competitiveness and pricing power across supply chains.
How to read inflation data when energy is distorting every layer
The diagnosis so far points to a practical problem: the standard inflation indicators are systematically incomplete during a large, persistent energy shock. Headline CPI captures the direct fuel hit but only part of the indirect pass-through. Core inflation is contaminated by energy-driven cost pressure routed through transport and goods. And embedded energy in imports appears nowhere on an energy balance sheet.
The crude-versus-diesel divergence sharpens the point further. Since February 2026, crude oil futures have gained 26% while US diesel prices have climbed around 50%, and focusing exclusively on crude benchmarks when forming inflation expectations means missing the additional premium that damaged Gulf refining infrastructure has added to refined product markets.
Crude oil rose from approximately $70 per barrel pre-conflict to approximately $103 per barrel by March 2026, according to research data. But refined product markets, where refining infrastructure damage has concentrated the price impact, are the more informative series for tracking how energy costs actually reach households and firms.
Here are four specific variables that capture what headline CPI does not:
- Refined product prices (diesel, jet fuel): These reflect the refining capacity constraint that crude benchmarks do not. They are the prices that directly determine transport and logistics costs.
- Transport and logistics cost indices: These track the cost of moving goods, the channel through which energy costs travel into core CPI components like goods prices and delivery charges.
- Airfare CPI sub-components: Airfares sit in core inflation but carry embedded jet fuel costs. Watching this line item tells you how much “core” is actually energy in disguise.
- Hormuz disruption status and duration: The single variable that determines whether the 0.35 or the 1.47 percentage point end of the central bank scenario range is closer to the outcome.
Readers who continue to anchor inflation expectations to crude oil prices and headline CPI figures alone are working with a distorted map. The correction is to monitor refined product prices and logistics costs as the more informative leading series.
What the hidden inflation toll means for households, firms, and portfolios
The same underlying energy mechanism produces different practical consequences depending on where you sit in the economy.
Households:
- The war’s inflation impact falls hardest on lower-income households. Fuel and energy-intensive essentials, food, transport, and delivered goods, consume a larger share of lower-income budgets.
- The delivered inflation rate for these households materially exceeds the headline CPI figure, because the indirect channels identified throughout this analysis are concentrated in the categories that dominate their spending.
Firms:
- Transport, logistics, manufacturing, and agriculture face direct diesel and refined product cost pressures.
- Where competition limits the ability to pass costs through to customers, the result is margin compression that affects earnings guidance and investment capacity.
Investors:
- Tracking crude oil benchmarks without reference to refined product markets overlooks the premium that impaired Gulf refining capacity has generated in diesel and related products. Diesel up approximately 50% versus crude up 26% is the clearest expression of this gap.
- That refinery-specific scarcity can keep transport costs and refining margins elevated even if crude stabilises, affecting sector positioning in energy, logistics, and consumer staples.
- The Dallas Fed’s baseline scenario, with headline PCE up approximately 0.6 percentage points and core up approximately 0.2 percentage points, anchors how much of this is already in institutional forecasts.
As the ECB has framed it, war-related energy is a persistent structural supply shock, not a temporary blip. As long as Hormuz disruptions persist, realistic inflation assessment requires tracing energy’s indirect and global pathways rather than reading the headline number. The household that earns less, the logistics firm unable to pass through full fuel cost increases, and the investor holding crude benchmarks while diesel diverges are all being underserved by the headline inflation figures they are relying on.
Reading the war’s price toll clearly before the disruption ends
War-driven energy costs are filtering through CPI via multiple channels simultaneously. Only one of them, the direct energy line, is visible in the headline figure. The indirect pass-through into core inflation, the embedded energy in traded goods, and the refined product premium from damaged Gulf infrastructure are all confirmed by institutional research and all absent from the number most people cite.
The forward view hinges on a single variable: the duration and severity of Hormuz disruptions. Central bank scenario modelling puts the range for US headline PCE impact at +0.35 to +1.47 percentage points versus a no-war baseline. The IEA reports ongoing intermittent disruptions to 20-25% of world seaborne oil flows as of August 2026, nearly six months into the conflict that began on 28 February 2026.
The central bank scenario range of +0.35 to +1.47 percentage points for US headline PCE is the clearest institutional measure of how much uncertainty remains about inflation’s trajectory while the conflict continues.
Until refining infrastructure is restored and Hormuz flows normalise, refined product prices, logistics costs, and core CPI components tied to transport will remain the informative series. The IMF, ECB, Dallas Fed, and UBS all now treat war-related energy as a structural supply shock, not a transient spike. The analytical framework here does not expire when crude prices stabilise. It remains relevant as long as Gulf refining capacity and Hormuz transit flows are impaired, because the hidden inflation channels it identifies are structural, not temporary.
For investors exploring whether a diplomatic resolution would reset the energy cost environment, our full explainer on structural oil price floors post-ceasefire examines why war-risk insurance premiums, mine-clearing lags, and strategic reserve replenishment demand keep WTI and Brent more than $10 above pre-conflict levels even after a ceasefire is signed.
This article is for informational purposes only and should not be considered financial advice. Investors should conduct their own research and consult with financial professionals before making investment decisions. Financial projections and institutional estimates referenced are subject to market conditions and various risk factors, and past performance does not guarantee future results.