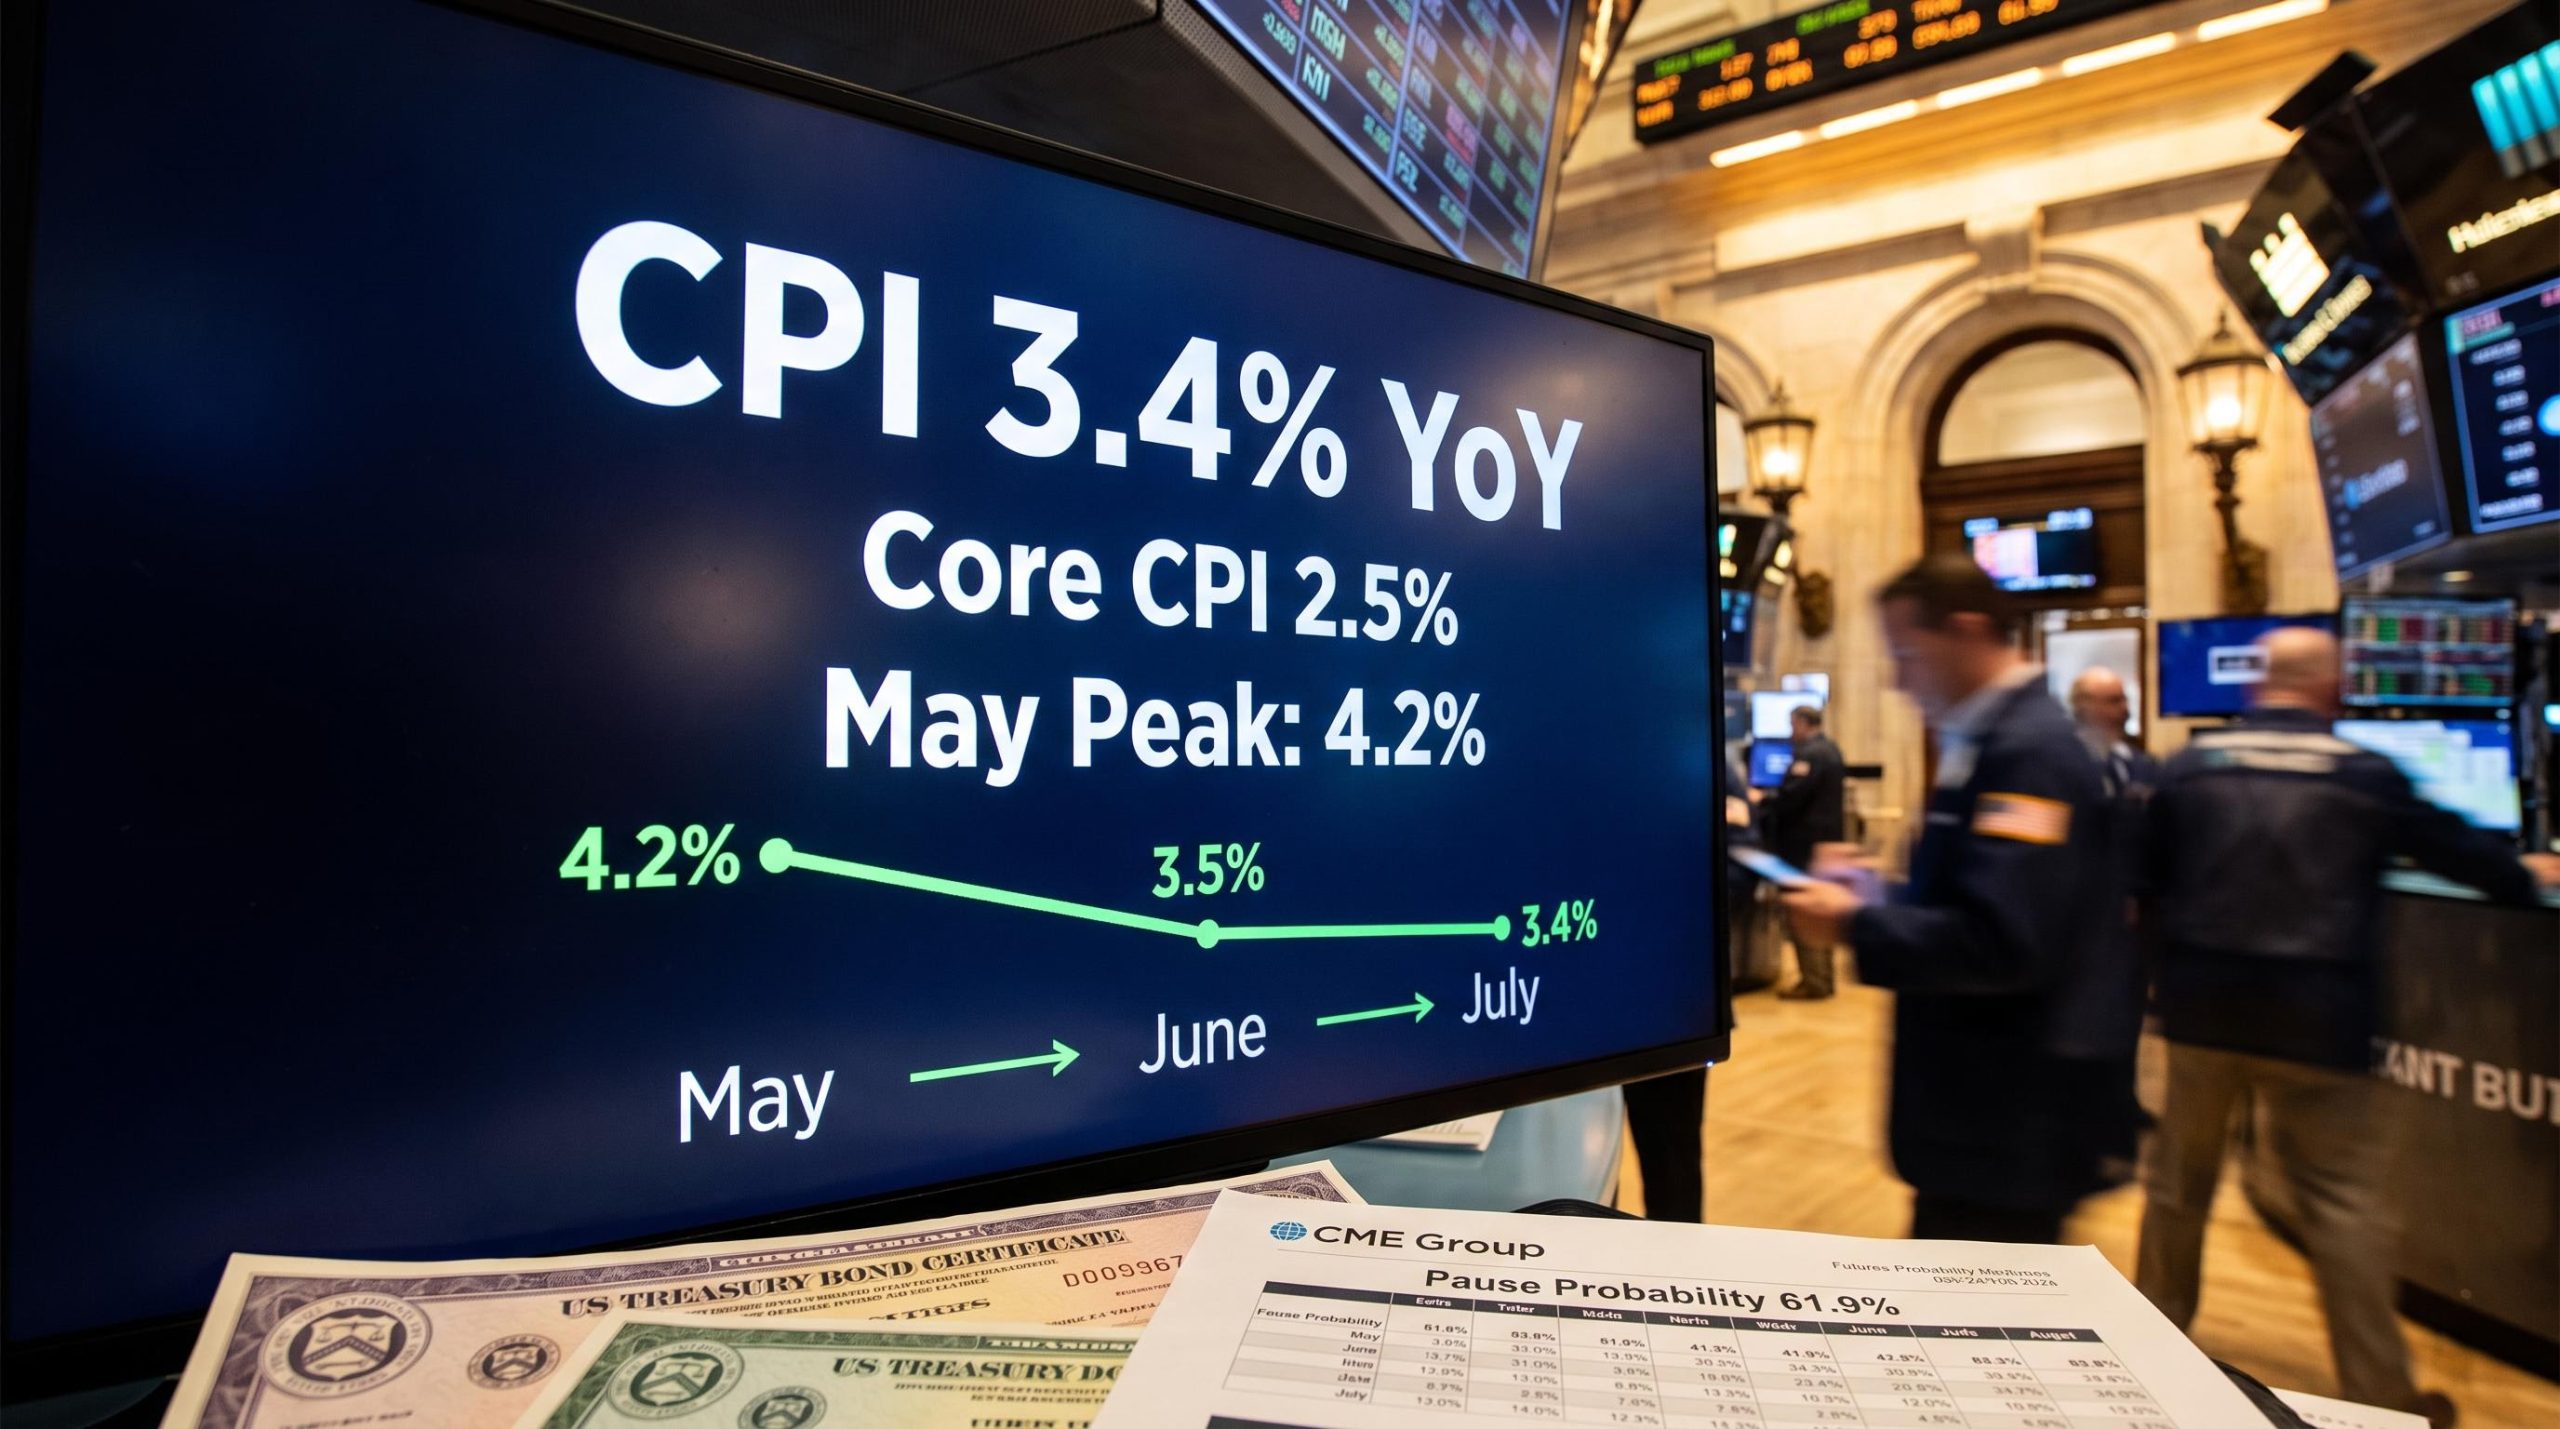
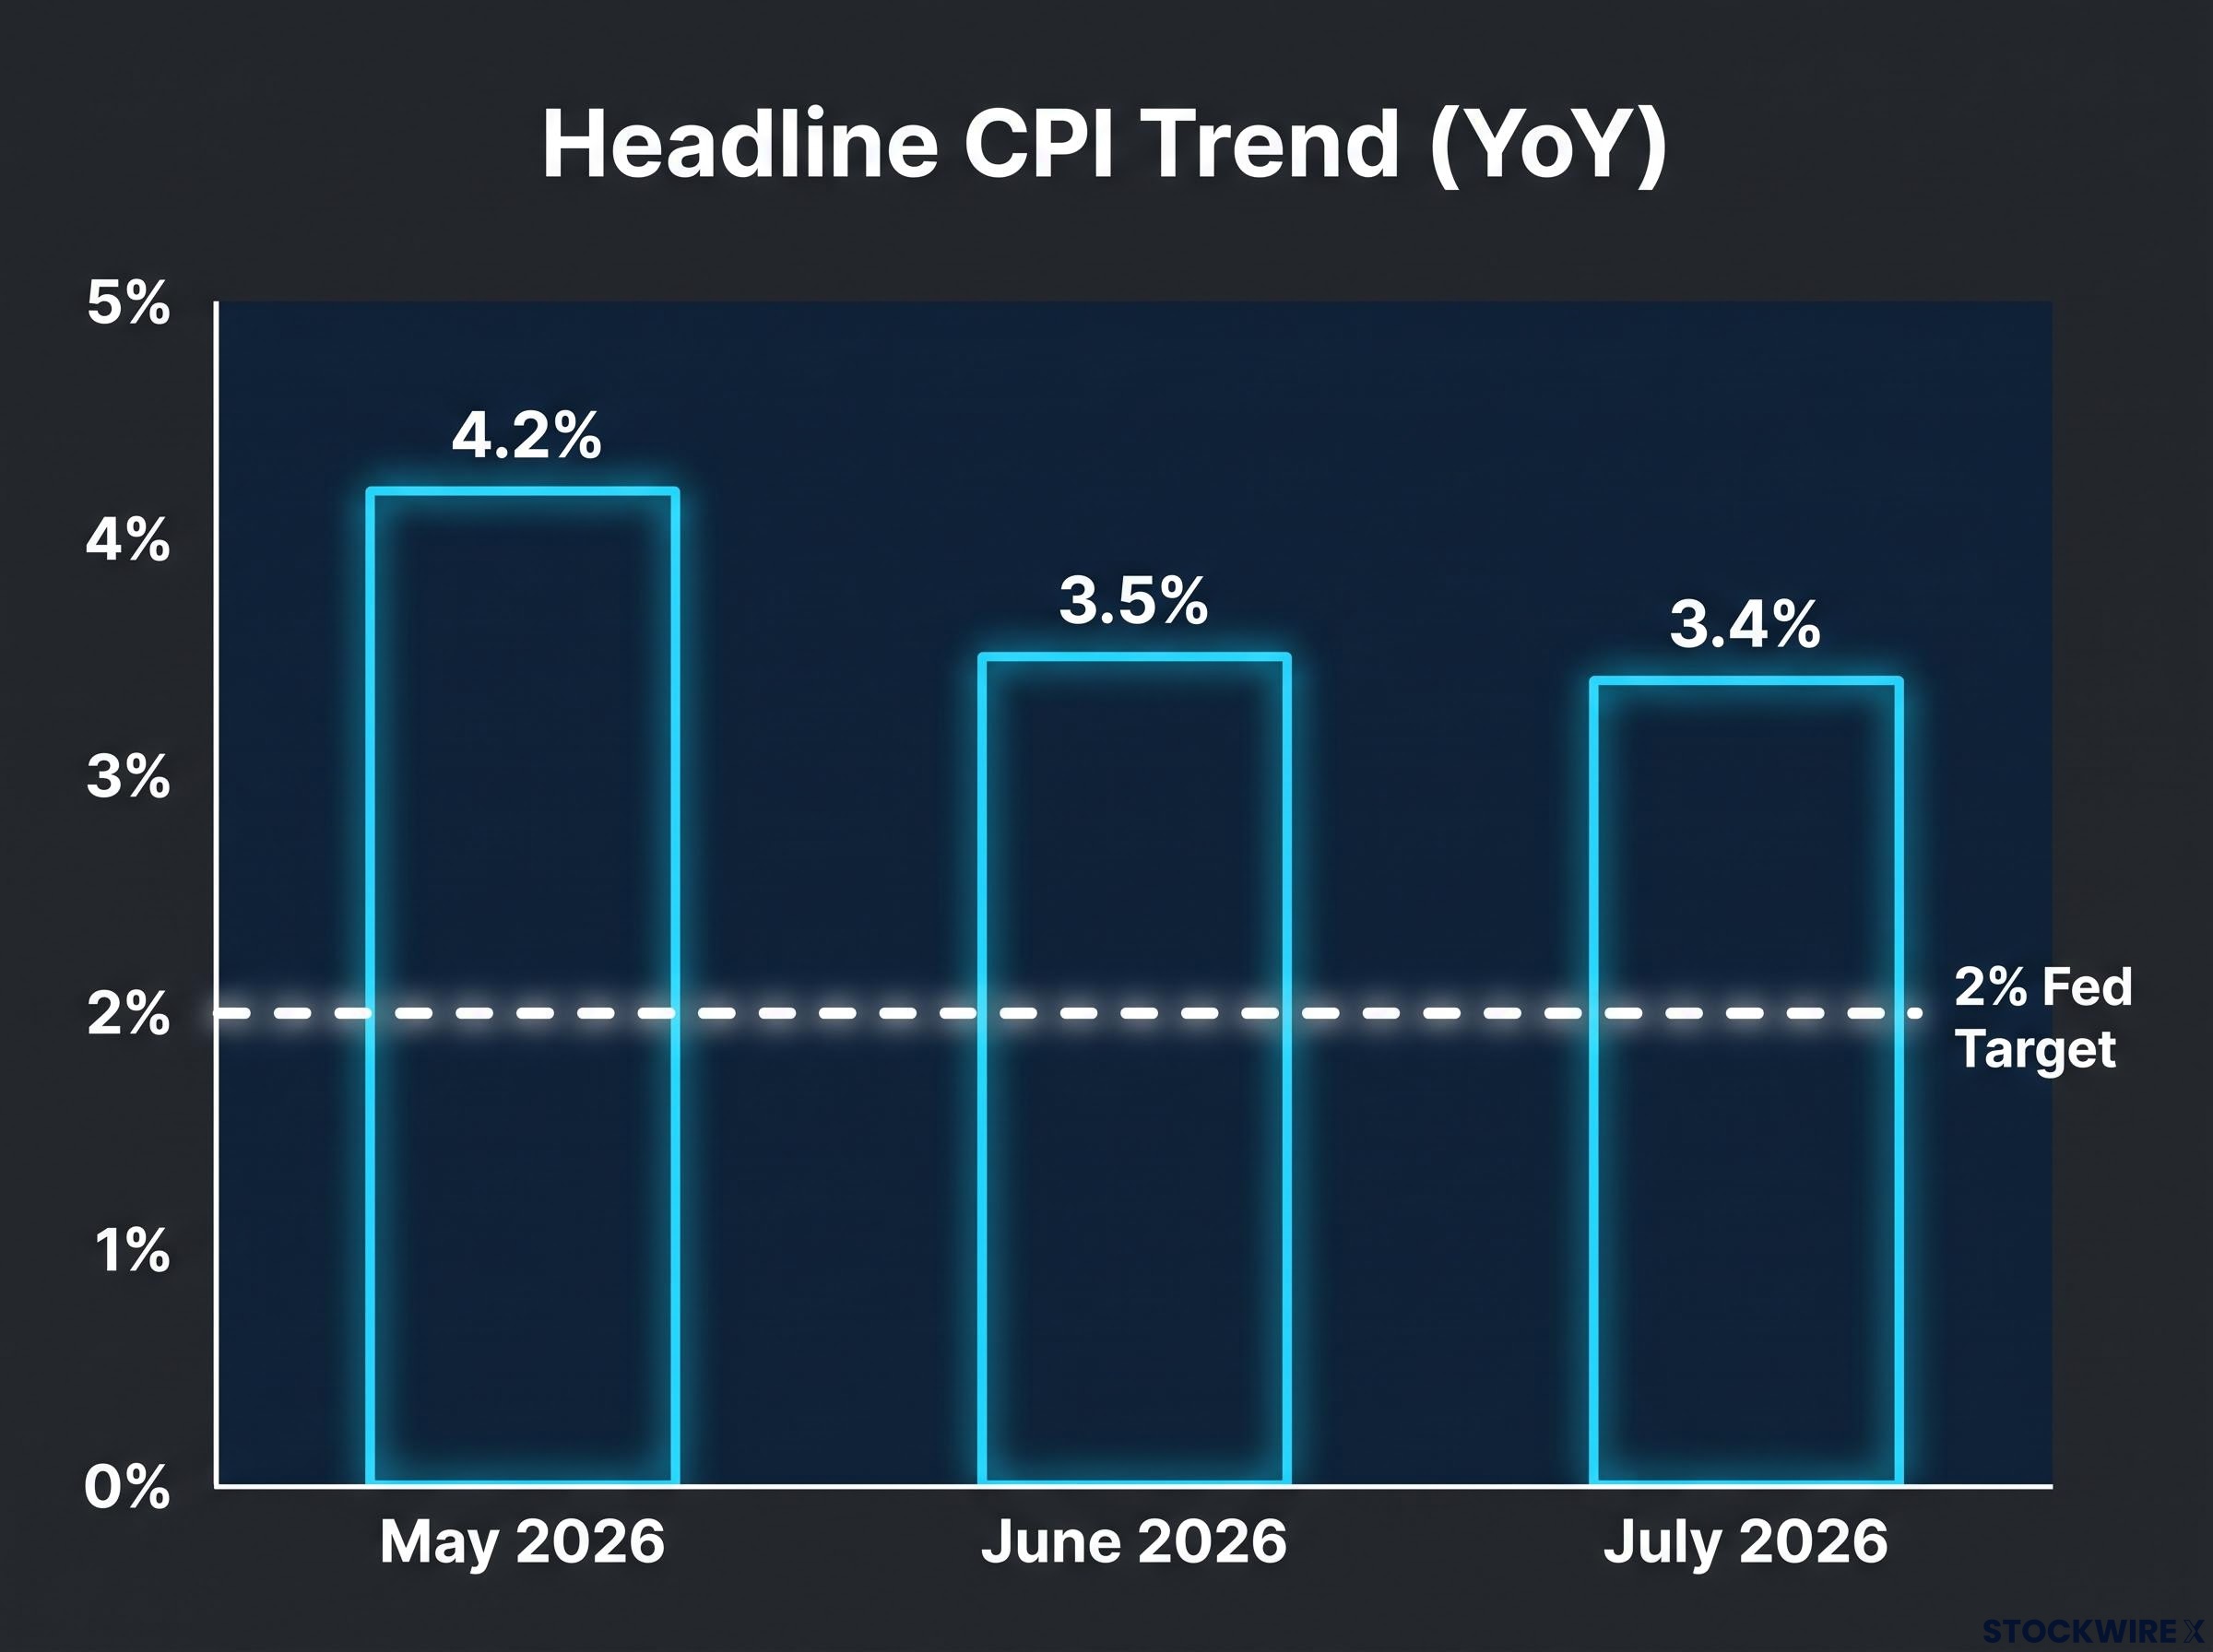
Financial media spent the past six weeks warning that inflation was about to reignite. The July 2026 Consumer Price Index (CPI) report, released today by the Bureau of Labor Statistics (BLS), told the opposite story. Headline inflation fell to 3.4% year-over-year, down from 3.5% in June, extending a two-month decline from the 4.2% peak recorded in May.
The timing matters more than a routine monthly data release would suggest. Chair Kevin Warsh‘s late July decision to leave rates unchanged at 3.5%-3.75% produced three dissenting regional Fed presidents, a sharp jump in futures-market expectations of a hike, and widespread media coverage framing the move as a policy misstep. This number lands squarely in the middle of that open argument.
Here is what the data actually show, what they change about the Fed narrative, and which variables will determine whether the disinflation trend survives into the September meeting.
Inflation keeps falling: what July’s CPI numbers actually show
The all-items CPI rose just 0.1% month-over-month in July, bringing the annual rate to 3.4%. That marks the second consecutive monthly decline from the 4.2% May peak, a trajectory that increasingly looks like a trend rather than a one-month anomaly.
Core CPI, which strips out volatile food and energy prices, came in at 0.2% month-over-month and 2.5% year-over-year, down from 2.6% in June. The granular breakdown from the Joint Economic Committee (JEC) confirms the picture: headline CPI-U at +0.07% monthly and +3.36% annually, rounding to the 3.4% figure.
The result matched the consensus forecast. MUFG had projected 3.4% year-over-year headline, meaning markets were broadly prepared for this outcome rather than caught off-guard.
The July print did not arrive in isolation: the June CPI surprise, which saw core CPI flatline at 0.0% month-over-month in the largest downside miss in over a year, was the first data point that began shifting market expectations away from the hike scenario.
- Headline CPI: +0.1% MoM, +3.4% YoY
- Core CPI: +0.2% MoM, +2.5% YoY (down from 2.6% in June)
- May 2026 peak: 4.2% YoY
- JEC granular: +0.07% MoM, +3.36% YoY
The trajectory in three months: 4.2% (May) → 3.5% (June) → 3.4% (July). The inflation spike earlier in 2026 is now clearly in retreat, not stalling.
If you positioned for a re-acceleration, the data have now contradicted that thesis twice running.
When big ASX news breaks, our subscribers know first
What drove the slowdown: energy pulls back, shelter holds firm
Energy was the primary engine of the monthly deceleration, falling 1.5% month-over-month in July (JEC granular: -1.48%). That single component bought the headline number meaningful breathing room.
Shelter immediately tells the counterpoint. It rose 0.1% month-over-month and, according to the BLS release, accounted for roughly two-thirds of whatever monthly gains remained. Food was quiet at +0.1% (JEC: +0.08%). Core goods prices held largely stable throughout 2026, and market-based inflation expectations derived from TIPS spreads (the yield difference between conventional Treasuries and their inflation-protected equivalents) stayed subdued across the period.
The energy relief is real but conditional. Despite the monthly decline, energy prices remain elevated on a year-over-year basis, with gasoline still significantly higher than a year ago. Any geopolitical supply shock could reverse the recent pullback quickly.
| Component | MoM Change | Direction |
|---|---|---|
| Energy | -1.5% | Relief |
| Shelter | +0.1% | Persistent |
| Food | +0.1% | Stable |
| Core Goods | ~Flat | Stable |
The energy pullback bought time. Shelter’s stickiness tells you the path to 2% remains slow and uneven rather than a straight line down.
FRED Blog analysis of shelter inflation stickiness explains that rental prices only adjust when leases renew or tenants move, causing CPI shelter data to lag current housing market conditions by months and making shelter the component most resistant to the Fed’s rate tightening cycle.
How the Fed’s data-dependent hold looks now
When Kevin Warsh held rates at 3.5%-3.75% at the late July meeting, the decision drew immediate fire. Three regional Federal Reserve bank presidents dissented in favour of hiking, a concrete signal of internal tension that the financial press treated as evidence the chair was misjudging the inflation environment.
FOMC dissent signals carry information that the headline rate decision obscures: a nine-to-three hawkish split, as recorded at the July meeting, historically pushes short and intermediate Treasury yields higher as markets reprice the probability of a near-term hike, regardless of whether the hold itself was the correct call.
Three regional Fed presidents voted to raise rates at the July meeting. All three were overruled.
Longer-dated Treasury yields climbed in the sessions that followed, a move widely interpreted as investors signalling doubts about the Fed’s commitment to containing inflation. The yield curve stayed in positive territory, leaving scope for further tightening without immediately choking off credit, yet commentators were largely unified in their conclusion that Warsh had erred.
The July CPI data quietly rewrite that narrative. Inflation did not re-accelerate. It cooled for a second consecutive month. The hold now looks consistent with incoming data rather than a policy error. The chair faced sustained pressure to spell out exactly what it would take for him to back a rate rise; the July print reduces the urgency of that question, even if it does not put it to rest entirely.
The lesson for readers is direct: the “behind the curve” framing was built on a forecast that the data have since contradicted. Narrative shifts like this one have real consequences for how rate expectations are priced across every asset class.
What this means for September and the “higher for longer” debate
The futures market moved quickly. According to CME FedWatch data, the probability of a continued pause at the September meeting rose to approximately 61.9%, up from 51.6% the day before. Fox Business framed the report as having “shifted the outlook” toward a continued pause. Kiplinger explicitly noted the July CPI report “lowers September rate-hike odds.”
“Higher for longer” is still the operative scenario. CPI at 3.4% and core at 2.5% remain above the Fed’s 2% target, so the data justify patience, not a policy pivot. But “much higher very soon” is now a harder case to sustain.
Fiscal dominance constraints add a structural dimension to the ‘higher for longer’ debate that pure inflation data cannot capture: with federal debt near 122% of GDP, each percentage point of additional tightening imposes interest costs on the government roughly four times faster than Volcker’s 1981 campaign did, narrowing the ceiling on how aggressive any rate path can realistically become.
Three scenarios for September, based on current data:
- Hold extends (most probable): The Fed keeps rates at 3.5%-3.75%, citing continued disinflation and data-dependence. Markets are now pricing this as the most likely outcome.
- Data-dependent hike: An upside surprise in PCE or August CPI reignites the case for tightening. Possible, but requires a clear reversal in the trend.
- Surprise cut: Essentially off the table at current inflation levels. Would require a significant deterioration in employment data or financial stability concerns.
The futures repricing tells you that professional traders have updated their bets. Markets are now pricing in a greater chance of stability rather than additional tightening, which has direct implications for bond duration positioning and equity multiples over the next 30-60 days.
Understanding the CPI: what it measures and why it moves markets
The Consumer Price Index is the BLS’s monthly measure of price changes across a basket of goods and services representative of typical US consumer spending. It tracks what everyday items cost, from groceries to petrol to rent, and how those costs change over time.
The distinction between headline and core matters. Headline CPI includes everything. Core CPI excludes food and energy. The Fed watches core more closely because it strips away the noise.
Why core matters more than headline
Energy and food prices are driven largely by global supply chains and geopolitical conditions outside the Fed’s control, making them poor signals of the underlying domestic pricing trend the Fed is trying to influence. This is why July’s energy-driven monthly relief, while welcome, does not change the core trajectory the Fed is focused on. Core CPI at 2.5% tells you more about durable inflation pressure than the headline figure.
One additional wrinkle: the Fed formally targets the Personal Consumption Expenditures (PCE) price index, not CPI. But CPI is released earlier each month and is more widely quoted, making it the first read on each month’s price environment. Markets react most immediately to CPI even before the Fed has commented, which is why round numbers in the CPI report can move Treasury yields and equity futures within minutes of release.
Monetary policy transmission lags mean the rate decisions made in late 2025 and early 2026 are still working their way through mortgage markets, business lending, and consumer credit, which is one reason why the disinflation trend now visible in CPI data does not translate directly into a near-term policy pivot.
- CPI: Published by the BLS; released mid-month; July 2026 reading: 3.4% YoY
- PCE: Published by the Bureau of Economic Analysis; released later in the month; formal Fed target measure
- Fed target: 2% inflation (measured by PCE)
- TIPS spreads: The market’s own inflation expectation mechanism, derived from the gap between standard and inflation-protected Treasury yields
Understanding this relationship means you can interpret future monthly releases without being misled by headline-level framing.
What the data changes, and what remains unresolved
The July report settles the immediate narrative debate. The forecast of an imminent inflation resurgence has been contradicted by two consecutive months of cooling. The Fed’s July hold looks data-consistent. September hike odds have fallen.
May to July: 4.2% → 3.5% → 3.4%. The direction is clear. But 3.4% is still well above the Fed’s 2% target.
Three persistent upside risks will determine whether the disinflation trend continues:
- Shelter: Still the largest contributor to July’s monthly gain. Historically the stickiest CPI component, and the one least responsive to monetary policy in the short term.
- Energy: The -1.5% monthly decline was welcome, but year-over-year energy prices remain elevated. Any supply disruption or geopolitical escalation could reverse the recent relief quickly.
- Services: According to Reuters analysis, services prices remain a persistent watch area. They are linked to wage dynamics and adjust more slowly than goods, making them a lagging but powerful driver of underlying inflation.
The next data points to watch are the PCE release later this month, the August CPI print, and wage data. Together, these will determine whether the Fed’s patience is ultimately rewarded or tested at the September meeting.
This article is for informational purposes only and should not be considered financial advice. Investors should conduct their own research and consult with financial professionals before making investment decisions. Forward-looking statements regarding Federal Reserve policy and inflation trends are speculative and subject to change based on incoming economic data and market developments.