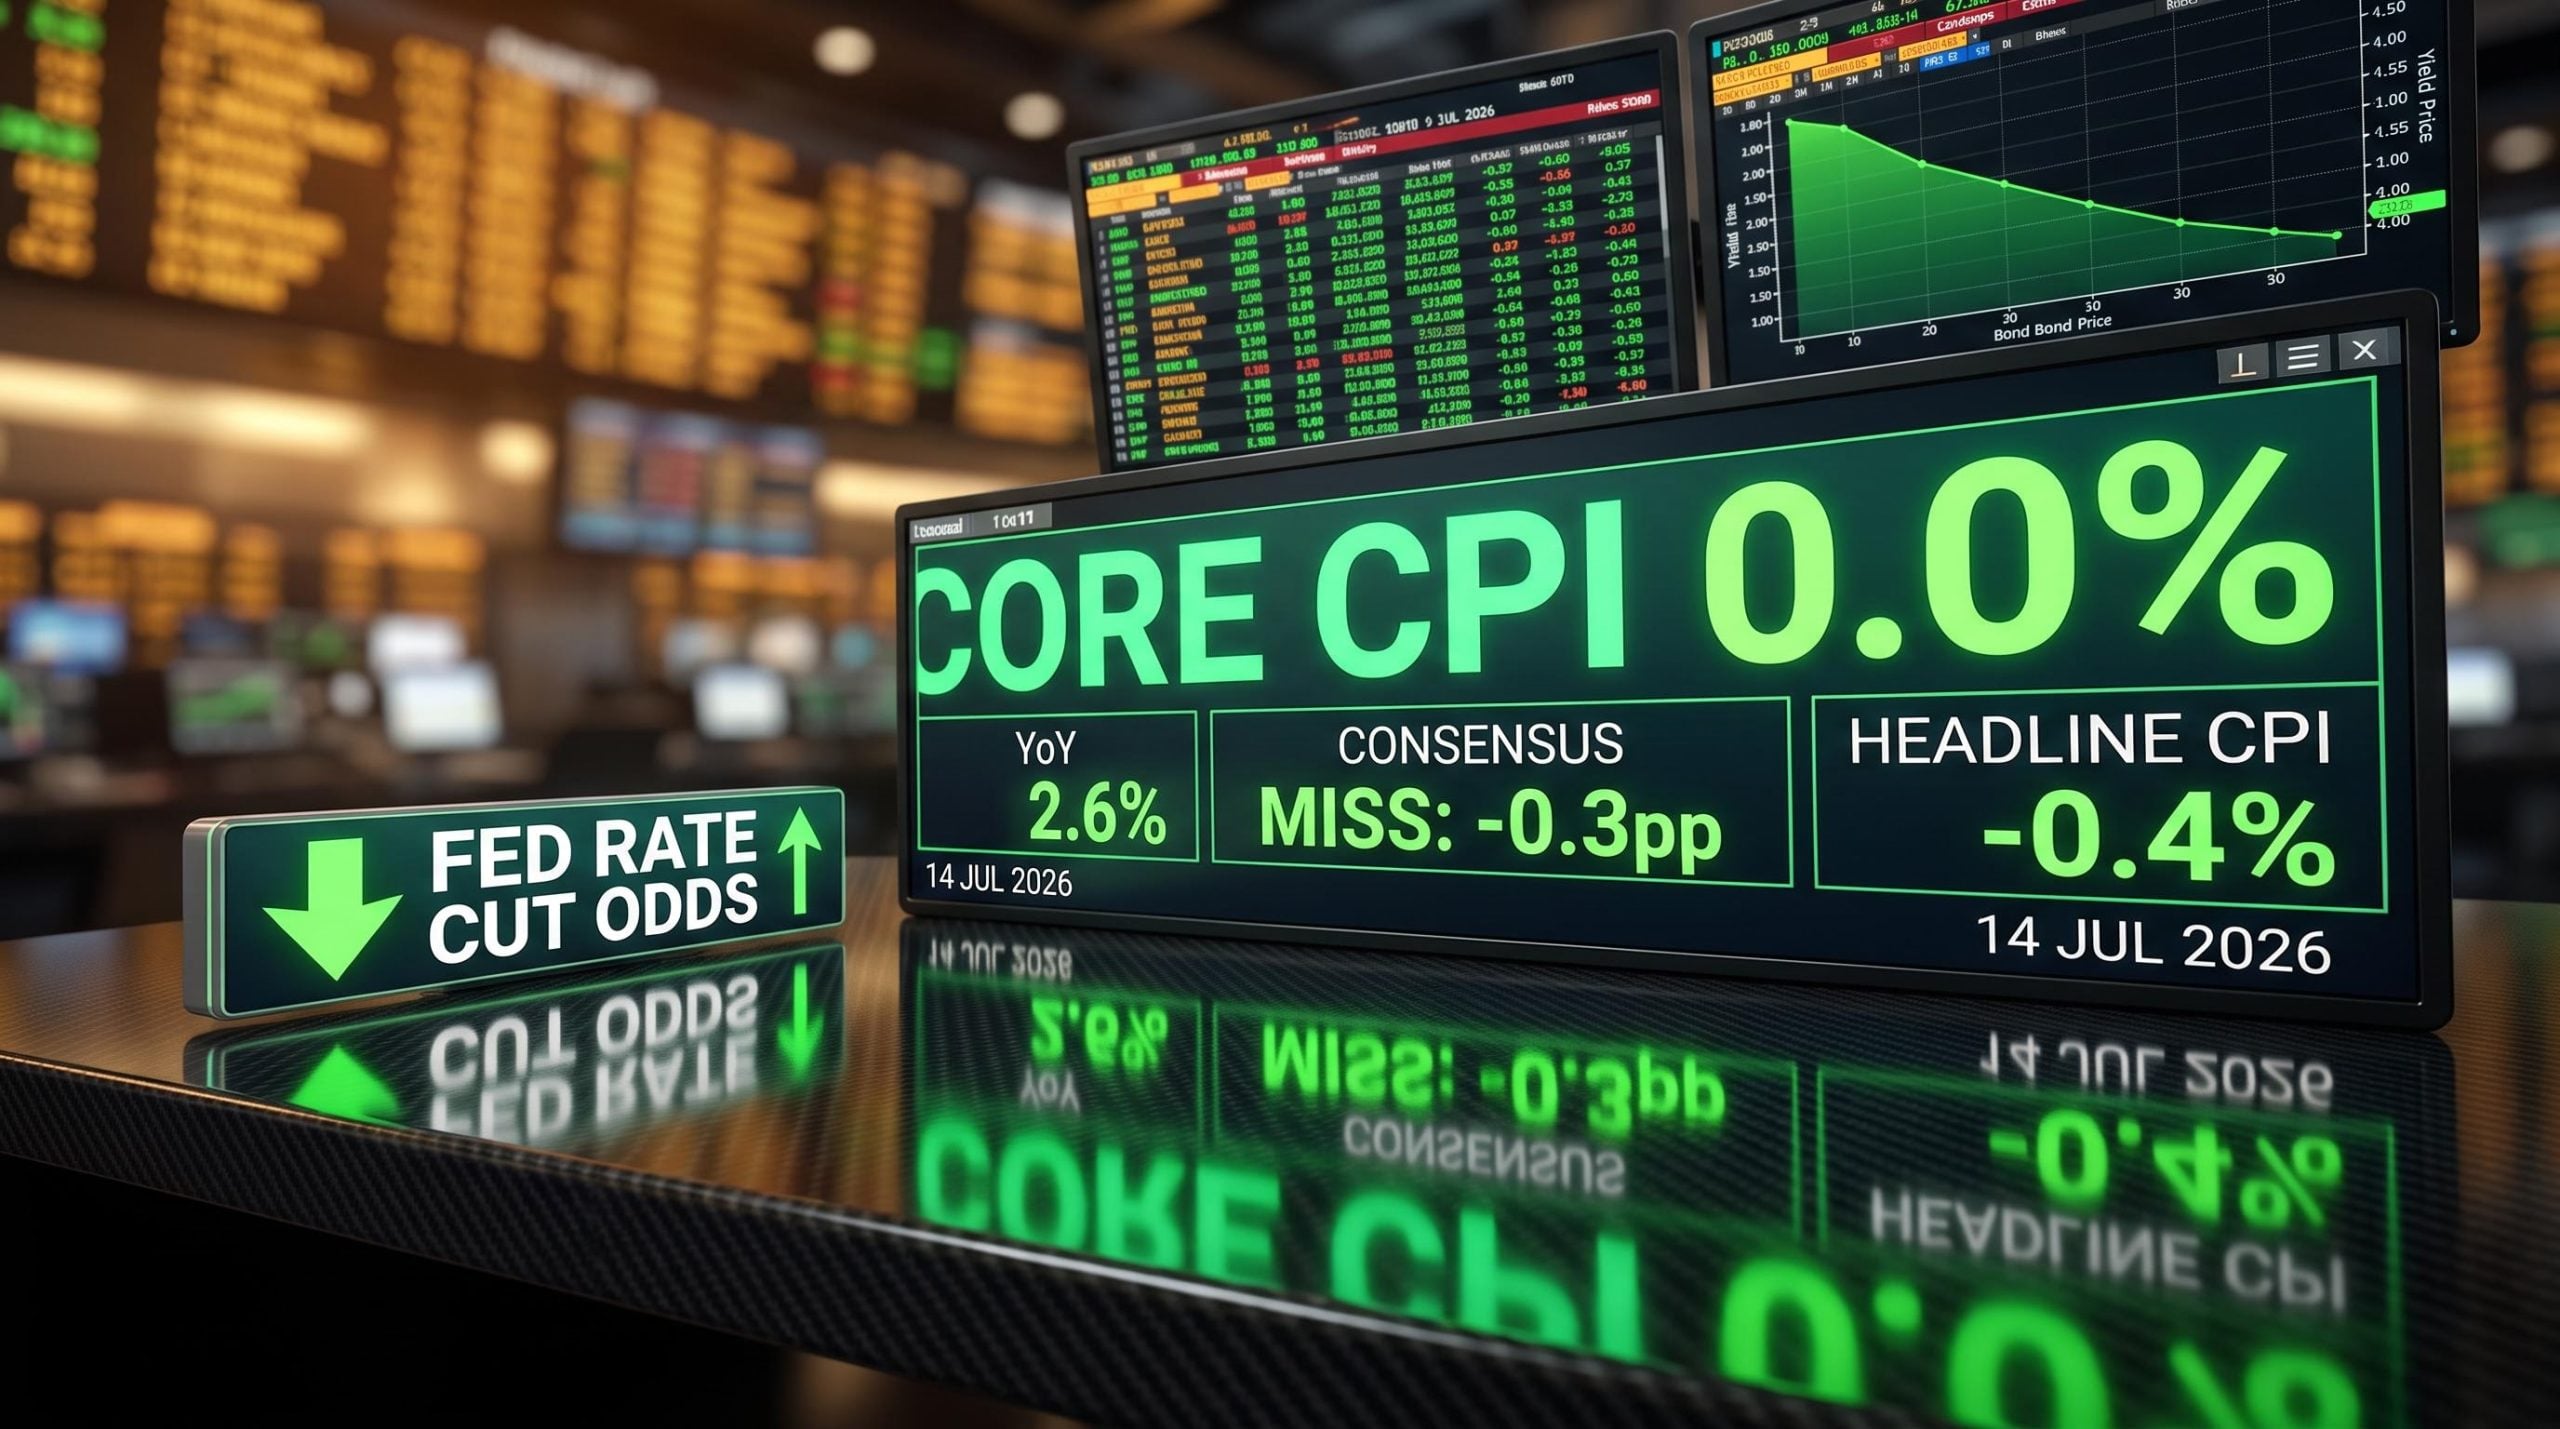
Core inflation did not rise in June. It did not inch forward. It flatlined at 0.0% month-over-month, missing the consensus forecast of +0.3% by the widest margin in over a year, and pulling the annual core rate down to 2.6%, a full 0.3 percentage points below what economists had projected.
The Bureau of Labor Statistics (BLS) published the data this morning, 14 July 2026, into a market that had been bracing for a modest improvement in headline inflation but had not priced in a core reading this weak. The Federal Reserve has repeatedly signalled that core inflation, not the headline number, is the metric it watches most closely when weighing interest rate decisions. At 2.6% annually, core CPI now sits closer to the Fed’s 2% target than most observers expected to see before the end of the year.
Here is what the June numbers actually show, why headline and core CPI are telling different stories this month, and what today’s data changes for Fed policy, borrowing costs, and rate-sensitive investments.
Core inflation just flatlined, and that is the number that matters most
Zero. That is the monthly change in core CPI for June 2026. The reading came in entirely unchanged after a +0.2% rise in May, falling well short of the +0.3% gain the consensus had anticipated. Rather than easing gradually, the monthly print stopped moving altogether.
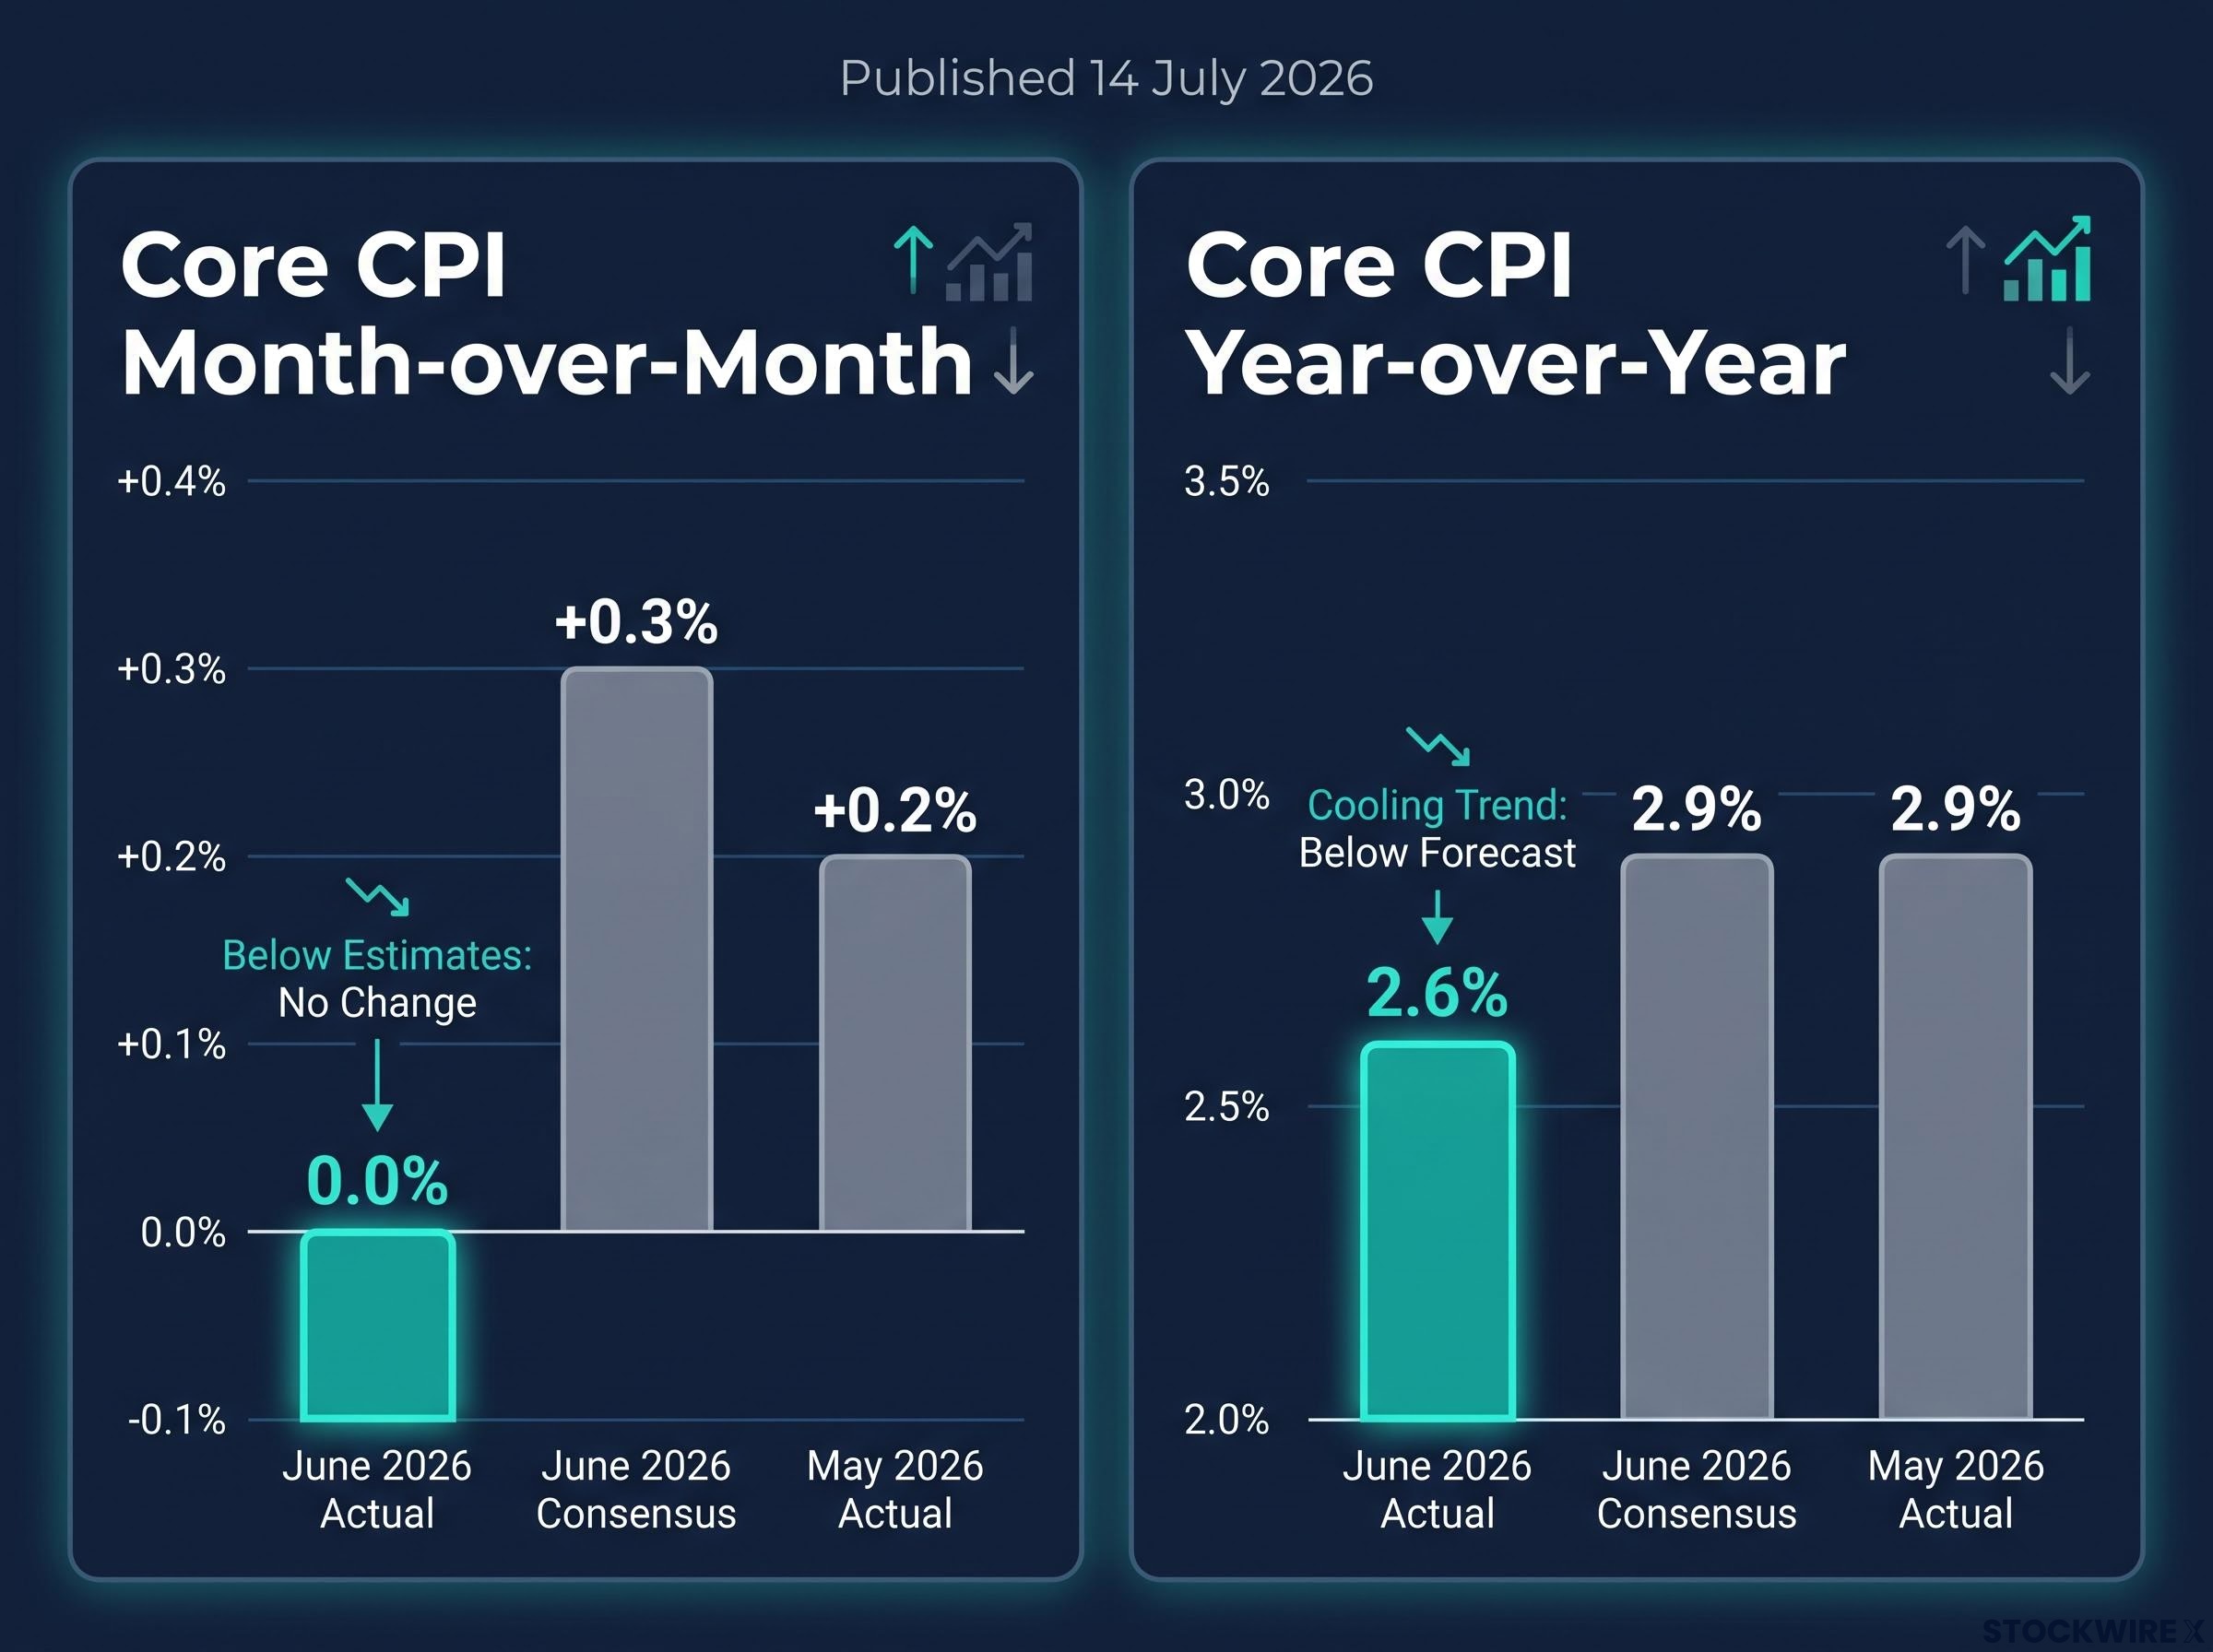
The miss: Core CPI landed 0.3 percentage points below the consensus forecast for the month, the largest downside surprise in the metric that matters most for Fed policy.
Core CPI strips out food and energy prices because those categories swing on supply shocks, weather patterns, and geopolitical disruption rather than on the demand-side forces the Fed can actually influence. That is what makes a core reading of 0.0% more analytically significant than any energy-driven headline move.
| Core CPI Measure | June 2026 Actual | June 2026 Consensus | May 2026 Actual |
|---|---|---|---|
| Month-over-month | 0.0% | +0.3% | +0.2% |
| Year-over-year | 2.6% | 2.9% | 2.9% |
The deceleration from 2.9% to 2.6% on an annual basis is not a rounding artefact. Underlying inflation momentum has stalled in a way that gives the Fed genuine room to consider rate cuts sooner than markets had been pricing in before this morning.
When big ASX news breaks, our subscribers know first
The headline number confirms the trend, driven largely by falling energy costs
June saw headline CPI post a 0.4% month-over-month drop, its sharpest single-month fall since April 2020. On an annual basis, headline inflation decelerated to 3.5%, down sharply from May’s 4.2% and well below the consensus forecast of approximately 3.8%.
Falling gasoline prices were a primary contributor. That matters for context, because energy costs are precisely the volatile component that core CPI is designed to exclude. When petrol prices drop, headline CPI can move dramatically in a single month without signalling a lasting shift in underlying inflation. The reverse is also true: when energy spikes, headline CPI can overstate the inflation problem.
The monthly swing from May to June was 0.9 percentage points, a reversal from +0.5% to -0.4%. That tells you the direction of travel has shifted sharply, but the gasoline-influenced headline is not the full inflation story. Read it alongside the core number.
| Metric | June 2026 Actual | June 2026 Consensus | May 2026 Actual |
|---|---|---|---|
| Headline CPI (monthly) | -0.4% | -0.1% | +0.5% |
| Headline CPI (annual) | 3.5% | ~3.8% | 4.2% |
| Core CPI (monthly) | 0.0% | +0.3% | +0.2% |
| Core CPI (annual) | 2.6% | 2.9% | 2.9% |
The April 2020 comparison provides scale, but the conditions were entirely different: that decline reflected pandemic-era demand destruction, not a cooling inflationary cycle. Today’s drop is happening within a functioning economy, which makes it a more meaningful signal.
The May 2026 inflation report recorded headline CPI at 4.2% year-over-year, driven almost entirely by a 40.5% annual surge in gasoline prices tied to the Iran conflict, while core CPI held at a comparatively contained 2.9%, establishing the baseline from which June’s sharp deceleration now departs.
What CPI actually measures, and why the two readings tell different stories
If you have seen one headline citing -0.4% and another citing 2.6%, both are accurate. They are measuring different things.
The Consumer Price Index, published monthly by the BLS, tracks the average price change for a fixed basket of goods and services purchased by urban consumers across the United States. It covers everything from rent and groceries to medical care and transport. The 14 July 2026 release covers prices collected during June.
Why the Fed focuses on core rather than headline
The distinction between headline and core CPI exists because food and energy prices are subject to supply shocks, seasonal swings, and geopolitical disruption that sit outside the Fed’s control. Stripping those items out gives a cleaner read on demand-driven inflation, which is what monetary policy can actually influence.
What core CPI excludes:
- Gasoline and fuel costs
- Electricity and natural gas prices
- Grocery and food-at-home prices
- Restaurant and food-away-from-home prices
This is why today’s data can show headline CPI falling 0.4% while core CPI sits at 0.0%: gasoline prices pulled the headline lower, but the underlying basket barely moved. Understanding that distinction means you can read future reports critically rather than reacting to whichever number a headline chooses to lead with.
One important nuance: the Fed’s official 2% inflation target is measured against the Personal Consumption Expenditures (PCE) index, a separate measure published by the Bureau of Economic Analysis. But CPI is the most closely watched leading indicator of where PCE is heading, and at 2.6% core CPI, the gap to target has narrowed meaningfully.
The Federal Reserve’s 2% inflation target is formally measured against the PCE index, not CPI, a distinction the Fed has made explicit in its official policy framework, though CPI remains the most widely followed leading indicator of where PCE is heading.
What today’s data means for Federal Reserve rate decisions
The combination of 0.0% core monthly inflation and 2.6% core annual inflation materially strengthens the case for earlier rate cuts. Most forecasters entering this week expected headline CPI to remain above 4% annually and core to print near 3%. Both came in well below those levels.
The Fed’s June rate decision, which held the federal funds target at 3.50%-3.75% while Warsh signalled a preference for trimmed mean PCE as his inflation scorecard, is the policy backdrop against which today’s CPI surprise lands, and investors who understood Warsh’s framework were already watching core measures more closely than the headline.
The core CPI trajectory is the figure to anchor on.
Core CPI decelerated from 2.9% year-over-year in May to 2.6% in June, a 0.3 percentage point narrowing of the gap to the Fed’s target in a single month.
If that pace of deceleration continues, the Fed’s path toward rate cuts could accelerate beyond what had been priced in before today. For investors holding rate-sensitive assets, today’s print means the probability of a cut arriving earlier than previously expected has risen in a concrete, data-driven way.
What the Fed needs to see before cutting rates
One report does not make a trend, and the Fed has signalled repeatedly that it wants consistent evidence of inflation returning toward target before easing policy. Today’s data is one significant data point, not a guaranteed trigger.
The upcoming data calendar will determine whether this print is confirmed as a trend or treated as an outlier. The next PCE release, the following month’s CPI report, and labour market data will all shape the Fed’s assessment. But the direction of the evidence has shifted, and the burden of proof for those arguing against a near-term cut just got heavier.
Mortgage rates, credit costs, and rate-sensitive markets: who benefits and how
The transmission mechanism runs in a straight line: lower inflation leads to lower expected policy rates, which over time feeds into lower borrowing costs across the economy. Today’s CPI surprise has moved that chain forward.
The asset classes and cost categories most directly affected:
- U.S. Treasuries: Lower rate expectations push bond prices higher and yields lower
- Mortgage-backed securities: Benefit from the same rate repricing as Treasuries
- REITs: Real estate investment trusts are among the most rate-sensitive equity sectors
- Growth equities: Lower discount rates support higher valuations for future earnings
- Household borrowing costs: Mortgage rates, auto loan rates, and credit card rates could ease over time if the Fed follows through
If you carry a variable-rate mortgage, hold bonds, or have a meaningful allocation to rate-sensitive equities, today’s CPI print has moved the probability of a more favourable rate environment in your direction. The market had not priced in a result this far below consensus ahead of this morning’s release.
The qualifier matters, though: the transmission from a CPI surprise to actual rate changes at the consumer level takes months and is not guaranteed by any single report.
The transmission mechanism is also slower than most market commentary implies: long and variable lags in monetary policy mean the rate changes the Fed implements today typically take 12-18 months to fully filter through mortgage markets, business lending, and consumer credit, which is why one strong CPI print does not mechanically produce an immediate easing in borrowing costs.
This article is for informational purposes only and should not be considered financial advice. Investors should conduct their own research and consult with financial professionals before making investment decisions.
What the data changes, and what it does not
Today’s US CPI report delivered a genuine inflection point in the short-term inflation story. A -0.4% headline monthly print and a 0.0% core monthly reading, both well below consensus, represent the strongest single-month evidence in over a year that inflation is decelerating faster than expected.
That changes the baseline expectation for Fed policy. It does not guarantee a rate cut.
Three data points and events to monitor in the weeks ahead:
- The next PCE release, the Fed’s preferred inflation measure
- The following month’s CPI report, to confirm or challenge the June trend
- Any Federal Reserve communications responding to today’s data
The April 2020 comparison is a useful reminder: single-month extremes carry context, and inflation trends can reverse quickly. Today’s data is most useful as evidence of direction rather than certainty of destination. Investors and households who act as if rate cuts are certain rather than increasingly probable are reading more into one month’s numbers than the evidence supports.
For investors looking to act on today’s rate repricing signal rather than simply observe it, our full explainer on bond portfolio positioning covers how institutional managers at BlackRock, PIMCO, and Vanguard are calibrating duration across the yield curve as the rate environment shifts.
Past performance does not guarantee future results. Financial projections are subject to market conditions and various risk factors.